OFFERING MEMORANDUM - REDI-net.com
OFFERING MEMORANDUM - REDI-net.com
OFFERING MEMORANDUM - REDI-net.com

You also want an ePaper? Increase the reach of your titles
YUMPU automatically turns print PDFs into web optimized ePapers that Google loves.
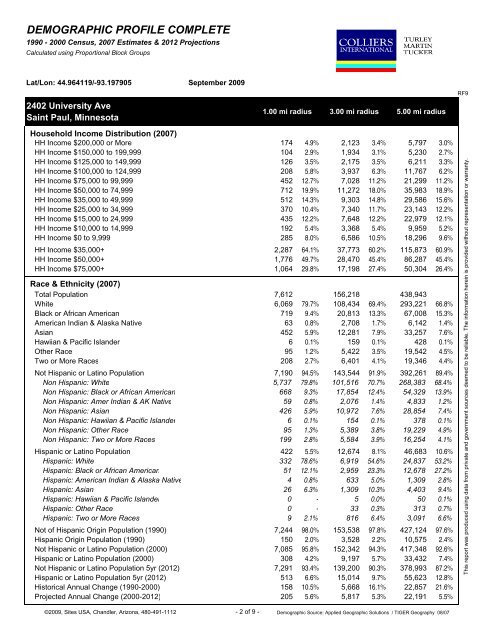
DEMOGRAPHIC PROFILE COMPLETE1990 - 2000 Census, 2007 Estimates & 2012 ProjectionsCalculated using Proportional Block GroupsLat/Lon: 44.964119/-93.1979052402 University AveSaint Paul, MinnesotaSeptember 20091.00 mi radius 3.00 mi radius5.00 mi radiusRF9Household In<strong>com</strong>e Distribution (2007)HH In<strong>com</strong>e $200,000 or More 174 4.9% 2,123 3.4% 5,797 3.0%HH In<strong>com</strong>e $150,000 to 199,999 104 2.9% 1,934 3.1% 5,230 2.7%HH In<strong>com</strong>e $125,000 to 149,999 126 3.5% 2,175 3.5% 6,211 3.3%HH In<strong>com</strong>e $100,000 to 124,999 208 5.8% 3,937 6.3% 11,767 6.2%HH In<strong>com</strong>e $75,000 to 99,999 452 12.7% 7,028 11.2% 21,299 11.2%HH In<strong>com</strong>e $50,000 to 74,999 712 19.9% 11,272 18.0% 35,983 18.9%HH In<strong>com</strong>e $35,000 to 49,999 512 14.3% 9,303 14.8% 29,586 15.6%HH In<strong>com</strong>e $25,000 to 34,999 370 10.4% 7,340 11.7% 23,143 12.2%HH In<strong>com</strong>e $15,000 to 24,999 435 12.2% 7,648 12.2% 22,979 12.1%HH In<strong>com</strong>e $10,000 to 14,999 192 5.4% 3,368 5.4% 9,959 5.2%HH In<strong>com</strong>e $0 to 9,999 285 8.0% 6,586 10.5% 18,296 9.6%HH In<strong>com</strong>e $35,000+ 2,287 64.1% 37,773 60.2% 115,873 60.9%HH In<strong>com</strong>e $50,000+ 1,776 49.7% 28,470 45.4% 86,287 45.4%HH In<strong>com</strong>e $75,000+ 1,064 29.8% 17,198 27.4% 50,304 26.4%Race & Ethnicity (2007)Total Population 7,612 156,218 438,943White 6,069 79.7% 108,434 69.4% 293,221 66.8%Black or African American 719 9.4% 20,813 13.3% 67,008 15.3%American Indian & Alaska Native 63 0.8% 2,708 1.7% 6,142 1.4%Asian 452 5.9% 12,281 7.9% 33,257 7.6%Hawiian & Pacific Islander 6 0.1% 159 0.1% 428 0.1%Other Race 95 1.2% 5,422 3.5% 19,542 4.5%Two or More Races 208 2.7% 6,401 4.1% 19,346 4.4%Not Hispanic or Latino Population 7,190 94.5% 143,544 91.9% 392,261 89.4%Non Hispanic: White 5,737 79.8% 101,516 70.7% 268,383 68.4%Non Hispanic: Black or African American 668 9.3% 17,854 12.4% 54,329 13.9%Non Hispanic: Amer Indian & AK Native 59 0.8% 2,076 1.4% 4,833 1.2%Non Hispanic: Asian 426 5.9% 10,972 7.6% 28,854 7.4%Non Hispanic: Hawiian & Pacific Islander 6 0.1% 154 0.1% 378 0.1%Non Hispanic: Other Race 95 1.3% 5,389 3.8% 19,229 4.9%Non Hispanic: Two or More Races 199 2.8% 5,584 3.9% 16,254 4.1%Hispanic or Latino Population 422 5.5% 12,674 8.1% 46,683 10.6%Hispanic: White 332 78.6% 6,919 54.6% 24,837 53.2%Hispanic: Black or African American 51 12.1% 2,959 23.3% 12,678 27.2%Hispanic: American Indian & Alaska Native 4 0.8% 633 5.0% 1,309 2.8%Hispanic: Asian 26 6.3% 1,309 10.3% 4,403 9.4%Hispanic: Hawiian & Pacific Islander 0 - 5 0.0% 50 0.1%Hispanic: Other Race 0 - 33 0.3% 313 0.7%Hispanic: Two or More Races 9 2.1% 816 6.4% 3,091 6.6%Not of Hispanic Origin Population (1990) 7,244 98.0% 153,538 97.8% 427,124 97.6%Hispanic Origin Population (1990) 150 2.0% 3,528 2.2% 10,575 2.4%Not Hispanic or Latino Population (2000) 7,085 95.8% 152,342 94.3% 417,348 92.6%Hispanic or Latino Population (2000) 308 4.2% 9,197 5.7% 33,432 7.4%Not Hispanic or Latino Population 5yr (2012) 7,291 93.4% 139,200 90.3% 378,993 87.2%Hispanic or Latino Population 5yr (2012) 513 6.6% 15,014 9.7% 55,623 12.8%Historical Annual Change (1990-2000) 158 10.5% 5,668 16.1% 22,857 21.6%Projected Annual Change (2000-2012) 205 5.6% 5,817 5.3% 22,191 5.5%This report was produced using data from private and government sources deemed to be reliable. The information herein is provided without representation or warranty.©2009, Sites USA, Chandler, Arizona, 480-491-1112 - 2 of 9 - Demographic Source: Applied Geographic Solutions / TIGER Geography 08/07