OFFERING MEMORANDUM - REDI-net.com
OFFERING MEMORANDUM - REDI-net.com
OFFERING MEMORANDUM - REDI-net.com

Create successful ePaper yourself
Turn your PDF publications into a flip-book with our unique Google optimized e-Paper software.
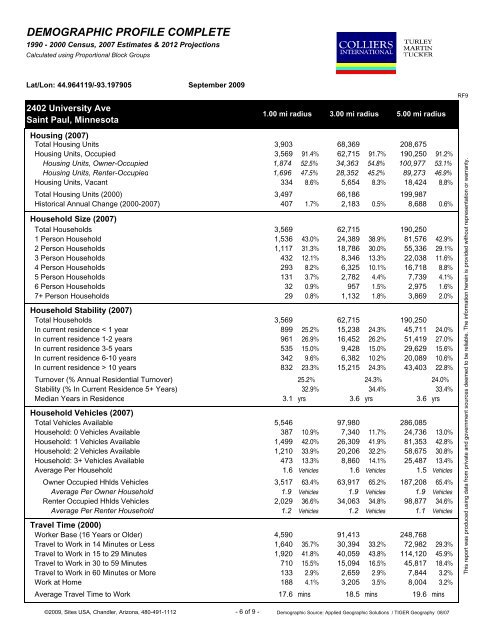
DEMOGRAPHIC PROFILE COMPLETE1990 - 2000 Census, 2007 Estimates & 2012 ProjectionsCalculated using Proportional Block GroupsLat/Lon: 44.964119/-93.1979052402 University AveSaint Paul, MinnesotaSeptember 20091.00 mi radius 3.00 mi radius5.00 mi radiusRF9Housing (2007)Total Housing Units 3,903 68,369 208,675Housing Units, Occupied 3,569 91.4% 62,715 91.7% 190,250 91.2%Housing Units, Owner-Occupied 1,874 52.5% 34,363 54.8% 100,977 53.1%Housing Units, Renter-Occupied 1,696 47.5% 28,352 45.2% 89,273 46.9%Housing Units, Vacant 334 8.6% 5,654 8.3% 18,424 8.8%Total Housing Units (2000) 3,497 66,186 199,987Historical Annual Change (2000-2007) 407 1.7% 2,183 0.5% 8,688 0.6%Household Size (2007)Total Households 3,569 62,715 190,2501 Person Household 1,536 43.0% 24,389 38.9% 81,576 42.9%2 Person Households 1,117 31.3% 18,786 30.0% 55,336 29.1%3 Person Households 432 12.1% 8,346 13.3% 22,038 11.6%4 Person Households 293 8.2% 6,325 10.1% 16,718 8.8%5 Person Households 131 3.7% 2,782 4.4% 7,739 4.1%6 Person Households 32 0.9% 957 1.5% 2,975 1.6%7+ Person Households 29 0.8% 1,132 1.8% 3,869 2.0%Household Stability (2007)Total Households 3,569 62,715 190,250In current residence < 1 year 899 25.2% 15,238 24.3% 45,711 24.0%In current residence 1-2 years 961 26.9% 16,452 26.2% 51,419 27.0%In current residence 3-5 years 535 15.0% 9,428 15.0% 29,629 15.6%In current residence 6-10 years 342 9.6% 6,382 10.2% 20,089 10.6%In current residence > 10 years 832 23.3% 15,215 24.3% 43,403 22.8%Turnover (% Annual Residential Turnover) 25.2% 24.3% 24.0%Stability (% In Current Residence 5+ Years) 32.9% 34.4% 33.4%Median Years in Residence 3.1 yrs 3.6 yrs 3.6 yrsHousehold Vehicles (2007)Total Vehicles Available 5,546 97,980 286,085Household: 0 Vehicles Available 387 10.9% 7,340 11.7% 24,736 13.0%Household: 1 Vehicles Available 1,499 42.0% 26,309 41.9% 81,353 42.8%Household: 2 Vehicles Available 1,210 33.9% 20,206 32.2% 58,675 30.8%Household: 3+ Vehicles Available 473 13.3% 8,860 14.1% 25,487 13.4%Average Per Household 1.6 Vehicles 1.6 Vehicles 1.5 VehiclesOwner Occupied Hhlds Vehicles 3,517 63.4% 63,917 65.2% 187,208 65.4%Average Per Owner Household 1.9 Vehicles 1.9 Vehicles 1.9 VehiclesRenter Occupied Hhlds Vehicles 2,029 36.6% 34,063 34.8% 98,877 34.6%Average Per Renter Household 1.2 Vehicles 1.2 Vehicles 1.1 VehiclesTravel Time (2000)Worker Base (16 Years or Older) 4,590 91,413 248,768Travel to Work in 14 Minutes or Less 1,640 35.7% 30,394 33.2% 72,982 29.3%Travel to Work in 15 to 29 Minutes 1,920 41.8% 40,059 43.8% 114,120 45.9%Travel to Work in 30 to 59 Minutes 710 15.5% 15,094 16.5% 45,817 18.4%Travel to Work in 60 Minutes or More 133 2.9% 2,659 2.9% 7,844 3.2%Work at Home 188 4.1% 3,205 3.5% 8,004 3.2%Average Travel Time to Work 17.6 mins 18.5 mins 19.6 minsThis report was produced using data from private and government sources deemed to be reliable. The information herein is provided without representation or warranty.©2009, Sites USA, Chandler, Arizona, 480-491-1112 - 6 of 9 - Demographic Source: Applied Geographic Solutions / TIGER Geography 08/07