OFFERING MEMORANDUM - REDI-net.com
OFFERING MEMORANDUM - REDI-net.com
OFFERING MEMORANDUM - REDI-net.com

You also want an ePaper? Increase the reach of your titles
YUMPU automatically turns print PDFs into web optimized ePapers that Google loves.
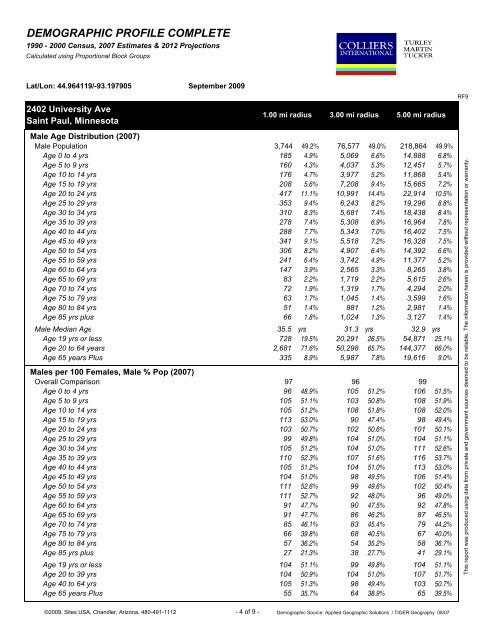
DEMOGRAPHIC PROFILE COMPLETE1990 - 2000 Census, 2007 Estimates & 2012 ProjectionsCalculated using Proportional Block GroupsLat/Lon: 44.964119/-93.1979052402 University AveSaint Paul, MinnesotaSeptember 20091.00 mi radius 3.00 mi radius5.00 mi radiusRF9Male Age Distribution (2007)Male Population 3,744 49.2% 76,577 49.0% 218,864 49.9%Age 0 to 4 yrs 185 4.9% 5,069 6.6% 14,888 6.8%Age 5 to 9 yrs 160 4.3% 4,037 5.3% 12,451 5.7%Age 10 to 14 yrs 176 4.7% 3,977 5.2% 11,868 5.4%Age 15 to 19 yrs 208 5.6% 7,208 9.4% 15,665 7.2%Age 20 to 24 yrs 417 11.1% 10,991 14.4% 22,914 10.5%Age 25 to 29 yrs 353 9.4% 6,243 8.2% 19,296 8.8%Age 30 to 34 yrs 310 8.3% 5,681 7.4% 18,438 8.4%Age 35 to 39 yrs 278 7.4% 5,308 6.9% 16,964 7.8%Age 40 to 44 yrs 288 7.7% 5,343 7.0% 16,402 7.5%Age 45 to 49 yrs 341 9.1% 5,518 7.2% 16,328 7.5%Age 50 to 54 yrs 306 8.2% 4,907 6.4% 14,392 6.6%Age 55 to 59 yrs 241 6.4% 3,742 4.9% 11,377 5.2%Age 60 to 64 yrs 147 3.9% 2,565 3.3% 8,265 3.8%Age 65 to 69 yrs 83 2.2% 1,719 2.2% 5,615 2.6%Age 70 to 74 yrs 72 1.9% 1,319 1.7% 4,294 2.0%Age 75 to 79 yrs 63 1.7% 1,045 1.4% 3,599 1.6%Age 80 to 84 yrs 51 1.4% 881 1.2% 2,981 1.4%Age 85 yrs plus 66 1.8% 1,024 1.3% 3,127 1.4%Male Median Age 35.5 yrs 31.3 yrs 32.9 yrsAge 19 yrs or less 728 19.5% 20,291 26.5% 54,871 25.1%Age 20 to 64 years 2,681 71.6% 50,298 65.7% 144,377 66.0%Age 65 years Plus 335 8.9% 5,987 7.8% 19,616 9.0%Males per 100 Females, Male % Pop (2007)Overall Comparison 97 96 99Age 0 to 4 yrs 96 48.9% 105 51.2% 106 51.5%Age 5 to 9 yrs 105 51.1% 103 50.8% 108 51.9%Age 10 to 14 yrs 105 51.2% 108 51.8% 108 52.0%Age 15 to 19 yrs 113 53.0% 90 47.4% 98 49.4%Age 20 to 24 yrs 103 50.7% 102 50.6% 101 50.1%Age 25 to 29 yrs 99 49.8% 104 51.0% 104 51.1%Age 30 to 34 yrs 105 51.2% 104 51.0% 111 52.6%Age 35 to 39 yrs 110 52.3% 107 51.6% 116 53.7%Age 40 to 44 yrs 105 51.2% 104 51.0% 113 53.0%Age 45 to 49 yrs 104 51.0% 98 49.5% 106 51.4%Age 50 to 54 yrs 111 52.6% 99 49.6% 102 50.4%Age 55 to 59 yrs 111 52.7% 92 48.0% 96 49.0%Age 60 to 64 yrs 91 47.7% 90 47.5% 92 47.8%Age 65 to 69 yrs 91 47.7% 86 46.2% 87 46.5%Age 70 to 74 yrs 85 46.1% 83 45.4% 79 44.2%Age 75 to 79 yrs 66 39.8% 68 40.5% 67 40.0%Age 80 to 84 yrs 57 36.2% 54 35.2% 58 36.7%Age 85 yrs plus 27 21.3% 38 27.7% 41 29.1%Age 19 yrs or less 104 51.1% 99 49.8% 104 51.1%Age 20 to 39 yrs 104 50.9% 104 51.0% 107 51.7%Age 40 to 64 yrs 105 51.3% 98 49.4% 103 50.7%Age 65 years Plus 55 35.7% 64 38.9% 65 39.5%This report was produced using data from private and government sources deemed to be reliable. The information herein is provided without representation or warranty.©2009, Sites USA, Chandler, Arizona, 480-491-1112 - 4 of 9 - Demographic Source: Applied Geographic Solutions / TIGER Geography 08/07