OFFERING MEMORANDUM - REDI-net.com
OFFERING MEMORANDUM - REDI-net.com
OFFERING MEMORANDUM - REDI-net.com

Create successful ePaper yourself
Turn your PDF publications into a flip-book with our unique Google optimized e-Paper software.
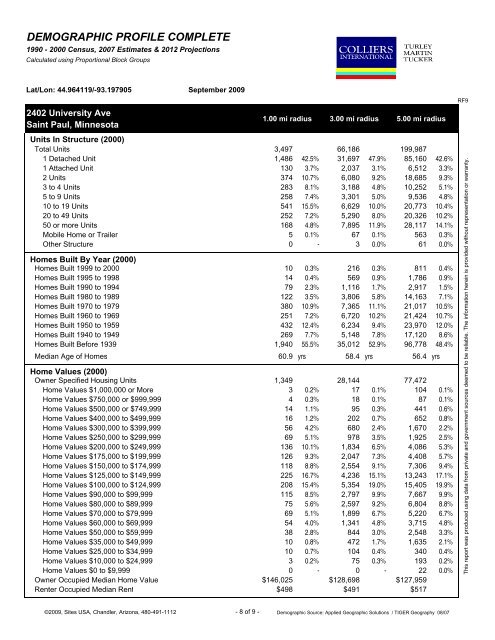
DEMOGRAPHIC PROFILE COMPLETE1990 - 2000 Census, 2007 Estimates & 2012 ProjectionsCalculated using Proportional Block GroupsLat/Lon: 44.964119/-93.1979052402 University AveSaint Paul, MinnesotaSeptember 20091.00 mi radius 3.00 mi radius5.00 mi radiusUnits In Structure (2000)Total Units 3,497 66,186 199,9871 Detached Unit 1,486 42.5% 31,697 47.9% 85,160 42.6%1 Attached Unit 130 3.7% 2,037 3.1% 6,512 3.3%2 Units 374 10.7% 6,080 9.2% 18,685 9.3%3 to 4 Units 283 8.1% 3,188 4.8% 10,252 5.1%5 to 9 Units 258 7.4% 3,301 5.0% 9,536 4.8%10 to 19 Units 541 15.5% 6,629 10.0% 20,773 10.4%20 to 49 Units 252 7.2% 5,290 8.0% 20,326 10.2%50 or more Units 168 4.8% 7,895 11.9% 28,117 14.1%Mobile Home or Trailer 5 0.1% 67 0.1% 563 0.3%Other Structure 0 - 3 0.0% 61 0.0%Homes Built By Year (2000)Homes Built 1999 to 2000 10 0.3% 216 0.3% 811 0.4%Homes Built 1995 to 1998 14 0.4% 569 0.9% 1,786 0.9%Homes Built 1990 to 1994 79 2.3% 1,116 1.7% 2,917 1.5%Homes Built 1980 to 1989 122 3.5% 3,806 5.8% 14,163 7.1%Homes Built 1970 to 1979 380 10.9% 7,365 11.1% 21,017 10.5%Homes Built 1960 to 1969 251 7.2% 6,720 10.2% 21,424 10.7%Homes Built 1950 to 1959 432 12.4% 6,234 9.4% 23,970 12.0%Homes Built 1940 to 1949 269 7.7% 5,148 7.8% 17,120 8.6%Homes Built Before 1939 1,940 55.5% 35,012 52.9% 96,778 48.4%Median Age of Homes 60.9 yrs 58.4 yrs 56.4 yrsHome Values (2000)Owner Specified Housing Units 1,349 28,144 77,472Home Values $1,000,000 or More 3 0.2% 17 0.1% 104 0.1%Home Values $750,000 or $999,999 4 0.3% 18 0.1% 87 0.1%Home Values $500,000 or $749,999 14 1.1% 95 0.3% 441 0.6%Home Values $400,000 to $499,999 16 1.2% 202 0.7% 652 0.8%Home Values $300,000 to $399,999 56 4.2% 680 2.4% 1,670 2.2%Home Values $250,000 to $299,999 69 5.1% 978 3.5% 1,925 2.5%Home Values $200,000 to $249,999 136 10.1% 1,834 6.5% 4,086 5.3%Home Values $175,000 to $199,999 126 9.3% 2,047 7.3% 4,408 5.7%Home Values $150,000 to $174,999 118 8.8% 2,554 9.1% 7,306 9.4%Home Values $125,000 to $149,999 225 16.7% 4,236 15.1% 13,243 17.1%Home Values $100,000 to $124,999 208 15.4% 5,354 19.0% 15,405 19.9%Home Values $90,000 to $99,999 115 8.5% 2,797 9.9% 7,667 9.9%Home Values $80,000 to $89,999 75 5.6% 2,597 9.2% 6,804 8.8%Home Values $70,000 to $79,999 69 5.1% 1,899 6.7% 5,220 6.7%Home Values $60,000 to $69,999 54 4.0% 1,341 4.8% 3,715 4.8%Home Values $50,000 to $59,999 38 2.8% 844 3.0% 2,548 3.3%Home Values $35,000 to $49,999 10 0.8% 472 1.7% 1,635 2.1%Home Values $25,000 to $34,999 10 0.7% 104 0.4% 340 0.4%Home Values $10,000 to $24,999 3 0.2% 75 0.3% 193 0.2%Home Values $0 to $9,999 0 - 0 - 22 0.0%Owner Occupied Median Home Value $146,025 $128,698 $127,959Renter Occupied Median Rent $498 $491 $517RF9This report was produced using data from private and government sources deemed to be reliable. The information herein is provided without representation or warranty.©2009, Sites USA, Chandler, Arizona, 480-491-1112 - 8 of 9 - Demographic Source: Applied Geographic Solutions / TIGER Geography 08/07