seawater desalination in a direct contact heat exchanger
seawater desalination in a direct contact heat exchanger
seawater desalination in a direct contact heat exchanger

You also want an ePaper? Increase the reach of your titles
YUMPU automatically turns print PDFs into web optimized ePapers that Google loves.
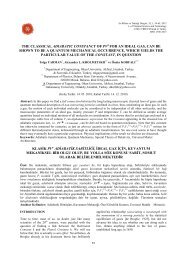
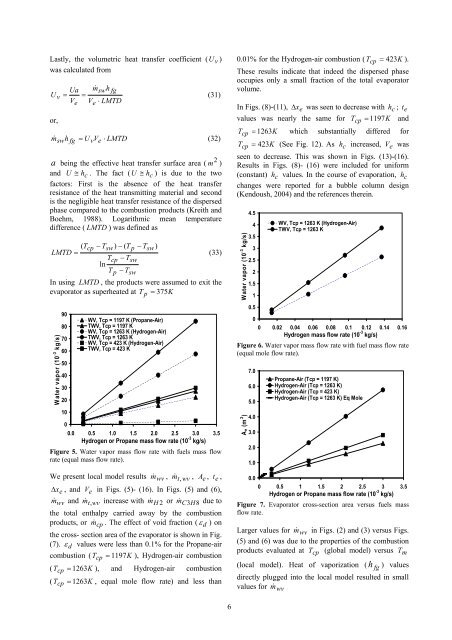
Lastly, the volumetric <strong>heat</strong> transfer coefficient ( U v )was calculated fromUa m&swhfgU v = =VeVe⋅ LMTDor,(31)m& swhfg = U vVe⋅ LMTD(32)2a be<strong>in</strong>g the effective <strong>heat</strong> transfer surface area ( m )and U ≅ hc. The fact ( U ≅ hc) is due to the twofactors: First is the absence of the <strong>heat</strong> transferresistance of the <strong>heat</strong> transmitt<strong>in</strong>g material and secondis the negligible <strong>heat</strong> transfer resistance of the dispersedphase compared to the combustion products (Kreith andBoehm, 1988). Logarithmic mean temperaturedifference ( LMTD ) was def<strong>in</strong>ed as( Tcp− Tsw)− ( Tp− Tsw)LMTD =(33)Tcp− TswlnTp− TswIn us<strong>in</strong>g LMTD , the products were assumed to exit theevaporator as super<strong>heat</strong>ed at T p = 375KWater vapor (10 -3 kg/s)9080706050403020100WV, Tcp = 1197 K (Propane-Air)TWV, Tcp = 1197 KWV, Tcp = 1263 K (Hydrogen-Air)TWV, Tcp = 1263 KWV, Tcp = 423 K (Hydrogen-Air)TWV, Tcp = 423 K0.0 0.5 1.0 1.5 2.0 2.5 3.0 3.5Hydrogen or Propane mass flow rate (10 -3 kg/s)Figure 5. Water vapor mass flow rate with fuels mass flowrate (equal mass flow rate).We present local model resultsm& wv , m & t , wv , A e , t e ,Δ x e , and V e <strong>in</strong> Figs. (5)- (16). In Figs. (5) and (6),m& wv and m & t , wv <strong>in</strong>crease with m& H 2 or m& C3H8due tothe total enthalpy carried away by the combustionproducts, or m& cp . The effect of void fraction ( ε d ) onthe cross- section area of the evaporator is shown <strong>in</strong> Fig.(7). ε d values were less than 0.1% for the Propane-aircombustion ( T cp = 1197K), Hydrogen-air combustion( T cp = 1263K), and Hydrogen-air combustion( T cp = 1263K, equal mole flow rate) and less than0.01% for the Hydrogen-air combustion ( T cp = 423K).These results <strong>in</strong>dicate that <strong>in</strong>deed the dispersed phaseoccupies only a small fraction of the total evaporatorvolume.In Figs. (8)-(11),values was nearly the same forΔ xewas seen to decrease with h c ; t eT cp = 1197KandT cp = 1263K which substantially differed forT cp = 423K (See Fig. 12). As h c <strong>in</strong>creased, V e wasseen to decrease. This was shown <strong>in</strong> Figs. (13)-(16).Results <strong>in</strong> Figs. (8)- (16) were <strong>in</strong>cluded for uniform(constant) h c values. In the course of evaporation, h cchanges were reported for a bubble column design(Kendoush, 2004) and the references there<strong>in</strong>.Water vapor (10 -3 kg/s)4.543.532.521.510.50WV, Tcp = 1263 K (Hydrogen-Air)TWV, Tcp = 1263 K0 0.02 0.04 0.06 0.08 0.1 0.12 0.14 0.16Hydrogen mass flow rate (10 -3 kg/s)Figure 6. Water vapor mass flow rate with fuel mass flow rate(equal mole flow rate).Ae (m 2 )7.06.05.04.03.02.01.00.0Propane-Air (Tcp = 1197 K)Hydrogen-Air (Tcp = 1263 K)Hydrogen-Air (Tcp = 423 K)Hydrogen-Air (Tcp = 1263 K) Eq Mole0 0.5 1 1.5 2 2.5 3 3.5Hydrogen or Propane mass flow rate (10 -3 kg/s)Figure 7. Evaporator cross-section area versus fuels massflow rate.Larger values for m& wv <strong>in</strong> Figs. (2) and (3) versus Figs.(5) and (6) was due to the properties of the combustionproducts evaluated at T cp (global model) versus T m(local model). Heat of vaporization ( h fg ) values<strong>direct</strong>ly plugged <strong>in</strong>to the local model resulted <strong>in</strong> smallvalues for m& wv6