

Annual Report 2005 - Publications Unit - The University of Western ...
Annual Report 2005 - Publications Unit - The University of Western ...
Annual Report 2005 - Publications Unit - The University of Western ...
- No tags were found...

Create successful ePaper yourself
Turn your PDF publications into a flip-book with our unique Google optimized e-Paper software.
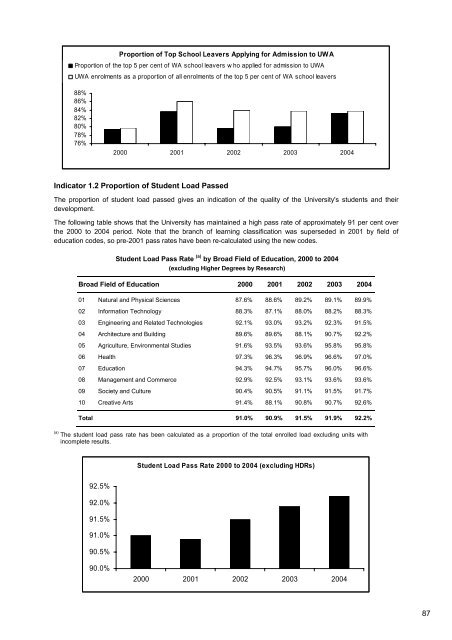
Proportion <strong>of</strong> Top School Leavers Applying for Admission to UWAProportion <strong>of</strong> the top 5 per cent <strong>of</strong> WA school leavers w ho applied for admission to UWAUWA enrolments as a proportion <strong>of</strong> all enrolments <strong>of</strong> the top 5 per cent <strong>of</strong> WA school leavers88%86%84%82%80%78%76%2000 2001 2002 2003 2004Indicator 1.2 Proportion <strong>of</strong> Student Load Passed<strong>The</strong> proportion <strong>of</strong> student load passed gives an indication <strong>of</strong> the quality <strong>of</strong> the <strong>University</strong>'s students and theirdevelopment.<strong>The</strong> following table shows that the <strong>University</strong> has maintained a high pass rate <strong>of</strong> approximately 91 per cent overthe 2000 to 2004 period. Note that the branch <strong>of</strong> learning classification was superseded in 2001 by field <strong>of</strong>education codes, so pre-2001 pass rates have been re-calculated using the new codes.Student Load Pass Rate (a) by Broad Field <strong>of</strong> Education, 2000 to 2004(excluding Higher Degrees by Research)Broad Field <strong>of</strong> Education 2000 2001 2002 2003 200401 Natural and Physical Sciences 87.6% 88.6% 89.2% 89.1% 89.9%02 Information Technology 88.3% 87.1% 88.0% 88.2% 88.3%03 Engineering and Related Technologies 92.1% 93.0% 93.2% 92.3% 91.5%04 Architecture and Building 89.6% 89.6% 88.1% 90.7% 92.2%05 Agriculture, Environmental Studies 91.6% 93.5% 93.6% 95.8% 95.8%06 Health 97.3% 96.3% 96.9% 96.6% 97.0%07 Education 94.3% 94.7% 95.7% 96.0% 96.6%08 Management and Commerce 92.9% 92.5% 93.1% 93.6% 93.6%09 Society and Culture 90.4% 90.5% 91.1% 91.5% 91.7%10 Creative Arts 91.4% 88.1% 90.8% 90.7% 92.6%Total 91.0% 90.9% 91.5% 91.9% 92.2%(a)<strong>The</strong> student load pass rate has been calculated as a proportion <strong>of</strong> the total enrolled load excluding units withincomplete results.Student Load Pass Rate 2000 to 2004 (excluding HDRs)92.5%92.0%91.5%91.0%90.5%90.0%2000 2001 2002 2003 200487


