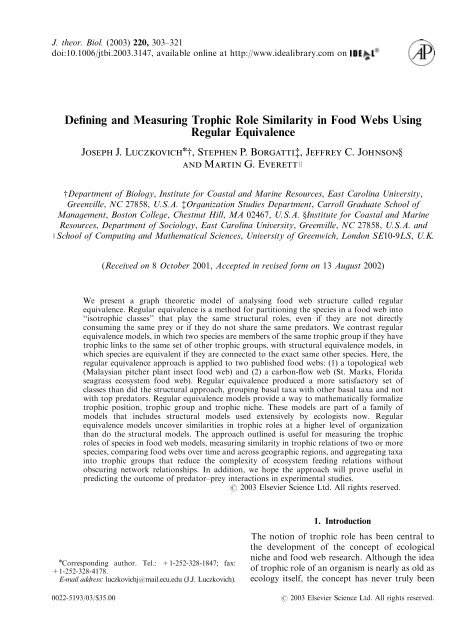
Defining and Measuring Trophic Role Similarity in Food Webs Using ...
Defining and Measuring Trophic Role Similarity in Food Webs Using ...
Defining and Measuring Trophic Role Similarity in Food Webs Using ...

You also want an ePaper? Increase the reach of your titles
YUMPU automatically turns print PDFs into web optimized ePapers that Google loves.
304J. J. LUCZKOVICH ET AL.formally def<strong>in</strong>ed. Elton (1927) first def<strong>in</strong>ed theniche as the fundamental role of an organism <strong>in</strong>its community F largely <strong>in</strong> its relation to food<strong>and</strong> to enemies. In def<strong>in</strong><strong>in</strong>g a species’ role <strong>in</strong> thecommunity, Elton drew an analogy with socialroles <strong>in</strong> human communities. S<strong>in</strong>ce that earlydef<strong>in</strong>ition, numerous authors have discussedideas related to trophic role, def<strong>in</strong><strong>in</strong>g <strong>and</strong> us<strong>in</strong>gdifferent terms such as trophic level (L<strong>in</strong>demann,1942), trophic niche (Hutch<strong>in</strong>son, 1958), ecologicalguild (Root, 1967), <strong>and</strong> trophospecies(Yodzis, 1988). Although each of these terms <strong>in</strong>some way def<strong>in</strong>es a species’ trophic role <strong>in</strong> anecosystem, each concept differs slightly, <strong>and</strong>none is completely satisfactory <strong>in</strong> captur<strong>in</strong>g thetotal feed<strong>in</strong>g relations of a species <strong>in</strong> a food web(Cous<strong>in</strong>s, 1985, 1987; Perrson et al., 1996). Here,we formally def<strong>in</strong>e the trophic role of a speciesus<strong>in</strong>g a concept drawn fromsocial role analysiscalled regular equivalence, <strong>and</strong> present examplesus<strong>in</strong>g this approach to measur<strong>in</strong>g similarity <strong>in</strong>the trophic role of species <strong>in</strong> food webs.Recently, some new approaches to the def<strong>in</strong>ition<strong>and</strong> measurement of the trophic role of aspecies <strong>in</strong> a food web have been proposed, <strong>in</strong>which both predator <strong>and</strong> prey relations areconsidered (Goldwasser & Roughgarden, 1993).Yodzis & W<strong>in</strong>emiller (1999) used Jaccard’s(1900) similarity coefficient to operationallydef<strong>in</strong>e trophospecies, first comput<strong>in</strong>g predatorrelations, then prey relations, <strong>and</strong> f<strong>in</strong>ally bothsets of relations at the same time. Given thematrix of species-by-species Jaccard similaritycoefficients, they used cluster<strong>in</strong>g algorithms toidentify classes of species of fishes <strong>in</strong> an aquaticfood web <strong>in</strong> a Venezuelan floodpla<strong>in</strong>. Theyconsidered two separate sets of a species’ l<strong>in</strong>ksto other species (us<strong>in</strong>g both topological <strong>and</strong>energy flow l<strong>in</strong>ks <strong>in</strong> separate analyses), firstcomput<strong>in</strong>g the similarity of predator l<strong>in</strong>ks, thencomput<strong>in</strong>g the similarity of prey l<strong>in</strong>ks, thenmultiply<strong>in</strong>g the similarity measures F what theycalled the multiplicative similarity. They alsoanalysed trophic similarity by ignor<strong>in</strong>g thedist<strong>in</strong>ction between predator <strong>and</strong> prey, simultaneouslycomput<strong>in</strong>g similarity <strong>in</strong> the dual roleeach species played as a consumer <strong>and</strong> a resourceF what they called the additive similarity. Theyconcluded that the additive similarity measureprovided the best measure of trophic similaritybased on predator <strong>and</strong> prey relations. TheYodzis–W<strong>in</strong>emiller approach is an importantadvance because it formalizes a fundamentalconcept (provid<strong>in</strong>g all the associated benefits ofprecision <strong>and</strong> measurability), <strong>and</strong> because it<strong>in</strong>corporates connections up <strong>and</strong> down the foodweb. However, it also reta<strong>in</strong>s an importantweakness <strong>in</strong> the classical conceptualization oftrophic role: it fails to detect the equivalence ofroles of species that do not share the samepredators <strong>and</strong> prey, but that may be similar <strong>in</strong>their trophic position.As an example, consider two species of <strong>in</strong>sectthat serve as prey for two different species ofcongeneric birds, <strong>and</strong> which consume verysimilar, congeneric species of plants. In theYodzis–W<strong>in</strong>emiller approach, these two <strong>in</strong>sectspecies would be placed <strong>in</strong> separate trophicgroups because they share no predators <strong>and</strong> noprey. Yet this measure misses the similarity at ahigher level of trophic organization: both specieshave a similar trophic position with<strong>in</strong> the foodweb. Both <strong>in</strong>sects are functional herbivores, <strong>and</strong>they are eaten by very similar species, but thereis no way for the Yodzis–W<strong>in</strong>emiller approachto detect that these two have any more <strong>in</strong>common than any r<strong>and</strong>om pair of species thatalso share no prey or predators. One solutionwould be to modify the Yodzis–W<strong>in</strong>emillerapproach to measure similarity not at the specieslevel but at a more aggregate level. For example,<strong>in</strong> comput<strong>in</strong>g the shared prey coefficient for each<strong>in</strong>sect species, we could hypothetically count nothow many species they have <strong>in</strong> common, buthow many genera they eat <strong>in</strong> common. Similarly,<strong>in</strong> comput<strong>in</strong>g the shared predator coefficient, wecould count the number of shared bird generathey have <strong>in</strong> common. The obvious problem withthis is that we do not know that the genus is theright level of aggregation, nor do we have anybasis for choos<strong>in</strong>g phylogenetic affiliation as thebasis for group<strong>in</strong>g. However, the general ideais right: to evaluate the trophic similarity of twospecies, we want to know whether they havesimilar trophic ties to the same types of species,but not necessarily the same species. Thequestion is how to def<strong>in</strong>e these types. Ideally,we would use trophospecies F groups of speciesthat are trophically equivalent. But this wouldseemto require know<strong>in</strong>g the answer <strong>in</strong> order to
DEFINITION OF TROPHIC ROLE SIMILARITY 305construct the answer. We are try<strong>in</strong>g to groupspecies <strong>in</strong>to trophically equivalent sets, yet to dothis for any given pair of species, we would liketo know which trophic equivalence set all of theother species belong to, which is circular.Surpris<strong>in</strong>gly, there is a solution, which isrecursive <strong>in</strong> nature; <strong>and</strong>, it is drawn fromthesocial sciences, where the concept of social roleof <strong>in</strong>dividuals with<strong>in</strong> social systems has beenextensively analysed.The social sciences have paid much attentionto the importance of structure <strong>and</strong> position <strong>in</strong>the study of social roles. Social scientists havedevoted a considerable amount of effort toformaliz<strong>in</strong>g the notion of role <strong>in</strong> the contextof a systemof social relations (Nadel, 1957;Merton, 1959; Homans, 1961; Goodenough,1969; Mayhew, 1980). For example, <strong>in</strong> thesystemof social relations <strong>in</strong> a hospital, whatdef<strong>in</strong>es a person as play<strong>in</strong>g the role of doctor isthe characteristic set of relations they have withpersons who are play<strong>in</strong>g related roles such aspatients, nurses, medical record keepers, pharmaceuticalsales people <strong>and</strong> receptionists. Earlysocial network research modeled k<strong>in</strong>ship systemsus<strong>in</strong>g algebraic approaches (White, 1963; Boyd,1969), followed by Lorra<strong>in</strong> & White’s (1971)‘‘structural equivalence’’ concept that formallydef<strong>in</strong>ed roles <strong>and</strong> reduced the complexity of anetwork of relations to a set of simplified rolestructures. In this structural equivalence model,two <strong>in</strong>dividuals are seen as occupy<strong>in</strong>g the sameposition to the extent they have the same k<strong>in</strong>dsof social ties to the same third parties. This work<strong>in</strong> turn paved the way for the development of amore general concept known as regular equivalence(White & Reitz, 1983), <strong>in</strong> which two<strong>in</strong>dividuals are seen as play<strong>in</strong>g the same role tothe extent they have similar ties to analogous<strong>in</strong>dividuals (i.e. those play<strong>in</strong>g correspond<strong>in</strong>groles). Differences between structural <strong>and</strong> regularequivalence approaches were discussed byBorgatti & Everett (1989), Everett & Borgatti(1991) <strong>and</strong> Everett & Borgatti (1994).As an extension of Elton’s (1927) ‘‘role <strong>in</strong>relation to food <strong>and</strong> enemies’’ paradigm, we willnow apply the theory of social role analysis <strong>and</strong>the concept of regular equivalence to ecologicalfood webs <strong>and</strong> formalize the measurements oftrophic role similarity <strong>in</strong> detail. We will apply theregular equivalence approach to the analysis oftrophic role structure <strong>in</strong> two food webs, one ab<strong>in</strong>ary or topological network <strong>and</strong> the othera carbon-flow network. We will also compareperformance of the regular equivalence approachwith the structural method proposedrecently (Yodzis & W<strong>in</strong>emiller, 1999) <strong>in</strong> creat<strong>in</strong>gtrophic aggregations. F<strong>in</strong>ally, we will present animage graph of each food web, based on theregular equivalence approach, which provides areduced-complexity view of the entire food web.2. Theory of <strong>Role</strong> Analysis2.1. GRAPH-THEORETIC TERMINOLOGYWe represent community food web data asa directed graph, or digraph, G(V,E), whichconsists of a set of nodes V (also known asvertices) represent<strong>in</strong>g species or compartments,<strong>and</strong> a set of directed ties (also known as edges orarcs) E which represent predation, parasitismorany other trophic relationship. The notation(a,b) A E <strong>in</strong>dicates the presence of a tie from a tob. Similarly, (b,a) A E, <strong>in</strong>dicates a tie from b to a.Optionally, we can also def<strong>in</strong>e a real-valuedfunction F on E which assigns a value (such as aquantity of flow) to each tie, so that f (u,v)¼ 0.27 would <strong>in</strong>dicate a flow of 0.27 units fromu to v. For simplicity of exposition, we shallusually assume here that ties are simply presentor absent rather than valued. However, themathematics generalizes straightforwardly tovalued data, <strong>and</strong> we will use valued energy flowdata <strong>in</strong> our empirical examples.The set of nodes adjacent to a given node v iscalled the neighborhood of v <strong>and</strong> denoted N(v).In a directed graph, a node’s neighborhoodconsists of two parts: an out-neighborhood,def<strong>in</strong>ed as the set N o (v) ¼ { p| (v, p) A E}, <strong>and</strong>an <strong>in</strong>-neighborhood, def<strong>in</strong>ed as the set N i (v) ¼{q|(q,v) A E}. In the case of food web predationdata, the out-neighborhood N o (u) is the set ofspecies that are predators of species u, <strong>and</strong> the<strong>in</strong>-neighborhood N i (u) is the set of species thatare prey of species u.An equivalence relation def<strong>in</strong>ed on a set ofnodes is a b<strong>in</strong>ary relation that is reflexive,symmetric <strong>and</strong> transitive. An example of anequivalence relation is the relation R <strong>in</strong>duced bya partition of nodes <strong>in</strong>to mutually exclusive
306J. J. LUCZKOVICH ET AL.classes so that two nodes are related by R if <strong>and</strong>only if they belong to the same class. Thenotation (u,v) A R is used to <strong>in</strong>dicate that node uis equivalent (i.e. <strong>in</strong> the same class as) to node v.Alternatively, we can write u v to <strong>in</strong>dicate theequivalence of the two nodes. The equivalenceclass of a node u is denoted C(u). Below, wedef<strong>in</strong>e two particular equivalence relations:structural equivalence, <strong>in</strong> which nodes areequivalent if they are connected to the sameother nodes; <strong>and</strong> regular colorations, <strong>in</strong> whichequivalent nodes are connected to equivalent(but not necessarily the same) nodes.2.2. STRUCTURAL EQUIVALENCEAn equivalence relation R is called structural(Lorra<strong>in</strong> & White, 1971; Everett & Borgatti,1991) if, for all nodes u <strong>and</strong> v, (u,v) A R if <strong>and</strong>only if N o (u) ¼ N o (v) <strong>and</strong> N i (u) ¼ N i (v). Inother words, a structural equivalence F alsoknown as a structural coloration (Everett &Borgatti, 1991) F equates nodes that have<strong>in</strong>com<strong>in</strong>g <strong>and</strong> outgo<strong>in</strong>g ties to exactly the sameothers. Figure 1(a) illustrates a structuralequivalence by pa<strong>in</strong>t<strong>in</strong>g equivalent nodes thesame color. In contrast, the equivalence depicted<strong>in</strong> Fig. 1(b) is not structural because nodes 5 <strong>and</strong>6 are colored the same, yet node 9 has anoutgo<strong>in</strong>g tie to node 5, <strong>and</strong> node 6 does not. Inaddition, node 5 has an outgo<strong>in</strong>g tie to node 4,<strong>and</strong> node 6 does not. In structural equivalence,nodes 5 <strong>and</strong> 6 could not be equivalent. Forvalued data, such as energy flows, we wouldrequire that fully equivalent nodes have equallyvalued ties to the same others.As def<strong>in</strong>ed above, structural equivalence is anidealized mathematical concept <strong>in</strong> which nodesare either equivalent or they are not. When us<strong>in</strong>gthe concept to analyse empirical data, we usestructural equivalence algorithms (Borgatti et al.,1999) that measure the extent of structuralequivalence between every pair of nodes. Whenthe appropriate measure of pattern similarityis chosen (such as the Jaccard coefficient), thelatter approach is almost identical to recentapproaches used by ecologists for identify<strong>in</strong>gtrophospecies (Yodzis & W<strong>in</strong>emiller, 1999).Fig. 1. (a) A structural coloration (left), (b) a nonstructuralcoloration (right), (c) a regular coloration, (d) anon-regular coloration, (e) disconnected graphs represent<strong>in</strong>gdifferent webs. Color codes: solid circles, black; opencircles, white; angled hatch<strong>in</strong>g, green; vertical hatch<strong>in</strong>g, red;cross hatch<strong>in</strong>g, blue; stipled, yellow.2.3. REGULAR EQUIVALENCEStructural equivalences are members of afamily of equivalence relations called regularequivalences or regular colorations (White &Reitz, 1983; Borgatti & Everett, 1989; Everett &Borgatti, 1991). An equivalence relation R of adigraph G(V,E) is regular if, for all nodes u, v AV, u v implies that if there exists a tie (u,y) A E,then there exists a node z such that (v,z) A E <strong>and</strong>y z, <strong>and</strong> if there is a tie (p,u) A E, then thereexists a node q such that (q,v) A E <strong>and</strong> p q. Inother words, <strong>in</strong> a regular equivalence, if nodes u<strong>and</strong> v are equivalent, then if one has a tie to athird party, then the other one has a correspond<strong>in</strong>gtie to an equivalent third party (but notnecessarily the same one). Applied to food webs,this means that regularly equivalent species preyon equivalent species <strong>and</strong> are preyed upon byequivalent species. It should be noted that a
DEFINITION OF TROPHIC ROLE SIMILARITY 307graph may have more than one regular equivalence.S<strong>in</strong>ce our goal is usually to seek thesimplest model, our discussion will center onthe maximal non-trivial regular equivalence (i.e.the one with the fewest equivalence classes).Consequently, when we write ‘‘regular equivalence’’it is understood that this means the maximalregular equivalence unless otherwise stated.An example of a regular equivalence is shown<strong>in</strong> Fig. 1(c), aga<strong>in</strong> us<strong>in</strong>g same color <strong>and</strong> fill to<strong>in</strong>dicate equivalence. To determ<strong>in</strong>e whether itis regular, we check each pair of nodes that iscolored the same aga<strong>in</strong>st the def<strong>in</strong>ition. Forexample, nodes 2 <strong>and</strong> 3 are colored the same,<strong>in</strong>dicat<strong>in</strong>g they are equivalent. Accord<strong>in</strong>g to thedef<strong>in</strong>ition, their out-neighborhoods (<strong>and</strong> their <strong>in</strong>neighborhoods)must conta<strong>in</strong> equivalent nodes(i.e. the same colors). Node 2 has <strong>in</strong>com<strong>in</strong>g tiesfromcross-hatched nodes <strong>and</strong> vertical-l<strong>in</strong>ednodes <strong>and</strong> no other colors. Node 3 is the same.Node 2 has outgo<strong>in</strong>g ties to stippled nodes <strong>and</strong>cross-hatched nodes. Node 3 is aga<strong>in</strong> the same(recall that the def<strong>in</strong>ition says noth<strong>in</strong>g about thenumber of nodes of each type that a node maybe connected to). Hence this pair satisfies thedef<strong>in</strong>ition. If all pairs do, the equivalence isregular. In contrast, Fig. 1(d) gives an exampleof a non-regular equivalence. One reason it isnot regular is that node 4 is colored the same asnode 2, yet node 4 has no tie to a vertical-l<strong>in</strong>ednode, while node 2 does.It is useful to note three desirable features ofregular equivalence. The first is that cycles, suchas the one connect<strong>in</strong>g nodes 2, 3 <strong>and</strong> 11 <strong>in</strong>Fig. 1(c), pose no difficulty. The second is thatomnivory also provides no particular problem,as nodes 10 <strong>and</strong> 1 feed at the same two levels ofthe food cha<strong>in</strong> (<strong>and</strong> are equivalent) whereasnodes 4 <strong>and</strong> 2 feed at different levels (<strong>and</strong> are notequivalent). The third is that two species can beregularly equivalent without hav<strong>in</strong>g any prey orpredators <strong>in</strong> common, as is the case with nodes 5<strong>and</strong> 6. Thus, regular equivalence captures theidea that species can occupy analogous positions<strong>in</strong> the food web, without the limitation found <strong>in</strong>the Yodzis–W<strong>in</strong>emiller approach that requiresspecies assigned to the same class to <strong>in</strong>teracttrophically with the very same species. Animplication of the last feature is that regularequivalence can be used to class together speciesthat are members of different food webs, yetoccupy analogous positions. An example is given<strong>in</strong> Fig. 1(e) <strong>in</strong> which nodes 12 <strong>and</strong> 2 are regularlyequivalent, yet obviously belong to separatewebs. In this way, regular equivalence may beused to improve upon the practice of compar<strong>in</strong>gwebs by count<strong>in</strong>g numbers of species by basal-,<strong>in</strong>termediate- <strong>and</strong> top-level species (Cohen &Newman, 1985).2.4. IMAGE GRAPHSThe image graph <strong>in</strong>duced by an equivalencerelation R on G is def<strong>in</strong>ed as the digraphG 0 (C(V),E 0 ) <strong>in</strong> which the nodes are the equivalenceclasses of R, <strong>and</strong> two nodes (i.e. classes) x<strong>and</strong> y are adjacent <strong>in</strong> G 0 if there exist adjacentnodes u <strong>and</strong> v <strong>in</strong> G such that C(u) ¼ x <strong>and</strong> C(v)¼ y [recall that C(u) denotes the equivalenceclass of node u]. In this sense, an equivalencerelation <strong>in</strong>duces a mapp<strong>in</strong>g, known as a graphhomomorphism, from the orig<strong>in</strong>al network to areduced model of the network. Figure 2(a) showsthe image graph for the structural equivalence <strong>in</strong>Fig. 1(a). It should be noted that <strong>in</strong> a structuralequivalence, the image graph is a completedescription of the entire systemof relations,Fig. 2. (a) Image graph for the structural coloration <strong>in</strong>Fig. 1(a); (b) image graph for the regular coloration <strong>in</strong>Fig. 1(c); (c) a graph of a hypothetical food web show<strong>in</strong>gthe regular equivalence of feed<strong>in</strong>g relations. Directed tiesare depicted by arrows that show the predator’s consumptionof a prey. Color codes are the same as <strong>in</strong> Fig. 1.
308J. J. LUCZKOVICH ET AL.without loss of relational <strong>in</strong>formation. If twocolors blue <strong>and</strong> red are mutually connected <strong>in</strong>the image graph, then, <strong>in</strong> the orig<strong>in</strong>al graph,every blue node has a connection to every rednode, <strong>and</strong> every red node has an <strong>in</strong>com<strong>in</strong>g tiefromevery blue node.The image graph of a regular equivalence alsoprovides a reduced model of the network(s) as awhole. Unlike structural equivalence, however,with regular equivalence there is some loss ofrelational <strong>in</strong>formation, although the extent <strong>and</strong>type of loss are strictly controlled. Figure 2(b)gives the image graph associated with the regularequivalence <strong>in</strong> Fig. 1(e). Given the rules of aregular equivalence, we are guaranteed that if, <strong>in</strong>the image graph, there is a tie from a verticall<strong>in</strong>ednode to a cross-hatched node, then <strong>in</strong> theorig<strong>in</strong>al graph, every cross-hatched node has an<strong>in</strong>com<strong>in</strong>g tie from at least one vertical-l<strong>in</strong>ednode, <strong>and</strong> every vertical-l<strong>in</strong>ed node has anoutgo<strong>in</strong>g tie to at least one cross-hatched node.Thus, the image graph from a regular equivalenceprovides a simplified graph of the patternof connections among <strong>in</strong>dividual species; it is adiscipl<strong>in</strong>ed way of represent<strong>in</strong>g complex foodweb structure <strong>in</strong> which some detailed <strong>in</strong>formationis lost, but the fundamental pattern orstructure of ties is preserved.A look at Fig. 2(c) suggests that <strong>in</strong> addition tocaptur<strong>in</strong>g the notion of species trophic role,regular equivalence has some relationship to thenotion of trophic position. Node 3, which iscross-hatched, is two l<strong>in</strong>ks above a primaryproducer, <strong>and</strong> one l<strong>in</strong>k below a top predator. Allthe other cross-hatched nodes are positioned thesame. Note that nodes 7 <strong>and</strong> 8 are very much likethe cross-hatched nodes: they have an outgo<strong>in</strong>gtie to the top predator, <strong>and</strong> an <strong>in</strong>com<strong>in</strong>g tie froma vertical-l<strong>in</strong>ed prey. But unlike the crosshatchednodes, they also have a tie directly tothe primary producers (white nodes), i.e. they areclassic omnivores. As a result, they are placed <strong>in</strong>a different class, which corresponds to a differenttrophic position. Similarly, node 6, which also isprey for the top predators, is <strong>in</strong> a different classfromthe vertical-l<strong>in</strong>ed nodes, the cross-hatchednodes <strong>and</strong> the gray nodes because it feedsdirectly <strong>and</strong> exclusively on a primary producer.Note that this means that node 11, the primaryproducer connected to node 6, cannot be <strong>in</strong> thesame class as the other producers 12 <strong>and</strong> 13. Inthis sense, regular equivalence makes f<strong>in</strong>erdist<strong>in</strong>ctions than do most other measures oftrophic position, because the producers will begrouped <strong>in</strong>to separate classes with differ<strong>in</strong>grelations to the herbivore <strong>and</strong> omnivore classes.Consequently, we can th<strong>in</strong>k of regular equivalenceas def<strong>in</strong><strong>in</strong>g classes of isotrophic species,rather than trophic levels of species.The relationship between regular equivalence<strong>and</strong> trophic position is clearest when the foodweb conta<strong>in</strong>s no cycles. In such webs, two speciesthat are colored the same are equally distantfromcorrespond<strong>in</strong>g top predators <strong>and</strong> producers.For example, if a b, then if a is positionedtwo l<strong>in</strong>ks above a given producer species c, thenb is also two l<strong>in</strong>ks above either c or some otherproducer d that is regularly equivalent to c.Thus, under such circumstances, nodes <strong>in</strong> thesame class are necessarily at the same trophicposition. In food webs with cycles, the correspondencenoted above can break down. However,there is a simple solution. In graph theory,the length of the shortest path between twonodes is known as the geodesic distance betweenthem. By calculat<strong>in</strong>g the geodesic distancebetween all pairs of nodes, we can construct anode-by-node geodesic distance matrix. Apply<strong>in</strong>gregular equivalence to this matrix <strong>in</strong>stead ofthe raw adjacency matrix generates a regularequivalence that necessarily preserves trophiclevels, as two nodes that are colored the samewill be the same geodesic distance from equivalentothers. This approach can also be applied toflow data by apply<strong>in</strong>g regular equivalencesimultaneously to both the flow matrix <strong>and</strong> thegeodesic distance matrix, but the details of thistechnique are beyond the scope of this paper.While regular equivalence classes are homogeneouswith respect to trophic position, asexpla<strong>in</strong>ed above, they produce classes that differfromthe group<strong>in</strong>gs that result us<strong>in</strong>g the classicdef<strong>in</strong>ition of trophic level. One reason is thattrophic-level concept considers only distancefromthe producers, <strong>and</strong> does not <strong>in</strong>clude bothdownward <strong>and</strong> upward trophic paths. Forexample, if two nodes a <strong>and</strong> b are both twol<strong>in</strong>ks above the producer, then they are notalways regularly equivalent, because they maydiffer <strong>in</strong> the number of predator l<strong>in</strong>ks above
DEFINITION OF TROPHIC ROLE SIMILARITY 309them<strong>in</strong> the web. In addition, some approaches,such as Adams et al. (1983), are sensitive to therelative number of prey at different levels, whichis not the case with regular equivalence <strong>in</strong>general, although it is true of a subset of regularcolorations known as exact regular colorations(Everett & Borgatti, 1996). For example, <strong>in</strong>Fig. 2(c), nodes 1 <strong>and</strong> 2 are placed at the samelevel by a regular coloration, even though node 1preys on two cross-hatched species while node 2preys on only one.A dist<strong>in</strong>ctive feature of the def<strong>in</strong>ition ofregular equivalence is its recursive or implicitquality. That is, to determ<strong>in</strong>e whether two nodesare equivalent, one needs to know the colors ofall the other nodes, but to determ<strong>in</strong>e their colorsone needs to know the colors of all nodes<strong>in</strong>clud<strong>in</strong>g the two nodes one started with, <strong>and</strong> soon. This may appear to be computationally<strong>in</strong>tractable, but <strong>in</strong> fact is not. There are severalefficient algorithms available for regular equivalence(Borgatti et al., 1999), which vary <strong>in</strong> thetype of output they produce (e.g. pairwisecoefficients giv<strong>in</strong>g the degree of equivalence vs.approximate discrete classes), type of data theycan h<strong>and</strong>le (e.g. valued or b<strong>in</strong>ary), <strong>and</strong> othervariables.that are attracted to a Malaysian pitcher plant<strong>and</strong> become drowned or are preyed upon byother <strong>in</strong>sects that live <strong>in</strong> the plant. In a sense, it ismerely a sub-web of a larger food web, becausethe <strong>in</strong>sects are consum<strong>in</strong>g energy elsewhere <strong>and</strong>br<strong>in</strong>g<strong>in</strong>g it to the pitcher plant. Thus, the role of‘‘producers’’ is filled by the drowned <strong>in</strong>sects <strong>and</strong>live <strong>in</strong>sects (ants) that visit the pitcher plant,which are really consumers <strong>in</strong> a larger food web.In the orig<strong>in</strong>al presentation (Beaver, 1985), sometaxa were grouped <strong>in</strong>to ‘‘trophic types’’, which <strong>in</strong>fact were structurally equivalent, because theyhad the exact same l<strong>in</strong>ks to other taxa <strong>in</strong> thefood web. Stil<strong>in</strong>g (2002) disaggregated thesetaxa, <strong>and</strong> we did as well, so as to start with acompletely disaggregated food web at the specieslevel (Fig. 3).3.3. ST. MARKS, FLORIDA SEAGRASS CARBONFLOW WEBThe food web data were obta<strong>in</strong>ed fromdirectsampl<strong>in</strong>g <strong>and</strong> literature surveys of the St. Marksseagrass ecosystem(Baird et al., 1998; Christian& Luczkovich, 1999, Luczkovich et al., <strong>in</strong> press).3. Methods3.1. EMPIRICAL APPLICATIONSIn the last section we laid out the mathematical<strong>and</strong> computational underp<strong>in</strong>n<strong>in</strong>gs of the regularequivalence model. Now we illustrate the empiricalapplication of these concepts us<strong>in</strong>g twoempirical food web datasets, namely the Malaysianpitcher plant <strong>in</strong>sect web (Beaver, 1985) asreproduced <strong>and</strong> discussed <strong>in</strong> Stil<strong>in</strong>g (2002), <strong>and</strong>the St. Marks, Florida seagrass food web (Bairdet al., 1998; Christian & Luczkovich, 1999;Luczkovich et al., <strong>in</strong> press). The <strong>in</strong>sect datasetis a topological web consist<strong>in</strong>g of predation l<strong>in</strong>ks,while the St. Marks, Florida seagrass ecosystemis a dynamic web, with data consist<strong>in</strong>g ofestimated carbon flows between compartments.3.2. MALAYSIAN PITCHER PLANT WEBThis is one of several food webs that have beendescribed by Beaver (1985), <strong>in</strong>volv<strong>in</strong>g <strong>in</strong>sectsFig. 3. A simple food web diagram of the <strong>in</strong>sects <strong>in</strong> thepitcher plant Nepenthes albomarg<strong>in</strong>ata <strong>in</strong> West Malaysia[modified from the diagram presented by Stil<strong>in</strong>g (2001),based on org<strong>in</strong>al data fromBeaver, 1985]. Appendix A liststhe species’ numerical codes for each node. Predators arepositioned higher than their prey, <strong>and</strong> l<strong>in</strong>es representtrophic l<strong>in</strong>kages.
310J. J. LUCZKOVICH ET AL.In order to obta<strong>in</strong> a species list for the food web,collections of producers <strong>and</strong> various consumerswere conducted along the study area transects(for more detailed methods see Baird et al., 1998;Christian & Luczkovich, 1999; Luczkovich et al.<strong>in</strong> press). In order to determ<strong>in</strong>e the structure ofthe diet matrix required for the network foodweb model, diet data were summarized based onthe exist<strong>in</strong>g literature on seagrass <strong>in</strong>vertebrates<strong>and</strong> birds, <strong>and</strong> stomachs were exam<strong>in</strong>ed directlyfor fishes <strong>in</strong> the study areas. A 51-compartmentdiet matrix for this study was prepared as acarbon-flow matrix taken directly from thenetwork model based on the approach describedby Ulanowicz (1986).3.4. STATISTICAL ANALYSISTo analyse the data, we used the REGEalgorithm implemented <strong>in</strong> the UCINET 5.8network analysis software package (Borgattiet al., 1999). The algorithmtakes any real-valuedN N (species-by-species) matrix X as <strong>in</strong>put,<strong>and</strong> returns a species-by-species matrix R ofcoefficients (rang<strong>in</strong>g from0 to 1) which records,for each pair of species, the extent of (maximal)regular equivalence. The essence of the algorithmisas follows:(0) Set r ij ¼ 1 for all i <strong>and</strong> j (i.e. let all speciesbe 100% equivalent to start).(1) For each species i <strong>and</strong> j,(1A) For each species k eaten by i, f<strong>in</strong>d speciesm eaten by j that is most equivalent to k <strong>and</strong>which is eaten <strong>in</strong> the most similar proportion ask is eaten by i, <strong>in</strong> other words which maximizesthe quantity z k ¼ r km M<strong>in</strong>(x ik ,x jm )/Max(x ik ,x jm ).(1B) For each k which eats i, f<strong>in</strong>d species mthat eats j that is most equivalent to k <strong>and</strong> whicheats j <strong>in</strong> the most similar proportion as k eats i,<strong>in</strong> other words which maximizes the quantityy k ¼ r km M<strong>in</strong>(x ki ,x mj )/Max(x ki ,x mj ).(1C) Set r ij <strong>and</strong> r ji ¼ S z k +S y k .(2) Repeat Step 1 until no more changes <strong>in</strong> r ijor maximum iterations exceeded. The maximumiterations ¼ N species or compartments.The result<strong>in</strong>g coefficients r ij have ord<strong>in</strong>alproperties. Details of the algorithmare discussed<strong>in</strong> Borgatti & Everett (1993). For comparison,we also calculate the additive similarity measureof Yodzis & W<strong>in</strong>emiller (1999) for the Malaysianpitcher plant <strong>in</strong>sect food web, which is Jaccard’ssimilarity measure applied to all trophic l<strong>in</strong>ks,whether predator or prey of a species. Tovisualize patterns of similarities emerg<strong>in</strong>g fromboth the REGE procedure <strong>and</strong> the Yodzis–W<strong>in</strong>emiller procedure, the similarity matriceswere submitted to a non-metric multi-dimensionalscal<strong>in</strong>g (MDS) procedure <strong>in</strong> order torepresent similarities as distances <strong>in</strong> two-dimensionalspace (UCINET 5, Borgatti et al., 1999).The coord<strong>in</strong>ates fromthe MDS procedure werethen used as <strong>in</strong>put to the Pajek (Batagelj &Mrvar, 1999) network draw<strong>in</strong>g software.In addition, <strong>in</strong> order to simplify <strong>in</strong>terpretationof the results, a hierarchical cluster<strong>in</strong>g of theoutput matrix R fromthe REGE algorithmwasalso performed, yield<strong>in</strong>g a dendrogram <strong>and</strong> setof nested partitions. Because it is appropriate forord<strong>in</strong>al data, we used Johnson’s hierarchicalcluster<strong>in</strong>g (Johnson, 1967). For display purposes,one partition with<strong>in</strong> the hierarchicalcluster<strong>in</strong>g was selected to classify compartments.By def<strong>in</strong>ition, all partitions with<strong>in</strong> a Johnson’shierarchical cluster<strong>in</strong>g are equally valid, represent<strong>in</strong>gdifferent levels of resolution rather thanalternative theories (Borgatti et al., 1990). Theparticular choice of partition was based on aseries of regressions designed to measure clusteradequacy. S<strong>in</strong>ce an ideal cluster<strong>in</strong>g of theR matrix would locate the largest values of Rwith<strong>in</strong> clusters <strong>and</strong> the smallest values of Rbetween clusters, we can measure the extent towhich a given cluster<strong>in</strong>g is optimal via ananalysis of variance <strong>in</strong> which the cases are pairsof nodes, the dependent variable is the REGEcoefficient for each pair, <strong>and</strong> the <strong>in</strong>dependentvariable is a dummy variable coded 1 if the pairare <strong>in</strong> the same cluster <strong>and</strong> 0 if they are <strong>in</strong>different clusters. The result<strong>in</strong>g R 2 (or eta-squareas it is called <strong>in</strong> the ANOVA context) can be<strong>in</strong>terpreted as a measure of cluster adequacy. Byplott<strong>in</strong>g R 2 aga<strong>in</strong>st the number of clusters, weobta<strong>in</strong> a scree plot, which can be exam<strong>in</strong>ed for<strong>in</strong>flection po<strong>in</strong>ts. A cluster<strong>in</strong>g with k classes ischosen if it provides a sizeable <strong>in</strong>crease <strong>in</strong> R 2over the next simplest cluster<strong>in</strong>g (i.e. with k 1clusters), yet expla<strong>in</strong>s nearly as much varianceas the next most complicated cluster<strong>in</strong>g (k+1
DEFINITION OF TROPHIC ROLE SIMILARITY 311clusters). Of course, the researcher is free tochoose a cluster solution with higher resolutionif the R 2 is not substantially different.4. Results4.1. MALAYSIAN PITCHER PLANT INSECT FOOD WEBThe 19 taxa <strong>in</strong> the topological food web(Fig. 3) collected by Beaver (1985) <strong>and</strong> discussed<strong>in</strong> Stil<strong>in</strong>g (2002) were analysed via the REGEalgorithm, generat<strong>in</strong>g the matrix of coefficients(available upon request fromthe authors <strong>and</strong>published on-l<strong>in</strong>e at http://drjoe.biology.ecu.edu/regefoodweb). Appendix A lists the names<strong>and</strong> numerical identification codes for thecompartments <strong>in</strong> Beaver (1985) that are discussedhere. It is clear that the REGE algorithmdoes a very good job of detect<strong>in</strong>g isotrophicspecies <strong>in</strong> the Malaysian pitcher plant <strong>in</strong>sect foodweb. Based on the <strong>in</strong>crease <strong>in</strong> R 2 of theregression analysis at four clusters <strong>and</strong> the rapiddrop after five clusters, as can be seen <strong>in</strong> thecluster adequacy scree diagram(Fig. 4), weidentified five isotrophic classes (with ones<strong>in</strong>gleton class), which are identified by colors<strong>in</strong> the cluster dendrogram(Fig. 5).Figure 6(a) shows a two-dimensional multidimensionalscal<strong>in</strong>g (MDS) of the REGE coefficientsfor this web, with the color classes fromthe cluster analysis used to code the classes. ThisMDS displays the food web structure <strong>and</strong>relative position <strong>in</strong> the network of the basal,<strong>in</strong>termediate <strong>and</strong> top consumers. One group ofbasal species (brown) <strong>in</strong>cluded the drowned<strong>in</strong>sects (18) <strong>and</strong> organic debris (19). Anotherbasal group (s<strong>in</strong>gleton class) <strong>in</strong>cludes the live<strong>in</strong>sects (white) (17). Both basal groups have no<strong>in</strong>com<strong>in</strong>g ties F they function as the energysource or ‘‘producers’’ <strong>in</strong> this food web. TheREGE algorithmseparates basal species <strong>in</strong>totwo classes (brown <strong>and</strong> white), based on therelations of those nodes to the various colorclasses of their consumers: whereas brown classmembers are preyed upon by members of thegreen <strong>and</strong> red classes, the white class membersare only preyed upon by members of the yellowclass. The <strong>in</strong>termediate group (green) <strong>in</strong>cludesthe bacteria <strong>and</strong> protozoa (16), aquatic larvaeof dipteran <strong>in</strong>sects [Megaselia sp. (5), Endonepenthiaschuitemakeri (6), Triperoides tenax (7),Triperoides bambusa (8), Dasychelea nepenthicola(9), Culex curtipalpis (12), Culex lucaris (13) <strong>and</strong>Lestodiplosis sp. (4)]. These <strong>in</strong>termediate aquatic<strong>in</strong>sect larvae (green) are positioned midway fromtop to bottom<strong>in</strong> the MDS plot, which <strong>in</strong>dicatesthat they occupy a position midway betweenfood sources <strong>and</strong> s<strong>in</strong>ks. There were two topredyellowgreenbrownwhite111014152314131287956161819171.0 0.9 0.8 0.7REGE CoefficientFig. 4. A screen plot of the R 2 as it varies with numberof clusters fromthe average l<strong>in</strong>kage cluster analysis us<strong>in</strong>gthe REGE coefficients derived fromthe Malaysian pitcherplant <strong>in</strong>sect food web.Fig. 5. A s<strong>in</strong>gle-l<strong>in</strong>kage cluster analysis dendrogramofthe Malaysian pitcher plant <strong>in</strong>sect food web us<strong>in</strong>g theREGE coefficient matrix as a similarity measure (Taxacodes listed <strong>in</strong> Appendix A). Colors were used to <strong>in</strong>dentifyclass membership based on the R 2 regression analysis(see text).
312J. J. LUCZKOVICH ET AL.consumer groups: the red group <strong>in</strong>cludedscaveng<strong>in</strong>g dipterans Nepenthosyrphus sp. (10),Pierretia urceola (11), <strong>and</strong> two species ofAnotidae (14 <strong>and</strong> 15); whereas the predatory<strong>in</strong>sects Misumenops nepenthicola (1), encyrtids(Trach<strong>in</strong>aephagus) (2) <strong>and</strong> Toxorhynchies klossi(3) comprised the yellow group. Both the yellow<strong>and</strong> red groups are s<strong>in</strong>ks for energy <strong>in</strong> this web(they have no outgo<strong>in</strong>g ties).Five pairs of species were exactly regularlyequivalent, with coefficients of 1.0 (5 <strong>and</strong> 6; 7<strong>and</strong> 8; 10 <strong>and</strong> 11; 12 <strong>and</strong> 13; <strong>and</strong> 14 <strong>and</strong> 15).These nodes are shown as slightly displaced fromone another <strong>in</strong> Fig. 6(a) to prevent themfromcompletely obscur<strong>in</strong>g one another. These pairsof nodes have the same ties to the same classesof species, but not necessarily the same species. Inthis example, each pair is tied to the exact samespecies, consider<strong>in</strong>g both predators <strong>and</strong> prey, sothey are both regularly <strong>and</strong> structurally equivalent.The complexity of the feed<strong>in</strong>g relations <strong>in</strong> thisfood web network at the level of species can nowbe simplified from the orig<strong>in</strong>al 19 nodes <strong>in</strong>to fivecolor classes. After pool<strong>in</strong>g nodes <strong>in</strong> the samecolor class <strong>in</strong>to a s<strong>in</strong>gle node <strong>and</strong> redisplay<strong>in</strong>gthe network of these pooled nodes, we createda regular-equivalence image graph. The imagegraph of the pitcher plant food web shows thenetwork structure <strong>in</strong> simplified form [Fig. 6(b)].For comparative purposes, we also haveanalysed the same food web data us<strong>in</strong>g Yodzis& W<strong>in</strong>emiller’s (1999) preferred similarity measure,the additive trophic similarity measure,which is a measure of structural equivalence(Fig. 7 F similarity data available from theauthors or at http://drjoe.biology.ecu.edu/regefoodweb).The two types of similarity measures,structural (additive similarities) <strong>and</strong> the regular(REGE coefficients) equivalence, produced twovery different views of similarities among thespecies (compare Figs 5 <strong>and</strong> 7). Whereas thehierarchical cluster<strong>in</strong>g based on REGE coefficientsgrouped the basal producers <strong>in</strong>to the sameclass (drowned <strong>in</strong>sects 18, organic debris 19) atan early step, <strong>in</strong> the additive similarity cluster<strong>in</strong>gthey are not jo<strong>in</strong>ed until the next to the lastagglomeration step (Fig. 7). Accord<strong>in</strong>g to theadditive similarity measure, the node for organicdebris (19) is more similar to the top predatorM. nepenthicola (1) than it is to drowned <strong>in</strong>sects(18). The additive similarity measure produces anon-<strong>in</strong>tuitive group<strong>in</strong>g of nodes <strong>in</strong> the food web.We can visualize the structural equivalence ofthe network if we compute the MDS coord<strong>in</strong>ates<strong>in</strong> two dimensions us<strong>in</strong>g the additive similaritymeasure <strong>and</strong> display these with the networktrophic l<strong>in</strong>ks [Fig. 6(c)], as we did above with theREGE coefficients [refer to Fig. 6(a) for comparison].The food web depicted with nodespositioned accord<strong>in</strong>g to the MDS coord<strong>in</strong>atesobta<strong>in</strong>ed from the additive similarity measuredoes not describe the flow of energy or materialsfromsources to s<strong>in</strong>ks, as it did when REGEcoefficients were used. Indeed, the basal nodes(17–19) are not particularly close to one another,<strong>and</strong> they cannot be arranged <strong>in</strong> such a way thatthey all lie near one end of the graph. The toppredators nodes (1–3) are close to one another<strong>and</strong> on one side of the plot, but are also <strong>in</strong> closeproximity to one of the basal nodes (18). This isa characteristic of the additive measure, whichignores the direction of the ties. In fact, thearrows represent<strong>in</strong>g energy flow among nodes <strong>in</strong>Fig. 6(c) do not all po<strong>in</strong>t <strong>in</strong> the same generaldirection, rather they cross back over oneanother, so there is no approximation of trophicposition that can be uncovered <strong>in</strong> their arrangementby MDS. A few pairs of nodes appear togroup together: these are species with identicalyellowmagentagreenredblue111017568712139141519163142181.0 0.9 0.8 0.7 0.6 0.5 0.4 0.3 0.2Additive <strong>Similarity</strong>Fig. 7. An average-l<strong>in</strong>kage cluster diagramof theMalaysian pitcher plant <strong>in</strong>sect food web us<strong>in</strong>g the additivesimilarity measure of Yodzis & W<strong>in</strong>emiller (1999).
DEFINITION OF TROPHIC ROLE SIMILARITY 313predator <strong>and</strong> prey relations, which thus haveadditive similarities of 1.0 <strong>and</strong> identical MDScoord<strong>in</strong>ates [nodes 5 <strong>and</strong> 6; 7 <strong>and</strong> 8; 10 <strong>and</strong> 11;12 <strong>and</strong> 13; 14 <strong>and</strong> 15 F all are shown slightlydisplaced fromtheir coord<strong>in</strong>ate positions so thatthey do not overlap one another <strong>in</strong> Fig. 6(c)].These species are the same pairs that were notedto be exactly regularly equivalent above. Outsideof these species with identical ties <strong>in</strong> the network,the additive similarity measure did not uncoverany nodes with similar network ties or positionwith<strong>in</strong> the network, as the REGE coefficientsdid. The additive similarity measure groupedtaxa <strong>in</strong>dependent of the direction of the ties F amajor drawback. In addition, the top predators<strong>in</strong> the web M. nepenthicola (1) <strong>and</strong> T. klossi (3)are jo<strong>in</strong>ed only after the fourth agglomerationstep (Fig. 7), although they both clearly feed onaquatic <strong>in</strong>sects liv<strong>in</strong>g <strong>in</strong> the pitcher plants(Fig. 3). They feed on the same k<strong>in</strong>ds of <strong>in</strong>sects,but not the exact same species of <strong>in</strong>sects, so theyreceive a low similarity <strong>in</strong> the additive similaritymeasure. But they do feed on the same trophicrole class of <strong>in</strong>sects (green), as can be seen <strong>in</strong> theMDS plot [Fig. 6(a)]. Also, (1) <strong>and</strong> (3) are jo<strong>in</strong>edat the same step as the bacteria <strong>and</strong> protozoa(16), yet these <strong>in</strong>sects are the predators on theaquatic <strong>in</strong>sect larvae group (4–9 <strong>and</strong> 12,13),whereas bacteria <strong>and</strong> protozoa are the prey ofthe aquatic larvae. Aga<strong>in</strong>, the direction of theties is ignored by the additive similarity measure,which results <strong>in</strong> the same level of similarity forthese species that occupy very different trophicroles.Thus, the additive similarity measure appearedto do a poor job at uncover<strong>in</strong>g trophicroles of <strong>in</strong>sects <strong>in</strong> the pitcher plant food web,except <strong>in</strong> the cases where species had exactly thesame predators <strong>and</strong> exactly the same prey. Incontrast, REGE was far superior <strong>in</strong> f<strong>in</strong>d<strong>in</strong>gsimilarity among species’ trophic roles, even ifthe species consumed different prey <strong>and</strong> wereconsumed by different predators.4.2. ST. MARKS, FLORIDA SEAGRASS CARBONFLOW WEBWe now turn to another example, us<strong>in</strong>g thesesame procedures to illustrate the method toaggregate trophically similar taxa <strong>in</strong> a complexfood web. The 51 compartments <strong>in</strong> the food webcollected by Baird et al. (1998) were analysed viathe REGE algorithm, generat<strong>in</strong>g a matrix ofcoefficients (available fromthe authors <strong>and</strong>on-l<strong>in</strong>e at http://drjoe.biology.ecu.edu/regefoodweb).Appendix B lists the names <strong>and</strong> numericalidentification codes for the compartments thatare discussed here; see Christian & Luczkovich(1999) <strong>and</strong> Luczkovich et al. (<strong>in</strong> press) for thecomplete species list for each compartment. TheREGE coefficients were submitted to hierarchicalcluster<strong>in</strong>g <strong>and</strong> R 2 values were computed foreach partition. For display purposes we selecteda partition with ten clusters, which achieveda much better R 2 than partitions with fewerclusters <strong>and</strong> expla<strong>in</strong>ed nearly as much varianceas partitions with more clusters (see scree plot,Fig. 8).We used colors to identify the ten isotrophicclasses of consumers <strong>in</strong> the MDS plot [Fig. 9(a)]:the lime green group, which was the ma<strong>in</strong>producer, the seagrass Halodule wrightii (2); thedark green group, which <strong>in</strong>cluded other benthicproducers [epiphytic algae (3) benthic algae (5)]<strong>and</strong> benthic bacteria (12); the cyan group, which<strong>in</strong>cluded phytoplankton (1) <strong>and</strong> bacterio-plankton(6); the white group, which <strong>in</strong>cludedzooplankton (8); the yellow group, which<strong>in</strong>cluded various benthic <strong>in</strong>vertebrates (nodes 7,9, 13, 15, 17, 19, 21, 22, 25, 27, 28), some fishesR squared0.50.40.30.20 5 10 15 20 25Number of ClustersFig. 8. A scree plot of the R 2 as it varies with number ofclusters fromthe average l<strong>in</strong>kage cluster analysis us<strong>in</strong>g theREGE coefficients derived fromfeed<strong>in</strong>g relations <strong>and</strong>carbon-flow values of the St. Marks National WildlifeRefuge Seagrass Ecosystem<strong>Food</strong> Web
314J. J. LUCZKOVICH ET AL.(31) <strong>and</strong> suspended POC (50); the blue group,which <strong>in</strong>cluded the rema<strong>in</strong><strong>in</strong>g benthic macro<strong>in</strong>vertebrates(nodes 10, 11, 16, 18, 20, 23, 24, 26,29, 30) <strong>and</strong> most fishes (nodes 32, 33, 35, 37–41);the purple group, which <strong>in</strong>cluded the rema<strong>in</strong><strong>in</strong>gfishes (nodes 34,36,42); the magenta group,which <strong>in</strong>cluded herbivorous ducks (43); the redgroup, which <strong>in</strong>cluded carnivorous birds (nodes44–48); <strong>and</strong> the brown group, which <strong>in</strong>cludedmeiofauna (14), <strong>and</strong> non-liv<strong>in</strong>g groups [dissolvedorganic carbon (DOC) (49) <strong>and</strong> sediment particulateorganic carbon (POC) (51)]. Most producers(nodes 1–5) <strong>and</strong> non-liv<strong>in</strong>g compartments(nodes 49, 51) appear on the right side of theMDS plot, the <strong>in</strong>termediate consumers (nodes 7–42) <strong>in</strong> the center of the plot, <strong>and</strong> the carnivorousbirds (nodes 44–48) at the lower left side of theplot. Herbivorous ducks (43) are at the far left,imply<strong>in</strong>g that they are a top predator (<strong>and</strong> theyare not preyed upon by other compartments <strong>in</strong>this web), although they are separated fromother top carnivore birds. Thus, the plotproduces a food web that shows the approximatetrophic positions of all the taxa, mov<strong>in</strong>g fromlow trophic positions on the right to high trophicpositions on the left.Pairs of compartments that are close together<strong>in</strong> the MDS plot have similar trophic roles (e.g.they share high REGE coefficients), whichimplies that they have similar predators as wellas similar prey. For example, the pelagic <strong>and</strong>benthic food webs can be separated: planktoniccompartments (1, 6, 8) occur <strong>in</strong> the upper right<strong>and</strong> center portion of plot, <strong>and</strong> benthic species atthe lower right portion of the plot (3, 5, 12, 14,51). Because some consumer species are <strong>in</strong>termediate<strong>in</strong> their trophic roles (feed on benthic<strong>and</strong> planktonic species <strong>and</strong> are omnivores), theyappear <strong>in</strong> the center of the MDS plot. Thebacterial consumer compartments [bacterioplankton(6) <strong>and</strong> benthic bacteria (12)] aregrouped with the producers <strong>in</strong> the MDS, <strong>in</strong> partbecause they feed upon sediment POC <strong>and</strong> arefed upon by species that are otherwise detritivores<strong>and</strong> herbivores. In this food web, thecarnivorous <strong>and</strong> herbivorous birds are not l<strong>in</strong>kedto the detrital compartment (51), but all otherconsumers are, because the top carnivores’carbon has been assumed to migrate out of thesystem(Baird et al, 1998; Christian & Luczkovich,1999), consistent with the migratory natureof these birds. This similar migration pattern <strong>and</strong>absence of connections to the sediment POC (51)caused all the birds to occur together on the leftside of the MDS plot.We collapsed the same-colored nodes <strong>and</strong>generated an image graph [Fig. 9(b)] that showsthe structure of the food web, while reta<strong>in</strong><strong>in</strong>g therelationships among classes that def<strong>in</strong>e theisotrophic group<strong>in</strong>gs. The isotrophic classeswe have identified are clearly associated withspecific trophic roles <strong>in</strong> the St. Marks food web.The lime <strong>and</strong> dark green groups <strong>in</strong>cluded benthicproducers. The cyan group <strong>in</strong>cluded planktonicproducers <strong>and</strong> the white group <strong>in</strong>cluded planktonicconsumers (zooplankton). The yellowgroup <strong>in</strong>cluded benthic <strong>in</strong>vertebrates <strong>and</strong> fishesthat consumed benthic <strong>and</strong> planktonic producers,benthic bacteria, <strong>and</strong> other consumers(white, blue <strong>and</strong> purple groups). The yellowgroup consumed members of their own group(shown as a self-loop <strong>in</strong> the figure); they are <strong>in</strong>Fig. 6. (a) A display of the two-dimensional non-metric multi-dimensional scal<strong>in</strong>g of the REGE coefficients from theMalaysian pitcher plant <strong>in</strong>sect food web us<strong>in</strong>g the network software Pajek (version 0.83). Arrows trace the path of energy <strong>in</strong>the food web. Colors were used to <strong>in</strong>dentify class membership based on the R 2 regression analysis (see text, Figs 4 <strong>and</strong> 5).Taxa which have identical l<strong>in</strong>ks <strong>and</strong> thus REGE coefficients of 1.0 (5 <strong>and</strong> 6, 7 <strong>and</strong> 8, 10 <strong>and</strong> 11, 12 <strong>and</strong> 13, 14 <strong>and</strong> 15) havebeen plotted with a slight offset so that they do not obscure one another. (b) An image graph of the Malaysian pitcher plant<strong>in</strong>sect food web based on the regular equivalence relations shown <strong>in</strong> (a). (c) The food web network displayed as a twodimensionalnon-metric multi-dimensional scal<strong>in</strong>g of the additive similarity coefficients of Yodzis & W<strong>in</strong>emiller (1999).cFig. 9. (a) A non-metric-multi-dimensional scal<strong>in</strong>g of all nodes <strong>in</strong> the St. Marks seagrass ecosystem carbon-flow foodweb us<strong>in</strong>g REGE-derived isotrophic classes from the cluster analysis, <strong>and</strong> (b) the image graph of the reduced complexitynetwork of the same food web. Colors were used to <strong>in</strong>dentify class membership based on the R 2 regression analysis (see text<strong>and</strong> Fig. 8). In the image graph, the codes for blue class {A} are {4,10, 11, 16, 18, 20, 23, 24, 26, 29, 30, 32, 33, 35, 37, 38, 39,40, 41} <strong>and</strong> yellow class {B} are {7,9,13,15,17,19,21,22,25,27,28,31,50}. See Appendix B for a complete list of compartmentidentification code names.
Fig. 6.Fig. 9.doi: 10.1006/jtbi.2003.3147J. J. LUCZKOVICH ET AL.
DEFINITION OF TROPHIC ROLE SIMILARITY 315turn preyed upon by the zooplankton (white),fishes <strong>and</strong> <strong>in</strong>vertebrates <strong>in</strong> the blue <strong>and</strong> purplegroups, <strong>and</strong> birds <strong>in</strong> the magenta <strong>and</strong> redgroups. Yellow group members thus take part<strong>in</strong> many loops <strong>and</strong> cycles with blue, purple <strong>and</strong>white. In contrast, the blue group members(mostly fish <strong>and</strong> <strong>in</strong>vertebrates) take part <strong>in</strong> acycle only with yellow <strong>and</strong> purple members. Bluegroup members feed upon planktonic producers,but only one class of benthic producers (Halodule,lime green group, <strong>and</strong> not the benthic algae,epiphytes or benthic bacteria, dark green group).Blue group members feed upon members of theirown class, as do yellow group members, but theydo not have members that are consumed byzooplankton (white), unlike yellow group members.Members of the blue group are consumedby members of the purple, magenta <strong>and</strong> redgroups <strong>and</strong> are thus somewhat similar to theyellow group members. The purple groupmembers are fishes that consumed the darkgreen group of benthic producers, but notplanktonic producers, nor the seagrass benthicproducers (lime green); they are different fromthe yellow <strong>and</strong> blue groups <strong>in</strong> this way. Inaddition, they do not have any feed<strong>in</strong>g with<strong>in</strong>their own group. The purple group also consumeswhite, yellow <strong>and</strong> blue group members.They are consumed only by the carnivorousbirds (red group), but not the herbivorous ducks(magenta). The herbivorous ducks (magenta) are<strong>in</strong> their own s<strong>in</strong>gleton class; no other bird groupfeeds on producers (but these ducks also takesome animal prey from the yellow <strong>and</strong> bluegroups, so they are not strictly speak<strong>in</strong>g herbivorous).The red group (predatory birds) feedsfromthe yellow, blue <strong>and</strong> purple classes <strong>and</strong> hasone member that consumes another (raptorsconsume gulls). All compartments except for thebirds (red <strong>and</strong> magenta) are consumed by thebrown group, which <strong>in</strong>cludes detritus [sedimentPOC (51)].5. DiscussionA major goal <strong>in</strong> ecology is to develop acomprehensive model of the ecological niche orrole played by a species <strong>in</strong> a community orecosystem. One way that the ecologists haveworked toward this goal is through the analysisof trophic relations <strong>in</strong> food webs. Concepts suchas of trophospecies, trophic role, trophic group,trophic position, trophic level, guild <strong>and</strong> relatedconcepts perta<strong>in</strong><strong>in</strong>g to food webs have beendeveloped, all of which are attempts to reducetrophic complexity by identify<strong>in</strong>g classes of‘‘isotrophic’’ species that occupy analogouspositions <strong>in</strong> the food web. Our contributionsto this endeavor are at two levels. First, wecontribute to the goal of comprehend<strong>in</strong>g trophicroles <strong>in</strong> ecosystems by provid<strong>in</strong>g a formalmathematical basis, express<strong>in</strong>g trophic role <strong>in</strong>terms of equivalence relations <strong>and</strong> graph homomorphisms.In this respect, we extend the workof Yodzis & W<strong>in</strong>emiller (1999), who developedmeasures <strong>and</strong> algorithms for detect<strong>in</strong>g structure<strong>in</strong> food webs, by locat<strong>in</strong>g their work with<strong>in</strong> aframework of fundamental mathematical notionsof equivalence <strong>and</strong> isomorphism. In addition,we l<strong>in</strong>k their work to research <strong>in</strong> the socialsciences (Lorra<strong>in</strong> & White, 1971) <strong>and</strong> computersciences (Starke 1972), among other fields.Second, we <strong>in</strong>troduce a specific model of foodweb structure F regular equivalence F whichwe believe captures the notion of trophic rolebetter than other formal models, such as thoseoffered by Yodzis & W<strong>in</strong>emiller (1999) <strong>and</strong>Hirata & Ulanowicz (1985). The recursive natureof the def<strong>in</strong>ition might suggest that computationof the model would be difficult, but <strong>in</strong> fact veryefficient algorithms exist, such as REGE, whichprovide a measure of the degree of equivalenceamong all pairs of species, <strong>and</strong> these algorithmsare widely available (Borgatti et al., 1999). Wehave illustrated our approach here us<strong>in</strong>g twofood webs fromthe literature, namely theMalaysian pitcher plant <strong>in</strong>sect topological foodweb <strong>and</strong> the St. Marks seagrass ecosystemcarbon-flow dynamic food web. We have alsoapplied the approach to rocky <strong>in</strong>tertidal, desert,<strong>and</strong> ra<strong>in</strong>forest food webs (Johnson et al. 2000).The regular equivalence model we <strong>in</strong>troducehere contrasts with structural equivalence, <strong>in</strong>which nodes are equivalent to the extent theyhave the same k<strong>in</strong>d of ties to the same<strong>in</strong>dividuals (rather than classes of <strong>in</strong>dividuals).We show that the additive trophic similaritymeasure recently developed by Yodzis & W<strong>in</strong>emiller(1999) is a measure of structural equivalence.Alternative measures of structural
316J. J. LUCZKOVICH ET AL.equivalence, based on euclidean distances <strong>and</strong>correlations, as well alternative algorithms, arewell known <strong>in</strong> the social sciences <strong>and</strong> areavailable <strong>in</strong> st<strong>and</strong>ard software packages. Structuralequivalence is ideally suited for certa<strong>in</strong>analytical tasks. Structurally equivalent speciesare literally are structurally <strong>in</strong>dist<strong>in</strong>guishable,tied to the same others <strong>in</strong> the same ways.Consequently, for all structural ecologicalprocesses F by which we mean processes whoseoutcomes are pr<strong>in</strong>cipally determ<strong>in</strong>ed by thestructure of the trophic network F we canexpect structurally equivalent species to havesimilar outcomes, or common fate (Homans,1950). Thus, <strong>in</strong> trophic impact studies, anyth<strong>in</strong>gthat happens to a species of predator or prey isexpected to happen to all other species <strong>in</strong> thesame structural equivalence class, because theyhave exactly the same prey or predators. In thisrespect, structural equivalence may have anadvantage over maximal regular equivalence, asit is unclear if or under what conditions thecommon fate hypothesis can be applied toregular equivalence classes.The disadvantage of structural equivalence isthat it cannot recognize the structural similarityof species that share no predators or prey.Consequently, species <strong>in</strong> clearly analogous positions,which are functionally equivalent, are seenas completely dissimilar. For example, <strong>in</strong> theMalaysian <strong>in</strong>sect food web, food sources that aresimilar (organic debris <strong>and</strong> recently drowned<strong>in</strong>sects) were not regarded as similar by thestructural method of Yodzis & W<strong>in</strong>emiller(1999), yet they clearly are similar <strong>in</strong> that theyconsume noth<strong>in</strong>g <strong>and</strong> are eaten by similarspecies. Regular equivalence solves this problemof not detect<strong>in</strong>g similarity <strong>in</strong> trophic role whenspecies share no or very few prey or predators.Regular equivalence can be used to f<strong>in</strong>dspecies play<strong>in</strong>g similar roles <strong>in</strong> spatially <strong>and</strong>temporally separate food webs <strong>in</strong> which speciesdo not consume the exact same prey, possiblyopen<strong>in</strong>g the door for new k<strong>in</strong>ds of comparativeresearch. For example, <strong>in</strong> Jackson et al. (2001),the authors proposed that humans have alteredcoastal ecosystems by fish<strong>in</strong>g <strong>and</strong> hunt<strong>in</strong>gactivities that have caused long-last<strong>in</strong>g foodweb changes. In the Pacific kelp forest foodweb, when sea otters were extirpated, there was adecades-long lag response <strong>in</strong> the overgraz<strong>in</strong>geffect of sea urch<strong>in</strong>s, their primary prey. The lagwas due to the fact that other unexploited speciessuch as abalones <strong>and</strong> sp<strong>in</strong>y lobsters ‘‘y ofa similar trophic level assumed the ecologicalroles of overfished speciesy (emphasis ours)(p. 629)’’. Our regular equivalence analysiswould allow a quantitative assessment of thesimilarity of these species’ trophic roles, evenwhen they did not prey on the same species <strong>and</strong>were preyed upon by different species. Thus, wecan create a simple model of trophically redundantrelationships when they occur <strong>in</strong> thesame food web at different po<strong>in</strong>ts <strong>in</strong> time, oreven <strong>in</strong> spatially separate food webs. Whilestructural equivalence may also be used <strong>in</strong> suchan example, it would be better for study<strong>in</strong>gdirect trophic impacts <strong>and</strong> model<strong>in</strong>g directcompetition between species, whereas regularequivalence could be used to model the potentialfor species to overlap <strong>in</strong> trophic role, shouldtheir feed<strong>in</strong>g habits shift as suggested by Jacksonet al. (2001).The approach we have outl<strong>in</strong>ed has someadditional benefits <strong>in</strong> quantify<strong>in</strong>g trophic roles<strong>and</strong> display<strong>in</strong>g reduced complexity food webs.Like the approach of Yodzis & W<strong>in</strong>emiller(1999), we have proposed a method that willf<strong>in</strong>d similarity among species based on theirrelationships with predators <strong>and</strong> prey. This thenforms a new basis for aggregat<strong>in</strong>g species.The problemof how to aggregate nodes <strong>in</strong> anetwork of <strong>in</strong>teractions so as to elim<strong>in</strong>ate detailwhile reta<strong>in</strong><strong>in</strong>g structure is universal <strong>in</strong> systemmodel<strong>in</strong>g. In fact, this issue has been formallyapproached previously <strong>in</strong> ecological networkanalysis. A method for network aggregationwas proposed by Hirata & Ulanowicz (1985), <strong>in</strong>which a 17-compartment carbon-flow networkof a tidal marsh creek was aggregated <strong>in</strong>to aseven-compartment system by m<strong>in</strong>imiz<strong>in</strong>g theloss of mutual <strong>in</strong>formation that occurred dur<strong>in</strong>ga sequence of aggregation steps. Their graph ofthe seven-compartment ecosystem flow diagramwas essentially an image graph, but the aggregationswere based on m<strong>in</strong>imiz<strong>in</strong>g the decrease<strong>in</strong> network mutual <strong>in</strong>formation, an empiricalstatistic they computed, which is based onnetwork redundancy measures. Although thegeneral approach is similar to ours, Hirata &
DEFINITION OF TROPHIC ROLE SIMILARITY 317Ulanowicz’s (1985) node aggregation approachis quite different <strong>in</strong> mathematical detail fromours, <strong>and</strong> we plan to compare them systematically<strong>in</strong> future work.Although we have emphasized the differencesbetween our maximal regular equivalenceapproach <strong>and</strong> the structural equivalence approachesof Yodzis & W<strong>in</strong>emiller (1999), it isimportant to remember that there is a fundamentalcommonality as well. As noted earlier,structural equivalence is a member of the regularequivalence family, <strong>and</strong> any species that arestructurally equivalent are necessarily regularlyequivalent, as we illustrated <strong>in</strong> the Malaysianpitcher plant food web example. In that example,four pairs of nodes with the exact same predator<strong>and</strong> prey relationships were found to be structurallyequivalent, <strong>and</strong> they were also exactlyregularly equivalent. The similarity of trophicrelations between any two nodes could bedeterm<strong>in</strong>ed us<strong>in</strong>g the structural methods alonewhen their nearest-neighbor l<strong>in</strong>ks were considered;but when similarity among nodes wasestimated while consider<strong>in</strong>g l<strong>in</strong>ks that were morethan a one l<strong>in</strong>k away fromthe nodes, suchsimilarity could be estimated us<strong>in</strong>g REGEcoefficients. If the equivalence approach provideslenses with which to view food webs, thestructural equivalence provides f<strong>in</strong>er resolutionat the expense of the big picture, while regularequivalence provides the big picture at theexpense of only a few details.A key area for future research concerns thesignificance of isotrophic classes F whetherdef<strong>in</strong>ed by structural equivalence or regularequivalence F for the species that comprisethem<strong>and</strong> for the webs as a whole. Yodzis &W<strong>in</strong>emiller (1999) evaluate the relative merits oftwo different measures of trophic similarity byus<strong>in</strong>g cophenetic correlations. But a copheneticcorrelation only measures the extent to which agiven similarity matrix can be nicely representedby a dendrogram(i.e. a hierarchical cluster<strong>in</strong>gprocedure). It is not an external criterion ofvalidity. What is needed is empirical researchrelat<strong>in</strong>g membership <strong>in</strong> isotrophic classes tooutcome criteria, such as similar reactionsto environmental changes, similar effects onprey species, similar responses to the removalor addition of predator species, <strong>and</strong> so on. Onlythen can we really determ<strong>in</strong>e whether onedef<strong>in</strong>ition of trophic group<strong>in</strong>g is more usefulthan other (<strong>and</strong> whether any k<strong>in</strong>d of trophicgroup<strong>in</strong>g is useful at all).This work was supported by a BiocomplexityIncubation grant fromthe National Science Foundation(SES0083508). The East Carol<strong>in</strong>a UniversityDivision of Research <strong>and</strong> Graduate Studies supportedthe authors <strong>in</strong> the preparation of this paper <strong>and</strong>provided publication costs. We thank P. Stil<strong>in</strong>g fortaxonomic assistance <strong>and</strong> verification of the <strong>in</strong>sect foodweb data. B. Patten is acknowledged for provid<strong>in</strong>ghelpful criticisms. We also thank R. Ulanowicz <strong>and</strong>R. Bernard for review<strong>in</strong>g the manuscript.REFERENCESAdams, S. M., Kimmel, B.L.&Ploskey, G. R. (1983).Sources of organic matter for reservoir fish production:a trophic-dynamics analysis. Can. J. Fish. Aquat. Sci. 40,1480–1495.Baird, D., Luczkovich, J.J.&Christian, R. R. (1998).Assessment of spatial <strong>and</strong> temporal variability <strong>in</strong>ecosystemattributes of the St. Marks National WildlifeRefuge, Apalachee Bay, Florida. Estuar<strong>in</strong>e Coastal ShelfSci. 47, 329–349, doi:10.1006/ecss.1998.0360.Batagelj, V.&Mrvar, A. (1999). Pajek, version 0.83,available on-l<strong>in</strong>e at http://vlado.fmf.uni-lj.si/pub/networks/pajek.Beaver, R. A. (1985). Geographical variation <strong>in</strong> food webstructure <strong>in</strong> Nepenthes pitcher plants. Ecol. Entomol. 10,241–248.Borgatti, S.P.&Everett, M. G. (1989). The class of allregular equivalences: algebraic structure <strong>and</strong> computation.Soc. Networks 11, 65–88.Borgatti,S.P.&Everett, M. G. (1993). Two algorithmsfor comput<strong>in</strong>g regular equivalence. Soc. Networks 16,43–55.Borgatti, S. P., Everett, M.G.&Shirey, P. (1990). LSsets, lambda sets, <strong>and</strong> other cohesive subsets. Soc.Networks 12, 337–357.Borgatti, S. P., Everett, M.G.&Freeman, L. (1999).UCINET V. Software for Social Network Analysis.Harvard, MA: Analytical Technologies.Boyd, J. P. (1969). The algebra of group k<strong>in</strong>ship. J. Math.Psychol. 6, 139–167.Christian, R.R.&Luczkovich, J. J. (1999). Organiz<strong>in</strong>g<strong>and</strong> underst<strong>and</strong><strong>in</strong>g a w<strong>in</strong>ter’s seagrass foodweb networkthrough effective trophic levels. Ecol. Model. 117, 99–124.Cohen, J. E. & Newman, C. M. (1985). A stochastictheory of community food webs. I. Models <strong>and</strong>aggregated data. Proc. R. Soc. London Biol. Sci. 224,421–448.Cous<strong>in</strong>s, S. H. (1985). Ecologists build pyramids aga<strong>in</strong>.New Sci. 106, 50–54.Cous<strong>in</strong>s, S. H. (1987). The decl<strong>in</strong>e of the trophic levelconcept. Trends Ecol. Evol. 2, 312–316.Elton, C. S. (1927). Animal Ecology. London: Sidgwick<strong>and</strong> Jackson.
318J. J. LUCZKOVICH ET AL.Everett, M.G.&Borgatti, S. P. (1991). <strong>Role</strong> colour<strong>in</strong>ga graph. Math. Soc. Sci. 21, 183–188.Everett, M. G. & Borgatti, S. P. (1994). Regularequivalence: General theory. J. Math. Soc. 19, 29–52.Everett, M. G. & Borgatti, S. P. (1996). Exactcolorations of graphs <strong>and</strong> digraphs. Soc. Networks 18,319–331.Goldwasser, L.&Roughgarden, J. (1993). Construction<strong>and</strong> analysis of a large Caribbean food web. Ecology74, 1216–1233.Goodenough, W. H. (1969). Reth<strong>in</strong>k<strong>in</strong>g ‘‘status’’ <strong>and</strong>‘‘role’’: toward a general model of the cultural organizationof social relationships. In Cognitive Anthropology(Tyler, S. A., ed.), pp. 311-330. New York: Holt,R<strong>in</strong>ehart, <strong>and</strong> W<strong>in</strong>ston.Hirata, H. & Ulanowicz, R. E. (1985). Informationtheoretical analysis of the aggregation <strong>and</strong> hierarchicalstructure of ecological networks. J. theor. Biol. 116,321–341.Homans, G. C. (1950). The Human Group. New York:Harcourt, Brace, <strong>and</strong> World.Homans, G. C. (1961). Social Behavior: Its ElementaryForms. New York: Harcourt, Brace, <strong>and</strong> World.Hutch<strong>in</strong>son, G. E. (1958). Conclud<strong>in</strong>g remarks. ColdSpr<strong>in</strong>g Harbor Symp. Quant. Biol. 22, 415–427.Jaccard, P. (1900). Contribution au problame de l’immigrationpost-glaciaire de la flore alp<strong>in</strong>e. Bull. Soc.Vaudoise Sci. Nat. 36, 87–130.Jackson,J.B.C.,Kirby,M.X.,Berger,W.H.,Bjorndal,K. J., Botsford, L. W., Bourque, B. J., Bradbury, R.H., Cooke, R., Erl<strong>and</strong>son, J., Estes, J. A., Hughes,T. P., Kidwell, S., Lange, C. B., Lenihan, H. S., P<strong>and</strong>olfi,J. M., Peterson, C. H., Steneck, R. S., Tegner,M. J. & Wa r n e r, R. H. (2001). Historical overfish<strong>in</strong>g <strong>and</strong>the recent collapse of coastal ecosystems. Science 293,629–638.Johnson, J. C., Borgatti, S. P., Luczkovich, J. J. &Everett, M. G. (2001). Network role analysis <strong>in</strong> thestudy of food webs: an application of regular rolecoloration. J. Soc. Struct. 2, on-l<strong>in</strong>e: http://www.he<strong>in</strong>z.cmu.edu/project/INSNA/joss/<strong>in</strong>dex1.html.Johnson, S. C. (1967). Hierarchical cluster<strong>in</strong>g schemes.Psychometrika 32, 241–253.L<strong>in</strong>deman, R. L. (1942). The trophic–dynamic aspect ofecology. Ecology 23, 399–418.Lorra<strong>in</strong>,F.&White, H. C. (1971). Structural equivalenceof <strong>in</strong>dividuals <strong>in</strong> networks. J. Math. Soc. 1, 49–80.Luczkovich, J. J., Ward, G. P., Johnson, J. C., Christian,R. R., Baird, D., Neckles, H. & Rizzo, B.Determ<strong>in</strong><strong>in</strong>g the trophic guilds of fishes <strong>and</strong> macro<strong>in</strong>vertebrates<strong>in</strong> a seagrass food web. Estuaries, <strong>in</strong> press.Mayhew, B. (1980). Structuralismvs. <strong>in</strong>dividualism.Part 1: shadow box<strong>in</strong>g <strong>in</strong> the dark. Soc. Forces 59,335–375.Merton, R. K. (1959). Social Theory <strong>and</strong> Social Structure.New York: Free Press.Nadel, S. F. (1957). The Theory of Social Structure.New York: Free Press.Perrson, L., Bengtsson, J., Menge, B. A. & Power,M. E. (1996). Productivity <strong>and</strong> consumer regulation Fconcepts, patterns, <strong>and</strong> mechanisms. In: <strong>Food</strong> <strong>Webs</strong>:Integration of Patterns <strong>and</strong> Dynamics. (Polis, G. &W<strong>in</strong>emiller, K. O., eds), pp. 396–434. Chapman & Hall.New York, NY, U.S.A.Root, R. B. (1967). The niche exploitation pattern of theblue-gray gnatcatcher. Ecol. Monogr. 37, 317–350.Starke, P. H. (1972). Abstract Automata. Amsterdam:North Holl<strong>and</strong> Publish<strong>in</strong>g Company, Elsevier.Stil<strong>in</strong>g, P. (2002). Ecology: Theories <strong>and</strong> Applications.Upper Saddle River, NJ: Prentice-Hall.Ulanowicz, R. E. (1986). Growth <strong>and</strong> Development:Ecosystems Phenomenology. New York: Spr<strong>in</strong>ger-Verlag.White, H. C. (1963). An Anatomy of K<strong>in</strong>ship. EnglewoodCliffs, NJ: Prentice-Hall.White, H.C.&Reitz, K. P. (1983). Graph <strong>and</strong> semigrouphomomorphisms on networks of relations. Soc. Networks5, 193–235.Yo dzi s, P. (1988). The <strong>in</strong>determ<strong>in</strong>acy of ecological <strong>in</strong>teractionsas perceived through perturbation experiments.Ecology 69, 508–515.Yo dzi s, P. & W<strong>in</strong>emiller, K. O. (1999). In search ofoperational trophospecies <strong>in</strong> a tropical aquatic food web.Oikos 87, 327–340.APPENDIX AA list of the species of <strong>in</strong>sects <strong>and</strong> compartments<strong>in</strong> the Malaysian pitcher plant topologicalfood web (Beaver, 1985), taken fromStil<strong>in</strong>g(2002).(1) Misumenops nepenthicola, (2) Encyrtid(near Trach<strong>in</strong>aephagus), (3) Toxorhynchies klossi,(4) Lestodiplosis sy<strong>in</strong>gopais, (5) Megaselianepenth<strong>in</strong>a, (6) Endonepenth<strong>in</strong>ia schuitemakeri,(7) Triperoides tenax, (8) Triperoides bambusa,(9) Dasyhelea nepenthicola, (10) Nepenthosyrphussp., (11) Pierretia urceola, (12) Culex curtipalpis,(13) Culex lucaris, (14) Anotidae sp. 1, (15)Anotidae sp. 2, (16) bacteria <strong>and</strong> protozoa, (17)live <strong>in</strong>sects, (18) recently drowned <strong>in</strong>sects <strong>and</strong>(19) older organic debris.APPENDIX BA list of the identification codes <strong>and</strong> compartmentnames for the St. Marks seagrass carbonflowfood web taken fromBaird et al. (1998). SeeChristian & Luczkovich (1999) for a completespecies list with<strong>in</strong> each compartment.(1) Phytoplankton, (2) Halodule wrighti, (3)micro-epiphytes, (4) macro-epiphytes, (5)benthic algae, (6) bacterio-plankton, (7) microprotozoa,(8) zooplankton, (9) epiphyte-graz<strong>in</strong>gamphipods, (10) suspension-feed molluscs, (11)suspension-feed polychaetes, (12) benthic bacteria,
DEFINITION OF TROPHIC ROLE SIMILARITY 319(13) micro-fauna, (14) meiofauna, (15) depositfeed<strong>in</strong>gamphipods, (16) detritus-feed<strong>in</strong>g crustaceans,(17) hermit crab, (18) spider crab, (19)omnivorous crabs, (20) blue crab, (21) isopod,(22) brittle stars, (23) herbivorous shrimp, (24)predatory shrimp, (25) deposit-feed<strong>in</strong>g gastropod,(26) deposit-feed<strong>in</strong>g polychaetes, (27) predatorypolychaetes, (28) predatory gastropod,(29) epiphyte-graz<strong>in</strong>g gastropod, (30) othergastropods, (31) catfish <strong>and</strong> st<strong>in</strong>grays, (32)tonguefish , (33) gulf flounder <strong>and</strong> needle fish,(34) southern hake <strong>and</strong> sea rob<strong>in</strong>s, (35)atlantic silverside <strong>and</strong> bay anchovies, (36)gobies <strong>and</strong> blennies, (37) p<strong>in</strong>fish, (38) spot, (39)pipefish <strong>and</strong> seahorses, (40) sheepsheadm<strong>in</strong>now, (41) red drum, (42) killifish, (43)herbivorous ducks, (44) benthos-eat<strong>in</strong>g birds,(45) fish-eat<strong>in</strong>g birds, (46) fish <strong>and</strong> crustaceaneat<strong>in</strong>g birds, (47) gulls, (48) raptors, (49)dissolved organic carbon (DOC), (50) suspendedparticulate organic carbon, (51) sedimentPOC.