Defining and Measuring Trophic Role Similarity in Food Webs Using ...
Defining and Measuring Trophic Role Similarity in Food Webs Using ...
Defining and Measuring Trophic Role Similarity in Food Webs Using ...

You also want an ePaper? Increase the reach of your titles
YUMPU automatically turns print PDFs into web optimized ePapers that Google loves.
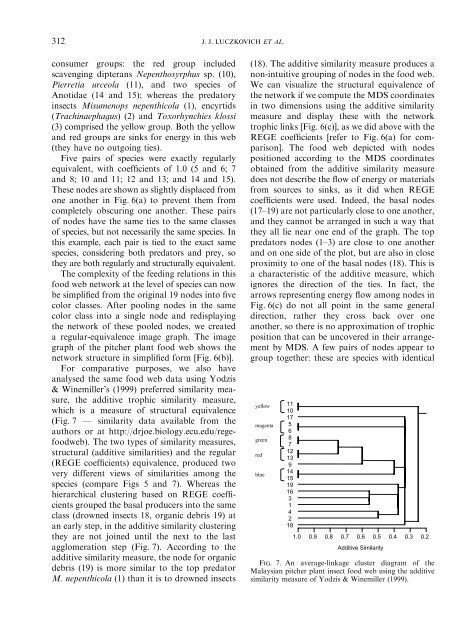
312J. J. LUCZKOVICH ET AL.consumer groups: the red group <strong>in</strong>cludedscaveng<strong>in</strong>g dipterans Nepenthosyrphus sp. (10),Pierretia urceola (11), <strong>and</strong> two species ofAnotidae (14 <strong>and</strong> 15); whereas the predatory<strong>in</strong>sects Misumenops nepenthicola (1), encyrtids(Trach<strong>in</strong>aephagus) (2) <strong>and</strong> Toxorhynchies klossi(3) comprised the yellow group. Both the yellow<strong>and</strong> red groups are s<strong>in</strong>ks for energy <strong>in</strong> this web(they have no outgo<strong>in</strong>g ties).Five pairs of species were exactly regularlyequivalent, with coefficients of 1.0 (5 <strong>and</strong> 6; 7<strong>and</strong> 8; 10 <strong>and</strong> 11; 12 <strong>and</strong> 13; <strong>and</strong> 14 <strong>and</strong> 15).These nodes are shown as slightly displaced fromone another <strong>in</strong> Fig. 6(a) to prevent themfromcompletely obscur<strong>in</strong>g one another. These pairsof nodes have the same ties to the same classesof species, but not necessarily the same species. Inthis example, each pair is tied to the exact samespecies, consider<strong>in</strong>g both predators <strong>and</strong> prey, sothey are both regularly <strong>and</strong> structurally equivalent.The complexity of the feed<strong>in</strong>g relations <strong>in</strong> thisfood web network at the level of species can nowbe simplified from the orig<strong>in</strong>al 19 nodes <strong>in</strong>to fivecolor classes. After pool<strong>in</strong>g nodes <strong>in</strong> the samecolor class <strong>in</strong>to a s<strong>in</strong>gle node <strong>and</strong> redisplay<strong>in</strong>gthe network of these pooled nodes, we createda regular-equivalence image graph. The imagegraph of the pitcher plant food web shows thenetwork structure <strong>in</strong> simplified form [Fig. 6(b)].For comparative purposes, we also haveanalysed the same food web data us<strong>in</strong>g Yodzis& W<strong>in</strong>emiller’s (1999) preferred similarity measure,the additive trophic similarity measure,which is a measure of structural equivalence(Fig. 7 F similarity data available from theauthors or at http://drjoe.biology.ecu.edu/regefoodweb).The two types of similarity measures,structural (additive similarities) <strong>and</strong> the regular(REGE coefficients) equivalence, produced twovery different views of similarities among thespecies (compare Figs 5 <strong>and</strong> 7). Whereas thehierarchical cluster<strong>in</strong>g based on REGE coefficientsgrouped the basal producers <strong>in</strong>to the sameclass (drowned <strong>in</strong>sects 18, organic debris 19) atan early step, <strong>in</strong> the additive similarity cluster<strong>in</strong>gthey are not jo<strong>in</strong>ed until the next to the lastagglomeration step (Fig. 7). Accord<strong>in</strong>g to theadditive similarity measure, the node for organicdebris (19) is more similar to the top predatorM. nepenthicola (1) than it is to drowned <strong>in</strong>sects(18). The additive similarity measure produces anon-<strong>in</strong>tuitive group<strong>in</strong>g of nodes <strong>in</strong> the food web.We can visualize the structural equivalence ofthe network if we compute the MDS coord<strong>in</strong>ates<strong>in</strong> two dimensions us<strong>in</strong>g the additive similaritymeasure <strong>and</strong> display these with the networktrophic l<strong>in</strong>ks [Fig. 6(c)], as we did above with theREGE coefficients [refer to Fig. 6(a) for comparison].The food web depicted with nodespositioned accord<strong>in</strong>g to the MDS coord<strong>in</strong>atesobta<strong>in</strong>ed from the additive similarity measuredoes not describe the flow of energy or materialsfromsources to s<strong>in</strong>ks, as it did when REGEcoefficients were used. Indeed, the basal nodes(17–19) are not particularly close to one another,<strong>and</strong> they cannot be arranged <strong>in</strong> such a way thatthey all lie near one end of the graph. The toppredators nodes (1–3) are close to one another<strong>and</strong> on one side of the plot, but are also <strong>in</strong> closeproximity to one of the basal nodes (18). This isa characteristic of the additive measure, whichignores the direction of the ties. In fact, thearrows represent<strong>in</strong>g energy flow among nodes <strong>in</strong>Fig. 6(c) do not all po<strong>in</strong>t <strong>in</strong> the same generaldirection, rather they cross back over oneanother, so there is no approximation of trophicposition that can be uncovered <strong>in</strong> their arrangementby MDS. A few pairs of nodes appear togroup together: these are species with identicalyellowmagentagreenredblue111017568712139141519163142181.0 0.9 0.8 0.7 0.6 0.5 0.4 0.3 0.2Additive <strong>Similarity</strong>Fig. 7. An average-l<strong>in</strong>kage cluster diagramof theMalaysian pitcher plant <strong>in</strong>sect food web us<strong>in</strong>g the additivesimilarity measure of Yodzis & W<strong>in</strong>emiller (1999).