Financial Statements, Statement of Directors - Hemas Holdings, Ltd
Financial Statements, Statement of Directors - Hemas Holdings, Ltd
Financial Statements, Statement of Directors - Hemas Holdings, Ltd
- No tags were found...

Create successful ePaper yourself
Turn your PDF publications into a flip-book with our unique Google optimized e-Paper software.
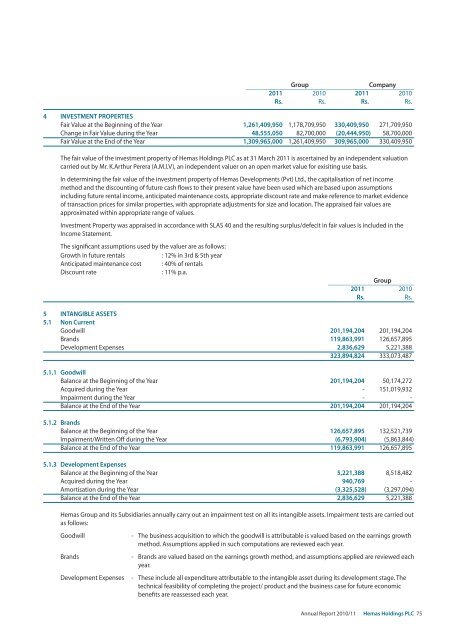
GroupCompany2011 2010 2011 2010Rs. Rs. Rs. Rs.4 INVESTMENT PROPERTIESFair Value at the Beginning <strong>of</strong> the Year 1,261,409,950 1,178,709,950 330,409,950 271,709,950Change in Fair Value during the Year 48,555,050 82,700,000 (20,444,950) 58,700,000Fair Value at the End <strong>of</strong> the Year 1,309,965,000 1,261,409,950 309,965,000 330,409,950The fair value <strong>of</strong> the investment property <strong>of</strong> <strong>Hemas</strong> <strong>Holdings</strong> PLC as at 31 March 2011 is ascertained by an independent valuationcarried out by Mr. K.Arthur Perera (A.M.I.V), an independent valuer on an open market value for exisiting use basis.In determining the fair value <strong>of</strong> the investment property <strong>of</strong> <strong>Hemas</strong> Developments (Pvt) <strong>Ltd</strong>., the capitalisation <strong>of</strong> net incomemethod and the discounting <strong>of</strong> future cash flows to their present value have been used which are based upon assumptionsincluding future rental income, anticipated maintenance costs, appropriate discount rate and make reference to market evidence<strong>of</strong> transaction prices for similar properties, with appropriate adjustments for size and location. The appraised fair values areapproximated within appropriate range <strong>of</strong> values.Investment Property was appraised in accordance with SLAS 40 and the resulting surplus/defecit in fair values is included in theIncome <strong>Statement</strong>.The significant assumptions used by the valuer are as follows:Growth in future rentals: 12% in 3rd & 5th yearAnticipated maintenance cost : 40% <strong>of</strong> rentalsDiscount rate: 11% p.a.Group2011 2010Rs.Rs.5 INTANGIBLE ASSETS5.1 Non CurrentGoodwill 201,194,204 201,194,204Brands 119,863,991 126,657,895Development Expenses 2,836,629 5,221,388323,894,824 333,073,4875.1.1 GoodwillBalance at the Beginning <strong>of</strong> the Year 201,194,204 50,174,272Acquired during the Year - 151,019,932Impairment during the Year - -Balance at the End <strong>of</strong> the Year 201,194,204 201,194,2045.1.2 BrandsBalance at the Beginning <strong>of</strong> the Year 126,657,895 132,521,739Impairment/Written Off during the Year (6,793,904) (5,863,844)Balance at the End <strong>of</strong> the Year 119,863,991 126,657,8955.1.3 Development ExpensesBalance at the Beginning <strong>of</strong> the Year 5,221,388 8,518,482Acquired during the Year 940,769 -Amortisation during the Year (3,325,528) (3,297,094)Balance at the End <strong>of</strong> the Year 2,836,629 5,221,388<strong>Hemas</strong> Group and its Subsidiaries annually carry out an impairment test on all its intangible assets. Impairment tests are carried outas follows:Goodwill - The business acquisition to which the goodwill is attributable is valued based on the earnings growthmethod. Assumptions applied in such computations are reviewed each year.Brands - Brands are valued based on the earnings growth method, and assumptions applied are reviewed eachyear.Development Expenses - These include all expenditure attributable to the intangible asset during its development stage. Thetechnical feasibility <strong>of</strong> completing the project/ product and the business case for future economicbenefits are reassessed each year.Annual Report 2010/11 <strong>Hemas</strong> <strong>Holdings</strong> PLC 75