Financial Statements, Statement of Directors - Hemas Holdings, Ltd
Financial Statements, Statement of Directors - Hemas Holdings, Ltd
Financial Statements, Statement of Directors - Hemas Holdings, Ltd
- No tags were found...

You also want an ePaper? Increase the reach of your titles
YUMPU automatically turns print PDFs into web optimized ePapers that Google loves.
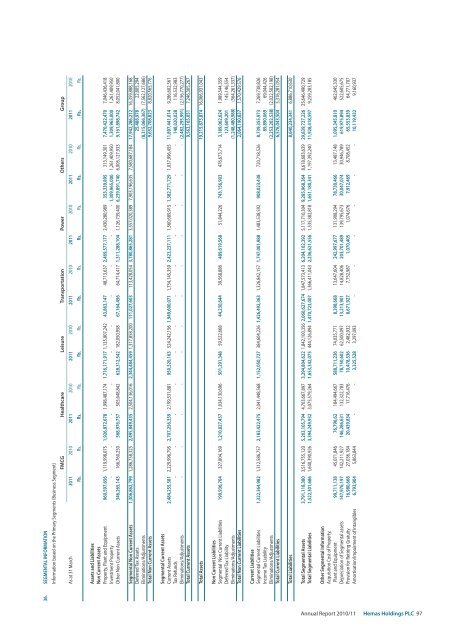
36. SEGMENTAL INFORMATIONInformation based on the Primary Segments (Business Segment)FMCG Healthcare Leisure Transportation Power Others GroupAs at 31 March 2011 2010 2011 2010 2011 2010 2011 2010 2011 2010 2011 2010 2011 2010Rs. Rs. Rs. Rs. Rs. Rs. Rs. Rs. Rs. Rs. Rs. Rs. Rs. Rs.Assets and LiabilitiesNon Current AssetsProperty, Plant and Equipment 960,597,656 1,119,998,075 1,926,872,678 1,998,487,174 1,716,171,917 1,135,807,242 43,863,147 48,713,637 2,469,577,177 2,430,280,989 353,339,895 313,149,301 7,470,422,470 7,046,436,418Investment Property - - - - - - - - - - 1,309,965,000 1,261,409,950 1,309,965,000 1,261,409,950Other Non Current Assets 346,265,143 166,760,250 568,976,757 505,648,842 628,312,542 182,050,958 67,164,456 64,714,417 1,311,288,104 1,126,739,400 6,239,891,740 6,006,127,933 9,161,898,742 8,052,041,800Segmental Non Current Assets 1,306,862,799 1,286,758,325 2,495,849,435 2,504,136,016 2,344,484,459 1,317,858,200 111,027,603 113,428,054 3,780,865,281 3,557,020,389 7,903,196,635 7,580,687,184 17,942,286,212 16,359,888,168Deferred Tax Assets 25,488,978 22,805,294Eliminations/Adjustments (8,315,066,367) (7,562,127,686)Total Non Current Assets 9,652,708,823 8,820,565,776Segmental Current AssetsCurrent Assets 2,484,255,581 2,229,996,795 2,707,256,359 2,199,531,881 950,320,163 524,242,156 1,949,600,071 1,734,145,359 2,423,237,111 1,560,689,915 1,382,771,729 1,037,996,455 11,897,441,014 9,286,602,561Tax Refunds - - - - - - - - - - - - 148,020,028 116,532,983Eliminations/Adjustments - - - - - - - - - - - - (2,482,295,991) (2,156,770,277)Total Current Assets 9,563,165,051 7,246,365,267Total Assets 19,215,873,874 16,066,931,043Non Current LiabilitiesSegmental Non Current Liabilities 199,936,704 327,804,169 1,210,827,457 1,034,130,696 501,291,348 59,522,668 44,230,644 39,568,886 489,619,568 51,844,226 743,156,903 476,673,714 3,189,062,624 1,989,544,359Deferred Tax Liability 123,609,201 145,146,554Eliminations/Adjustments (1,248,480,988) (564,261,337)Total Non Current Liabilities 2,064,190,837 1,570,429,576Current LiabilitiesSegmental Current Liabilities 1,322,364,982 1,312,586,757 2,183,422,475 2,041,448,568 1,152,050,727 384,604,226 1,426,492,363 1,326,842,157 1,747,001,988 1,483,538,592 908,023,438 720,718,526 8,739,355,973 7,269,738,826Income Tax Liability 89,890,069 69,044,426Eliminations/Adjustments (2,253,202,538) (2,022,502,198)Total Current Liabilities 6,576,043,504 5,316,281,054Total Liabilities 8,640,234,341 6,886,710,630Total Segmental Assets 3,791,118,380 3,516,755,120 5,203,105,794 4,703,667,897 3,294,804,622 1,842,100,356 2,060,627,674 1,847,573,413 6,204,102,392 5,117,710,304 9,285,968,364 8,618,683,639 29,839,727,226 25,646,490,729Total Segmental Liabilities 1,522,301,686 1,640,390,926 3,394,249,932 3,075,579,264 1,653,342,075 444,126,894 1,470,723,007 1,366,411,043 2,236,621,556 1,535,382,818 1,651,180,341 1,197,392,240 11,928,418,597 9,259,283,185Other Segmental InformationAcquisition Cost <strong>of</strong> Property,Plant and Equipment 99,711,138 45,071,846 76,796,62 184,494,667 588,711,236 74,035,771 8,398,668 13,647,604 242,997,677 131,908,294 78,730,466 13,487,148 1,095,345,810 462,645,330Depreciation <strong>of</strong> Segmental assets 147,976,197 142,211,927 146,286,631 132,322,783 78,750,602 62,500,097 13,213,901 14,828,406 203,701,489 139,795,673 30,047,074 30,946,789 619,975,894 522,605,675Provision for Retiring Gratuity 16,980,668 27,036,184 20,439,834 17,716,476 10,478,536 2,482,932 8,671,927 7,752,987 1,070,405 1,074,676 7,912,469 8,708,452 65,553,839 64,771,707Amortisation/Impairment <strong>of</strong> Intangibles 6,793,904 5,863,844 - - 3,325,528 3,297,093 - - - - - - 10,119,432 9,160,937Annual Report 2010/11 <strong>Hemas</strong> <strong>Holdings</strong> PLC 97