Financial Statements, Statement of Directors - Hemas Holdings, Ltd
Financial Statements, Statement of Directors - Hemas Holdings, Ltd
Financial Statements, Statement of Directors - Hemas Holdings, Ltd
- No tags were found...
Create successful ePaper yourself
Turn your PDF publications into a flip-book with our unique Google optimized e-Paper software.
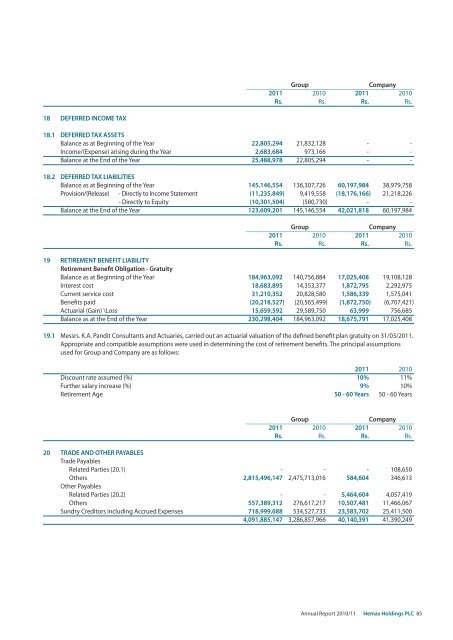
GroupCompany2011 2010 2011 2010Rs. Rs. Rs. Rs.18 DEFERRED INCOME TAX18.1 DEFERRED TAX ASSETSBalance as at Beginning <strong>of</strong> the Year 22,805,294 21,832,128 - -Income/(Expense) arising during the Year 2,683,684 973,166 - -Balance at the End <strong>of</strong> the Year 25,488,978 22,805,294 - -18.2 DEFERRED TAX LIABILITIESBalance as at Beginning <strong>of</strong> the Year 145,146,554 136,307,726 60,197,984 38,979,758Provision/(Release) - Directly to Income <strong>Statement</strong> (11,235,849) 9,419,558 (18,176,166) 21,218,226- Directly to Equity (10,301,504) (580,730) - -Balance at the End <strong>of</strong> the Year 123,609,201 145,146,554 42,021,818 60,197,984GroupCompany2011 2010 2011 2010Rs. Rs. Rs. Rs.19 RETIREMENT BENEFIT LIABILITYRetirement Benefit Obligation - GratuityBalance as at Beginning <strong>of</strong> the Year 184,963,092 140,756,884 17,025,408 19,108,128Interest cost 18,683,895 14,353,377 1,872,795 2,292,975Current service cost 31,210,352 20,828,580 1,586,339 1,575,041Benefits paid (20,218,527) (20,565,499) (1,872,750) (6,707,421)Actuarial (Gain) \Loss 15,659,592 29,589,750 63,999 756,685Balance as at the End <strong>of</strong> the Year 230,298,404 184,963,092 18,675,791 17,025,40819.1 Messrs. K.A. Pandit Consultants and Actuaries, carried out an actuarial valuation <strong>of</strong> the defined benefit plan gratuity on 31/03/2011.Appropriate and compatible assumptions were used in determining the cost <strong>of</strong> retirement benefits. The principal assumptionsused for Group and Company are as follows:2011 2010Discount rate assumed (%) 10% 11%Further salary increase (%) 9% 10%Retirement Age 50 - 60 Years 50 - 60 YearsGroupCompany2011 2010 2011 2010Rs. Rs. Rs. Rs.20 TRADE AND OTHER PAYABLESTrade PayablesRelated Parties (20.1) - - - 108,650Others 2,815,496,147 2,475,713,016 584,604 346,613Other PayablesRelated Parties (20.2) - - 5,464,604 4,057,419Others 557,389,312 276,617,217 10,507,481 11,466,067Sundry Creditors including Accrued Expenses 718,999,688 534,527,733 23,583,702 25,411,5004,091,885,147 3,286,857,966 40,140,391 41,390,249Annual Report 2010/11 <strong>Hemas</strong> <strong>Holdings</strong> PLC 85


