Financial Statements, Statement of Directors - Hemas Holdings, Ltd
Financial Statements, Statement of Directors - Hemas Holdings, Ltd
Financial Statements, Statement of Directors - Hemas Holdings, Ltd
- No tags were found...

You also want an ePaper? Increase the reach of your titles
YUMPU automatically turns print PDFs into web optimized ePapers that Google loves.
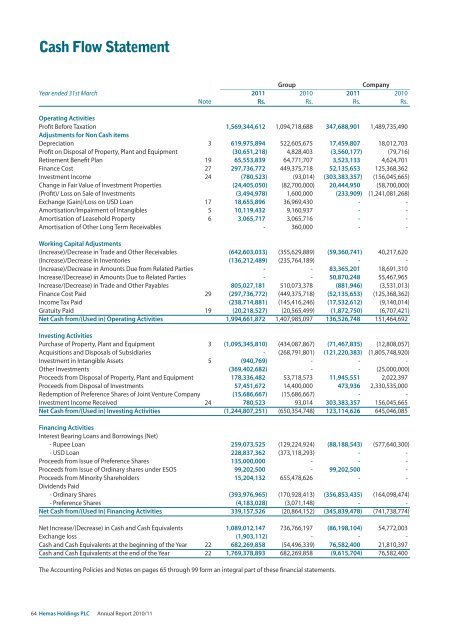
Cash Flow <strong>Statement</strong>GroupCompanyYear ended 31st March 2011 2010 2011 2010Note Rs. Rs. Rs. Rs.Operating ActivitiesPr<strong>of</strong>it Before Taxation 1,569,344,612 1,094,718,688 347,688,901 1,489,735,490Adjustments for Non Cash itemsDepreciation 3 619,975,894 522,605,675 17,459,807 18,012,703Pr<strong>of</strong>it on Disposal <strong>of</strong> Property, Plant and Equipment (30,651,218) 4,828,403 (3,560,177) (79,716)Retirement Benefit Plan 19 65,553,839 64,771,707 3,523,133 4,624,701Finance Cost 27 297,736,772 449,375,718 52,135,653 125,368,362Investment Income 24 (780,523) (93,014) (303,383,357) (156,045,665)Change in Fair Value <strong>of</strong> Investment Properties (24,405,050) (82,700,000) 20,444,950 (58,700,000)(Pr<strong>of</strong>it)/ Loss on Sale <strong>of</strong> Investments (3,494,978) 1,600,000 (233,909) (1,241,081,268)Exchange (Gain)/Loss on USD Loan 17 18,655,896 36,969,430 - -Amortisation/Impairment <strong>of</strong> Intangibles 5 10,119,432 9,160,937 - -Amortisation <strong>of</strong> Leasehold Property 6 3,065,717 3,065,716 - -Amortisation <strong>of</strong> Other Long Term Receivables - 360,000 - -Working Capital Adjustments(Increase)/Decrease in Trade and Other Receivables (642,603,033) (355,629,889) (59,360,741) 40,217,620(Increase)/Decrease in Inventories (136,212,489) (235,764,189) - -(Increase)/Decrease in Amounts Due from Related Parties - - 83,365,201 18,691,310Increase/(Decrease) in Amounts Due to Related Parties - - 50,870,248 55,467,965Increase/(Decrease) in Trade and Other Payables 805,027,181 510,073,378 (881,946) (3,531,013)Finance Cost Paid 29 (297,736,772) (449,375,718) (52,135,653) (125,368,362)Income Tax Paid (238,714,881) (145,416,246) (17,532,612) (9,140,014)Gratuity Paid 19 (20,218,527) (20,565,499) (1,872,750) (6,707,421)Net Cash from/(Used in) Operating Activities 1,994,661,872 1,407,985,097 136,526,748 151,464,692Investing ActivitiesPurchase <strong>of</strong> Property, Plant and Equipment 3 (1,095,345,810) (434,087,867) (71,467,835) (12,808,057)Acquisitions and Disposals <strong>of</strong> Subsidiaries - (268,791,801) (121,220,383) (1,805,748,920)Investment in Intangible Assets 5 (940,769) - - -Other Investments (369,402,682) - - (25,000,000)Proceeds from Disposal <strong>of</strong> Property, Plant and Equipment 178,336,482 53,718,573 11,945,551 2,022,397Proceeds from Disposal <strong>of</strong> Investments 57,451,672 14,400,000 473,936 2,330,535,000Redemption <strong>of</strong> Preference Shares <strong>of</strong> Joint Venture Company (15,686,667) (15,686,667) - -Investment Income Received 24 780,523 93,014 303,383,357 156,045,665Net Cash from/(Used in) Investing Activities (1,244,807,251) (650,354,748) 123,114,626 645,046,085Financing ActivitiesInterest Bearing Loans and Borrowings (Net)- Rupee Loan 259,073,525 (129,224,924) (88,188,543) (577,640,300)- USD Loan 228,837,362 (373,118,293) - -Proceeds from Issue <strong>of</strong> Preference Shares 135,000,000 - - -Proceeds from Issue <strong>of</strong> Ordinary shares under ESOS 99,202,500 - 99,202,500 -Proceeds from Minority Shareholders 15,204,132 655,478,626 - -Dividends Paid- Ordinary Shares (393,976,965) (170,928,413) (356,853,435) (164,098,474)- Preference Shares (4,183,028) (3,071,148) - -Net Cash from/(Used in) Financing Activities 339,157,526 (20,864,152) (345,839,478) (741,738,774)Net Increase/(Decrease) in Cash and Cash Equivalents 1,089,012,147 736,766,197 (86,198,104) 54,772,003Exchange loss (1,903,112) - - -Cash and Cash Equivalents at the beginning <strong>of</strong> the Year 22 682,269,858 (54,496,339) 76,582,400 21,810,397Cash and Cash Equivalents at the end <strong>of</strong> the Year 22 1,769,378,893 682,269,858 (9,615,704) 76,582,400The Accounting Policies and Notes on pages 65 through 99 form an integral part <strong>of</strong> these financial statements.64 <strong>Hemas</strong> <strong>Holdings</strong> PLC Annual Report 2010/11