Guidelines Dietary - Eat For Health
Guidelines Dietary - Eat For Health
Guidelines Dietary - Eat For Health
- No tags were found...

You also want an ePaper? Increase the reach of your titles
YUMPU automatically turns print PDFs into web optimized ePapers that Google loves.
EAT FOR HEALTHAustralian<strong>Dietary</strong><strong>Guidelines</strong>
EAT FOR HEALTHAustralian<strong>Dietary</strong> <strong>Guidelines</strong>Providing the scientific evidence forhealthier Australian diets2013
© Commonwealth of Australia 2013Paper-based publicationThis work is copyright. You may reproduce the whole or part of this work in unaltered form for your own personal use or, ifyou are part of an organisation, for internal use within your organisation, but only if you or your organisation do not use thereproduction for any commercial purpose and retain this copyright notice and all disclaimer notices as part of that reproduction.Apart from rights to use as permitted by the Copyright Act 1968 or allowed by this copyright notice, all other rights are reservedand you are not allowed to reproduce the whole or any part of this work in any way (electronic or otherwise) without first beinggiven the specific written permission from the Commonwealth to do so. Requests and enquiries concerning reproduction andrights are to be sent to Strategic Communications, National <strong>Health</strong> and Medical Research Council, GPO Box 1421, CanberraACT 2600 or via email to nhmrc.publications@nhmrc.gov.au.ISBN Print: 1864965746© Commonwealth of Australia 2013Electronic documentThis work is copyright. You may download, display, print and reproduce the whole or part of this work in unaltered form foryour own personal use or, if you are part of an organisation, for internal use within your organisation, but only if you or yourorganisation do not use the reproduction for any commercial purpose and retain this copyright notice and all disclaimer noticesas part of that reproduction. Apart from rights to use as permitted by the Copyright Act 1968 or allowed by this copyright notice,all other rights are reserved and you are not allowed to reproduce the whole or any part of this work in any way (electronic orotherwise) without first being given the specific written permission from the Commonwealth to do so. Requests and enquiriesconcerning reproduction and rights are to be sent to Strategic Communications, National <strong>Health</strong> and Medical Research Council,GPO Box 1421, Canberra ACT 2600 or via email to nhmrc.publications@nhmrc.gov.au.ISBN Online: 1864965754Suggested citationNational <strong>Health</strong> and Medical Research Council (2013) Australian <strong>Dietary</strong> <strong>Guidelines</strong>. Canberra: National <strong>Health</strong> and MedicalResearch Council.Council of NHMRC EndorsementThe <strong>Guidelines</strong> were considered by the Council on 30 November 2012 for recommendation to the CEO for issuing. The CEO waspleased to accept the Council’s advice and agreed to issue to guidelines under Section 7(1a) of the National <strong>Health</strong> and MedicalResearch Council Act 1992.DisclaimerThis document is a general guide to appropriate practice, to be followed subject to the clinician’s judgement and patient’spreference in each individual case.The guideline is designed to provide information to assist decision-making and is based on the best available evidence at thetime of development of this publication.To obtain information regarding NHMRC publications contact:Email: nhmrc.publications@nhmrc.gov.auPhone: Toll free 13 000 NHMRC (13 000 64672) or call (02) 6217 9000Internet: http://www.nhmrc.gov.auNHMRC Publication reference: N55Published: February 2013
PrefaceNever in our nation’s history have Australians had such a wide variety of dietary options. Yet the rising incidenceof obesity and type 2 diabetes in our population is evidence of the need for Australians to improve their health bymaking better dietary decisions.There are many ways for Australians to choose foods that promote their health and wellbeing while reducing theirrisk of chronic disease. NHMRC‘s Australian <strong>Dietary</strong> <strong>Guidelines</strong> provide recommendations for healthy eating thatare realistic, practical, and – most importantly – based on the best available scientific evidence.These <strong>Guidelines</strong> are an evolution of the 2003 edition of the dietary guidelines, integrating updates of the <strong>Dietary</strong><strong>Guidelines</strong> for Older Australians (1999), the <strong>Dietary</strong> <strong>Guidelines</strong> for Adults (2003) and the <strong>Dietary</strong> <strong>Guidelines</strong>for Children and Adolescents in Australia (2003). They also include an update of the Australian Guide to <strong>Health</strong>y<strong>Eat</strong>ing (1998).Providing the recommendations and the evidence that underpins them in a single volume, the <strong>Guidelines</strong> willhelp health professionals, policy makers and the Australian public cut through the background noise of ubiquitousdietary advice that is often based on scant scientific evidence. They form a bridge between research and evidencebasedadvice to address the major health challenge of improving Australians’ eating patterns.The evidence for public health advice should be the best available. NHMRC is confident that the available evidenceunderpinning these guidelines meets that criterion and is stronger than for any previous NHMRC dietary guideline.Choice of food in Australia has become more complex as we have become a more diverse society, and manyAustralians take into account issues such as environmental concerns or cultural priorities in making their choices.We hope that these <strong>Guidelines</strong> act as a firm basis upon which these individual decisions may be made.<strong>For</strong> more than 75 years the Australian Government, primarily through NHMRC and Australian Government healthdepartments, has provided nutrition advice to the public through food and nutrition policies, dietary guidelines andnational food selection guides.NHMRC and all involved in developing these <strong>Guidelines</strong> are proud and privileged to have the responsibility tocontinue this important public service.Professor Warwick Anderson AMChief Executive OfficerNational <strong>Health</strong> and Medical Research CouncilFebruary 2013PrefaceNational <strong>Health</strong> and Medical Research Counciliii
Australian <strong>Dietary</strong> <strong>Guidelines</strong>Guideline 1To achieve and maintain a healthy weight, be physically active and choose amounts ofnutritious food and drinks to meet your energy needs.• Children and adolescents should eat sufficient nutritious foods to grow and developnormally. They should be physically active every day and their growth should bechecked regularly.• Older people should eat nutritious foods and keep physically active to help maintainmuscle strength and a healthy weight..Guideline 2Enjoy a wide variety of nutritious foods from these five groups every day:• Plenty of vegetables, including different types and colours, and legumes/beans• Fruit• Grain (cereal) foods, mostly wholegrain and/or high cereal fibre varieties, such asbreads, cereals, rice, pasta, noodles, polenta, couscous, oats, quinoa and barley• Lean meats and poultry, fish, eggs, tofu, nuts and seeds, and legumes/beans• Milk, yoghurt, cheese and/or their alternatives, mostly reduced fat (reduced fatmilks are not suitable for children under the age of 2 years)And drink plenty of water.Guideline 3Limit intake of foods containing saturated fat, added salt, added sugars and alcohol.a. Limit intake of foods high in saturated fat such as many biscuits, cakes, pastries,pies, processed meats, commercial burgers, pizza, fried foods, potato chips,crisps and other savoury snacks.• Replace high fat foods which contain predominantly saturated fats such asbutter, cream, cooking margarine, coconut and palm oil with foods whichcontain predominantly polyunsaturated and monounsaturated fats such as oils,spreads, nut butters/pastes and avocado.• Low fat diets are not suitable for children under the age of 2 years.b. Limit intake of foods and drinks containing added salt.• Read labels to choose lower sodium options among similar foods.• Do not add salt to foods in cooking or at the table.c. Limit intake of foods and drinks containing added sugars such as confectionary,sugar-sweetened soft drinks and cordials, fruit drinks, vitamin waters, energy andsports drinks.d. If you choose to drink alcohol, limit intake. <strong>For</strong> women who are pregnant, planninga pregnancy or breastfeeding, not drinking alcohol is the safest option.Guideline 4Encourage, support and promote breastfeeding.Guideline 5Care for your food; prepare and store it safely.Australian <strong>Dietary</strong> <strong>Guidelines</strong>National <strong>Health</strong> and Medical Research Councilv
ContentsPrefaceAustralian <strong>Dietary</strong> <strong>Guidelines</strong>iiivIntroduction 1Why the <strong>Guidelines</strong> matter 1Scope and target audience 2Companion documents 3How the <strong>Guidelines</strong> were developed 5Five key evidence sources for the <strong>Guidelines</strong> 5How the evidence was used 7Challenges for adoption of the <strong>Guidelines</strong> 8How to use the <strong>Guidelines</strong> 9Guideline 1• Achieve and maintain a healthy weight 111.1 Setting the scene 121.1.1 Weight status and trends in Australia 121.1.2 <strong>Health</strong> effects associated with weight status 131.1.3 Causes of overweight and obesity in the population 141.1.4 Physical activity 171.2 The evidence for ‘achieve and maintain a healthy weight’ 181.2.1 Primary and secondary prevention 191.2.2 <strong>Dietary</strong> patterns and specific foods and drinks 191.3 How dietary patterns can affect energy balance and weight outcomes 221.4 Practical considerations: achieve and maintain a healthy weight 221.4.1 Physical activity and dietary patterns in achieving and maintaining a healthy weight 231.4.2 Weight loss in adults who are overweight 241.4.3 Pregnant and breastfeeding women 241.4.4 Infants, children and adolescents 261.4.5 Older people 271.4.6 Aboriginal and Torres Strait Islander peoples 271.4.7 Australians of Asian origin 281.4.8 People with eating disorders 281.5 Practice guide for Guideline 1 29ContentsNational <strong>Health</strong> and Medical Research Councilvii
GUIDELINE 2• Enjoy a wide variety of nutritious foods 312.1 Enjoy a wide variety of nutritious foods 322.1.1 Setting the scene 322.1.2 The evidence for consuming ‘a wide variety of nutritious foods’ 322.1.3 How consuming a wide variety of nutritious foods may improve health outcomes 332.1.4 Practical considerations: enjoy a wide variety of nutritious foods 332.2 Enjoy plenty of vegetables, including different types and colours,and legumes/beans, and enjoy fruit 362.2.1 Setting the scene 362.2.2 The evidence for consuming ‘plenty of vegetables’ 362.2.3 The evidence for consuming ‘plenty of legumes/beans’ 382.2.4 The evidence for consuming ‘fruit’ 392.2.5 How consuming plenty of vegetables, including different types and colours, andlegumes/beans, and fruit may improve health outcomes 402.2.6 Practical considerations: enjoy plenty of vegetables, including different types andcolours, legumes/beans, and enjoy fruit 422.3 Enjoy grain (cereal) foods, mostly wholegrain and/or high cereal fibre varieties 442.3.1 Setting the scene 442.3.2 The evidence for consuming ‘grain (cereal) foods, mostly wholegrain and/or high cerealfibre varieties’ 452.3.3 How consuming grain (cereal) foods, mostly wholegrain and/or high cereal fibre varietiesmay improve health outcomes 462.3.4 Practical considerations: enjoy grain (cereal) foods, mostly wholegrain and/or high cerealfibre varieties 462.4 Enjoy lean meats and poultry, fish, eggs, tofu, nuts and seeds,and legumes/beans 482.4.1 Setting the scene 482.4.2 The evidence for consuming ‘lean meats and poultry, fish, eggs, tofu, nuts and seeds,and legumes/beans’ 492.4.3 How consuming lean meats and poultry, fish, eggs, tofu, nuts and seeds, and legumes/beansmay improve health outcomes 522.4.4 Practical considerations: enjoy lean meats and poultry, fish, eggs, tofu, nuts and seeds,and legumes/beans 522.5 Enjoy milk, yoghurt, cheese and/or alternatives, mostly reduced fat 562.5.1 Setting the scene 562.5.2 The evidence for consuming ‘milk, yoghurt, cheese and/or alternatives, mostly reduced fat’ 562.5.3 How consuming milk, yoghurt, cheese and/or alternatives, mostly reduced fat, may improvehealth outcomes 582.5.4 Practical considerations: enjoy milk, yoghurt, cheese and/or alternatives, mostly reduced fat 582.6 Drink plenty of water 612.6.1 Setting the scene 612.6.2 The evidence for ‘drink plenty of water’ 612.6.3 How drinking plenty of water may improve health outcomes 632.6.4 Practical considerations: drink plenty of water 632.7 Practice guide for Guideline 2 64viiiEAT FOR HEALTH – australian dietary guidelinesNational <strong>Health</strong> and Medical Research Council
GUIDELINE 3• Limit intake of foods containing saturated fat, added salt,added sugars and alcohol 673.1 Limit intake of foods high in saturated fat 683.1.1 Setting the scene 683.1.2 The evidence for ‘limit intake of foods high in saturated fat’ 693.1.3 How limiting intake of foods high in saturated fat may improve health outcomes 713.1.4 Practical considerations: limit intake of foods high in saturated fat 713.2 Limit intake of foods and drinks containing added salt 733.2.1 Setting the scene 733.2.2 The evidence for ‘limit intake of foods and drinks containing added salt’ 743.2.3 How limiting intake of foods and drinks containing added salt may improve health outcomes 753.2.4 Practical considerations: Limit intake of foods and drinks containing added salt 753.3 Limit intake of foods and drinks containing added sugars 763.3.1 Setting the scene 763.3.2 The evidence for ‘limit intake of foods and drinks containing added sugars’ 773.3.3 How limiting intake of foods and drinks containing added sugars may improve health outcomes 783.3.4 Practical considerations: limit intake of foods and drinks containing added sugars 793.4 Limit intake of alcohol 803.4.1 Setting the scene 803.4.2 The evidence for ‘limit intake of alcohol’ 813.4.3 How limiting intake of alcohol may improve health outcomes 833.4.4 Practical considerations: limit intake of alcohol 833.5 Practice guide for Guideline 3 85GUIDELINE 4• Encourage, support and promote breastfeeding 874.1 Setting the scene 884.2 The evidence for ‘encourage, support and promote breastfeeding’ 894.2.1 Breastfeeding incidence and duration 904.2.2 Infant growth 914.2.3 Cardiovascular disease and excess weight 924.2.4 Other benefits 924.3 Practical considerations: encourage, support and promote breastfeeding 934.3.1 Breastfeeding initiation and duration 934.3.2 Supporting and promoting breastfeeding 944.3.3 Safe storage of breast milk 954.3.4 Alcohol and breastfeeding 954.3.5 When an infant is not receiving breast milk 954.4 Practice guide for Guideline 4 96ContentsNational <strong>Health</strong> and Medical Research Councilix
guideline 5• Food safety 975.1 Setting the scene 985.2 The evidence for ‘care for your food; prepare and store it safely’ 985.2.1 Foods that may cause problems if not handled correctly 985.3 Why it is important to prepare and store food safely 995.4 Practical considerations: care for your food; prepare and store it safely 995.4.1 Pregnant and breastfeeding women 995.4.2 Infants 1005.4.3 Adults with illness 1005.4.4 Older people 1005.5 Practice guide for Guideline 5 100AppendicesA Equity and the social determinants of health and nutrition status 101B Process report 109C History and timeline of Australian nutrition documents 117D Questions for the literature review to underpin the revision of thedietary guidelines 120E Summary of evidence statements of negative associations and thoseof Grade D 124F Evidence gradings used in the World Cancer Research Fund report 127G Food, nutrition and environmental sustainability 130H Assessing growth and healthy weight in infants, children and adolescents,and healthy weight in adults 135I Physical activity guidelines 138J Studies examining the health effects of intake of fruit and vegetables together 140K Alcohol and energy intake 142Glossary 143Acronyms and abbreviations 151References 153xEAT FOR HEALTH – australian dietary guidelinesNational <strong>Health</strong> and Medical Research Council
List of tablesTable 1.1: Evidence statements on ‘achieve and maintain a healthy weight’ 18Table 1.2: 2010 Institute of Medicine recommendations for total and rate of weight gainduring pregnancy, by pre-pregnancy BMI 25Table 1.3: Weight gain during pregnancy: recommendations for Asian women, by pre-pregnancy BMI 25Table 1.4: Summary of practical considerations for Guideline 1 29Table 2.1: Evidence statements for consuming ‘a wide variety of nutritious foods’ 33Table 2.2: Evidence statements for consuming ‘plenty of vegetables’ 37Table 2.3: Evidence statements for consuming ‘plenty of legumes/beans’ 38Table 2.4: Evidence statements for consuming ‘fruit’ 39Table 2.5: Minimum recommended number of serves of vegetables, legumes/beans and fruit per day 42Table 2.6: Standard serve size equivalents for vegetables, legumes/beans and fruit 43Table 2.7: Evidence statements for consuming ‘grain (cereal) foods, mostly wholegrain and/orhigh cereal fibre varieties’ 45Table 2.8: Minimum recommended number of serves of grain (cereal) foods per day, mostly wholegrainand/or high cereal fibre varieties 47Table 2.9: Standard serve size equivalents for grain (cereal) mostly wholegrain and/or high cerealfibre varieties 47Table 2.10: Evidence statements for consuming ‘lean meats and poultry, fish, eggs, tofu, nuts andseeds, and legumes/beans’ 49Table 2.11: Minimum recommended number of serves of lean meats, poultry, fish, eggs, tofu, nutsand seeds, and legumes/beans per day 53Table 2.12: Standard serve size equivalents for lean meats, poultry, fish, eggs, tofu, nuts and seeds,and legumes/beans 53Table 2.13: Evidence statements for consuming ‘milk, yoghurt, cheese and/or alternatives, mostlyreduced fat’ 56Table 2.14: Minimum recommended number of serves of milk, yoghurt, cheese and/or alternativesper day, mostly reduced fat 59Table 2.15: Standard serve size equivalents for milk, yoghurt, cheese and/or alternatives, mostlyreduced fat 59Table 2.16: Evidence statements for ‘drink plenty of water’ 61Table 2.17: Considerations in advising people from specific groups to consume a wide variety of foods 64Table 3.1: Evidence statements for ‘limit intake of foods high in saturated fat’ 69Table 3.2: Recommended allowance for number of serves of unsaturated spreads and oils per day 72Table 3.3: Standard serve size equivalents of unsaturated spreads and oils 72Table 3.4: Evidence statements for ‘limit intake of foods and drinks containing added salt’ 74Table 3.5: Evidence statements for ‘limit intake of foods and drinks containing added sugars’ 77Table 3.6: Evidence statements for ‘limit intake of alcohol’ 81Table 3.7: Considerations in advising people from specific groups to limit intake of foods containingsaturated fat, added salt, added sugars and alcohol 85Table 4.1: Evidence statements for ‘encouraging, supporting and promoting breastfeeding’ 89Table 4.2: Factors associated with duration of exclusive breastfeeding 91Table 4.3: Considerations in encouraging, supporting and promoting breastfeeding 96Table 5.1: Considerations in providing advice on food safety to people from specific groups 100Table A1: Mean daily intakes (g/day) of various food groups, people aged 19 years and over,by SEIFA quintile 103ContentsNational <strong>Health</strong> and Medical Research Councilxi
Table A2: Mean daily intakes of energy and nutrient densities, adults aged 19 years and over,by SEIFA quintile 104Table B1: Terms of reference of the <strong>Dietary</strong> <strong>Guidelines</strong> Working Committee 109Table B2: Members of the Working Committee 110Table B3: Levels of evidence in the literature review 112Table E1: Grade C ‘no association’ relationships that informed the Australian <strong>Dietary</strong> <strong>Guidelines</strong> 124Table E2: Evidence statements (Grade D) that did not inform the Australian <strong>Dietary</strong> <strong>Guidelines</strong> 125Table H1: Practical points in the use of growth reference charts in infants aged 0–2 years 136Table H2: WHO body mass index classification 137Table K1: Median percentage of contribution of alcohol to energy intake per consumer 142Table K2: Energy and alcohol content of common alcoholic drink serves 142List of figuresFigure 1.1: Mean energy intakes of adults: 1983 and 1995 15Figure 1.2: Mean energy intakes of children aged 10–15 years: 1985 and 1995 16Figure 1.3: Mean consumption of selected food groups by boys aged 10–15 years: 1985 and 1995 17Figure G1: Examples of environmental consequences within the food system 132xiiEAT FOR HEALTH – australian dietary guidelinesNational <strong>Health</strong> and Medical Research Council
IntroductionWhy the <strong>Guidelines</strong> matterThere are many ways for Australians to achieve dietary patterns that promote health and wellbeing and reduce therisk of chronic disease. Diet is arguably the single most important behavioural risk factor that can be improved tohave a significant impact on health. 1,2 As the quality and quantity of foods and drinks consumed has a significantimpact on the health and wellbeing of individuals, society and the environment, better nutrition has hugepotential to improve individual and public health and decrease healthcare costs. Optimum nutrition is essentialfor the normal growth and physical and cognitive development of infants and children. In all Australians, nutritioncontributes significantly to healthy weight, quality of life and wellbeing, resistance to infection, and protectionagainst chronic disease and premature death.Suboptimal nutrition is associated with ill health. Many diet-related chronic diseases such as cardiovasculardisease, type 2 diabetes and some forms of cancer are major causes of death and disability among Australians. 3More than one-third of all premature deaths in Australia are the result of chronic diseases that could havebeen prevented. 3 Many of these are mediated by overweight and obesity. The prevalence of type 2 diabetes isincreasing and is expected to become Australia’s leading cause of disease burden by 2023. Cancer is Australia’sleading broad cause of disease burden (19%), followed by CVD (16%). 3 The most recent available estimate forthe total cost of poor nutrition was more than $5 billion per year, based on 1990 costings. 4 Given that the cost ofobesity alone was estimated to be $8.283 billion per year in 2008, 5 the current cost of poor nutrition in Australiais now likely to greatly exceed the 1990 estimates.Most of the burden of disease due to poor nutrition in Australia is associated with excess intake of energy-denseand relatively nutrient-poor foods high in energy, saturated fat, added or refined sugars or salt, and/or inadequateintake of nutrient-dense foods, including vegetables, fruit and wholegrain cereals. 2,6 Deficiency in some nutrientssuch as iodine, folate, 7 iron and vitamin D is also a concern for some Australians. 8,9Overconsumption of some foods and drinks, leading to excess energy intake and consequent increases inadiposity, is now a key public health problem for Australia. 6,10 The prevalence of overweight and obesity hasincreased dramatically over the past 30 years and is now around 60% in adults 11 and 25% in children andadolescents. 11,12These <strong>Guidelines</strong> summarise the evidence underlying food, diet and health relationships that improve publichealth outcomes.<strong>Dietary</strong> patterns consistent with the <strong>Guidelines</strong> improve healthRecent reviews of the evidence on food and health confirm that dietary patterns consistent with the <strong>Guidelines</strong>are positively associated with indicators of health and wellbeing.Two systematic reviews found that higher dietary quality was consistently associated with a 10–20% reductionin morbidity. <strong>For</strong> example, there is evidence of a probable association between a Mediterranean dietary patternand reduced mortality (Grade B; Evidence Report, Section 20.1). 13-15 Previous studies have also indicated inverseassociations between plant-based or vegetarian diets and all-cause and cardiovascular mortality, particularlyamong older adults. 16-18 The effects of dietary quality tended to be greater for men than women, with commondeterminants being age, education and socioeconomic status. 19,20There is likely to be great variation in the interpretation and implementation of dietary guidelines. Nevertheless,when a wide range of eating patterns was assessed for compliance with different guidelines using a variety ofqualitative tools, the assessment suggested an association between adherence to national dietary guidelines andrecommendations, and reduced morbidity and mortality (Grade C; Evidence Report, Section 20.3). 19,20IntroductionNational <strong>Health</strong> and Medical Research Council1
More recent evidence from Western societies confirms that dietary patterns consistent with guidelinesrecommending relatively high amounts of vegetables, fruit, whole grains, poultry, fish, and reduced fat milk,yoghurt and cheese products may be associated with superior nutritional status, quality of life and survival inolder adults. 21,22 Robust modelling of dietary patterns in accordance with dietary guidelines has demonstratedachievable reductions in predicted cardiovascular and cancer disease mortality in the population, particularly withincreased consumption of fruit and vegetables. 23In relation to obesity, dietary advice and measures of compliance and weight outcomes vary greatly in publishedstudies. Overall energy intake is the key dietary factor affecting weight status (see Chapter 1).Social determinants of food choices and health are important considerationsLife expectancy and health status are relatively high overall in Australia. 11,24 Nonetheless, there are differences inhealth and wellbeing between Australians, including rates of death and disease, life expectancy, self-perceivedhealth, health behaviours, health risk factors, and use of health services. 25-27The causes of health inequities are largely outside the health system and relate to the inequitable distribution ofsocial, economic and cultural resources and opportunities. 25-27 Employment, income, education, cultural influencesand lifestyle, language, sex and other genetic differences, isolation (geographic, social or cultural), age anddisability, the security and standard of accommodation, and the availability of facilities and services, all interactwith diet, health and nutritional status. 25,26 Conversely, a person’s poor health status can contribute to socialisolation and limit his or her ability to gain employment or education and earn an income, which can in turnhave a negative impact on health determinants such as quality and stability of housing.Social determinants of health and nutrition status are important considerations for users of these <strong>Guidelines</strong>,particularly when giving advice to individuals or groups in the community. Australians who are at greater risk ofdiet-mediated poor health include the very young, the very old, those living in remote areas, Aboriginal and TorresStrait Islander peoples, people from culturally and linguistically diverse groups and those in lower socioeconomicgroups. 25-30 The <strong>Guidelines</strong> address some of the issues faced by these population groups, in the ‘Practicalconsiderations’ section for each Guideline. Further discussion of social determinants of food choices and healthis included in Appendix A.Scope and target audienceThe <strong>Guidelines</strong>, together with the underlying evidence base, provide guidance on foods, food groups and dietarypatterns that protect against chronic disease and provide the nutrients required for optimal health and wellbeing(see Appendix B for further information on how the <strong>Guidelines</strong> were developed). They are important tools thatsupport broader strategies to improve nutrition outcomes in Australia, as highlighted in <strong>Eat</strong> well Australia:An agenda for action in public health nutrition, 2000–2010. 2 They are consistent with the most recent AustralianFood and Nutrition Policy 1992 31 in considering health, wellbeing, equity and the environment. A brief history ofthe development of Australian nutrition documents and resources is included in Appendix C.The <strong>Guidelines</strong> apply to all healthy AustraliansThe <strong>Guidelines</strong> aim to promote the benefits of healthy eating, not only to reduce the risk of diet-related diseasebut also to improve community health and wellbeing. The <strong>Guidelines</strong> are intended for people of all ages andbackgrounds in the general healthy population, including people with common diet-related risk factors such asbeing overweight.The <strong>Guidelines</strong> do not apply to people with medical conditions requiring specialised dietary advice,or to frail elderly people who are at risk of malnutrition.2EAT FOR HEALTH – australian dietary guidelinesNational <strong>Health</strong> and Medical Research Council
The <strong>Guidelines</strong> are based on whole foodsFoods exert certain health effects because of the nutrients they contain. As such, dietary recommendations areoften couched in terms of individual nutrients (such as requirements of vitamins and minerals). However, peopleeat whole foods rather than single nutrients, so such advice can be difficult to put into practice. <strong>For</strong> this reason,these <strong>Guidelines</strong> make recommendations based only on whole foods, such as vegetables and meats, ratherthan recommendations related to specific food components and individual nutrients.This practical approach makes the recommendations easier to apply. <strong>Dietary</strong> patterns consistent with the<strong>Guidelines</strong> will allow the general population to meet nutrient requirements, although some subpopulationsmay have some increased nutrient requirements that are more difficult to meet through diet alone andsupplementation may be required. This is noted in the ‘Practical considerations’ sections.Regulation of the food supply, such as fortification, use of food additives or special dietary products, is dealtwith by Food Standards Australia New Zealand (FSANZ) (see www.foodstandards.gov.au).Target audience for the <strong>Guidelines</strong>The target audience for the <strong>Guidelines</strong> comprises health professionals (including dietitians, nutritionists, generalpractitioners (GPs), nurses and lactation consultants), educators, government policy makers, the food industryand other interested parties.Companion documentsThe <strong>Guidelines</strong> form part of a suite of resources on nutrition and dietary guidance. Other documents in thesuite include the following:• Nutrient Reference Values for Australia and New Zealand (NRV Document) – This details quantitative nutrientreference values (NRVs) for different ages and genders. The NRVs detail the recommended amounts ofmacronutrients and micronutrients required to avoid deficiency, toxicity and chronic disease. As anexample, the NRV Document would be the reference for finding out how much iron is needed by womenaged between 19 and 30 years.• A modelling system to inform the revision of the Australian Guide to <strong>Health</strong>y <strong>Eat</strong>ing (Food ModellingSystem) – This describes a range of computer-generated diets that translate the NRVs into dietary patternsto describe some types, combinations and amounts of foods that can deliver nutrient requirements foreach age and gender group of different height and activity levels in the Australian population. A range ofmodels including omnivore, lacto-ovo vegetarian, pasta and rice-based dietary patterns were developed,and primarily omnivorous dietary patterns were used to inform the Australian Guide to <strong>Health</strong>y <strong>Eat</strong>ing andcompanion resources.• A review of the evidence to address targeted questions to inform the revision of the Australian <strong>Dietary</strong><strong>Guidelines</strong> (Evidence Report) – This is a systematic approach to literature review relevant to targetedquestions published in the peer-reviewed nutrition literature from 2002–2009. As an example, the EvidenceReport would be the reference for looking at the evidence for a particular evidence statement included inthese <strong>Guidelines</strong>.• Infant Feeding <strong>Guidelines</strong> – This document aims to support optimum infant nutrition by providing health workerswith a review of the evidence, and clear evidence-based recommendations on infant feeding.It is relevant to healthy, term infants of normal birth weight (>2,500g).• Australian Guide to <strong>Health</strong>y <strong>Eat</strong>ing – This is the food selection tool (see page 10) which reflects dietarypatterns divided into portions from the five food groups – fruit, vegetables, grains, milk, yoghurt andcheese products and lean meats (or alternatives), representing the proportion of these food groupsrequired each day.• Companion resources – These include an interactive website, summary booklets, brochures and postersfor health professionals and consumers.All of these documents are available on the internet at www.eatforhealth.gov.au.IntroductionNational <strong>Health</strong> and Medical Research Council3
Relationship between the documents in the <strong>Eat</strong> for <strong>Health</strong> program<strong>Eat</strong> for <strong>Health</strong> Programwww.eatforhealth.gov.auEvidence products• A Review of the Evidence to Address Targeted Questions to Inform the Revision of theAustralian <strong>Dietary</strong> <strong>Guidelines</strong> (2011)• A Modelling System to Inform the Revision of the Australian Guide to <strong>Health</strong>y <strong>Eat</strong>ing (2011)• Review: Nutritional Requirements and <strong>Dietary</strong> Advice Targeted for Pregnant andBreastfeeding Women (2013)• Infant Feeding <strong>Guidelines</strong> Literature Review (2012)• 2003 edition of the <strong>Dietary</strong> <strong>Guidelines</strong> (rescinded)<strong>Guidelines</strong>• Australian <strong>Dietary</strong> <strong>Guidelines</strong> (2013)• Infant Feeding <strong>Guidelines</strong> (2012)<strong>Health</strong> professional resources• Australian <strong>Dietary</strong> <strong>Guidelines</strong>• Infant Feeding <strong>Guidelines</strong>• Australian Guide to <strong>Health</strong>y <strong>Eat</strong>ing (Food Modelling Tool)• Educator Guide• Summary booklet for the Australian <strong>Dietary</strong> <strong>Guidelines</strong>• Summary booklet for the Infant Feeding <strong>Guidelines</strong>• Brochures for infants, children, pregnant women and adults• Posters• Interactive web tools• <strong>Health</strong>y eating information such as fact pages and tipsConsumer resources• Australian Guide to <strong>Health</strong>y <strong>Eat</strong>ing (Food Modelling Tool)• Summary booklet for the Australian <strong>Dietary</strong> <strong>Guidelines</strong>• Brochures for infants, children, pregnant women and adults• Posters• Interactive web tools• <strong>Health</strong>y eating information such as fact pages and tips4EAT FOR HEALTH – australian dietary guidelinesNational <strong>Health</strong> and Medical Research Council
How the <strong>Guidelines</strong> were developedThese <strong>Guidelines</strong> are an evolution of the 2003 edition of the dietary guidelines and build upon their evidence andscience base. New evidence was assessed to determine whether associations between food, dietary patternsand health outcomes had strengthened, weakened, or remained unchanged. Where the evidence base wasunlikely to have changed substantially (e.g. the relationship between intake of foods high in saturated fat andincreased risk of high serum cholesterol) additional review was not conducted.The methods used to analyse the evidence were in accordance with international best practice. 32,33 The mainmethods are summarised below and given in more detail in Appendix B.The <strong>Guidelines</strong> were further informed by substantial advances in the methodology for guideline development anduseability since publication of the previous edition of the dietary guidelines.Human feeding studies and clinical trials provide direct evidence of the impact of food consumption on physiologicalresponses and disease biomarkers. Although the breadth and depth of knowledge generated from these kinds ofstudies is uneven, a consistent alignment of results with plausible mechanisms adds confidence to the analysis ofall studies combined.Five key evidence sources for the <strong>Guidelines</strong>In developing the <strong>Guidelines</strong>, NHMRC drew upon the following key sources of evidence:• the previous series of dietary guidelines and their supporting documentation 34-36• the Evidence Report 33• the NRV Document 8• the Food Modelling System 9• key authoritative government reports and additional literature (including a commissioned review on pregnantand breastfeeding women). 37Evidence Report – answers to key questions in the research literatureThe NHMRC commissioned a literature review to answer targeted questions on food, diet and disease/healthrelationships covering the period 2002–2009. This addressed specific questions developed by the expert <strong>Dietary</strong><strong>Guidelines</strong> Working Committee (the Working Committee), where evidence might have changed since the 2003edition of the dietary guidelines was developed (see Appendix D). 38The NHMRC followed critical appraisal processes to ensure rigorous application of the review methodology. 32,39Data were extracted from included studies and assessed for strength of evidence, size of effect and relevance ofevidence according to standardised NHMRC processes. 32,40-42 The components of the body of evidence – evidencebase (quantity, level and quality of evidence); consistency of the study results; clinical impact; generalisability; andapplicability to the Australian context – were rated as excellent, good, satisfactory or poor according to standardNHMRC protocols. 38,42The reviewers then summarised the evidence into draft body of evidence statements. The Working Committeeadvised that a minimum of five high quality studies was required before a graded evidence statement could bemade. The individual studies in meta-analyses were considered as separate studies. The evidence statementswere graded A to D according to standard NHMRC protocols: 42• Grade A (convincing association) indicates that the body of evidence can be trusted to guide practice• Grade B (probable association) indicates that the body of evidence can be trusted to guide practice inmost situations• Grade C (suggestive association) indicates that the body of evidence provides some support for therecommendations but care should be taken in its application• Grade D indicates that the body of evidence is weak and any recommendation must be applied with caution.Once the evidence statements had been drafted and graded, NHMRC commissioned an external methodologistto ensure that review activities had been undertaken in a transparent, accurate, consistent and unbiased manner.This was to ensure that the work could be double-checked easily by other experts in nutrition research.IntroductionNational <strong>Health</strong> and Medical Research Council5
In this way, the Evidence Report was used to develop the graded evidence statements included in these <strong>Guidelines</strong>.It is important to note that these grades relate to individual diet-disease relationships only – the <strong>Guidelines</strong> summariseevidence from a number of sources and across a number of health/disease outcomes.Levels of evidence in public health nutritionRandomised controlled trials provide the highest level of evidence regarding the effects of dietary intake on health.However, as with many public health interventions, changing the diets of individuals raises ethical, logistical andeconomic challenges. This is particularly the case in conducting randomised controlled trials to test the effects ofexposure to various types of foods and dietary patterns on the development of lifestyle-related disease.Lifestyle-related diseases generally do not develop in response to short-term dietary changes; however short-termstudies enable biomarkers of disease to be used to evaluate the effects of particular dietary patterns. The questionof how long dietary exposure should occur to demonstrate effects on disease prevention is subject to much debate.While it may be possible to conduct a dietary intervention study for 12 months or more to examine intermediateeffects, there would be many ethical and practical barriers to conducting much longer, or indeed, lifelong, randomisedcontrolled trials with dietary manipulation to examine disease prevention.As a result, evidence in the nutrition literature tends to be based on longer term observational studies, leadingto a majority of Grade C evidence statements, with some reaching Grade B, where several quality studies withminimal risk of bias have been conducted. <strong>For</strong> shorter term and intermediary effects, particularly when studyingexposure to nutrients and food components rather than dietary patterns, Grade A is possible.The relatively high proportion of evidence statements assessed as Grade C should not be interpreted as suggestinglack of evidence to help guide practice. However, care should still be applied in applying this evidence for specificdiet-disease relationships, particularly at the individual level. 32,39<strong>Health</strong> professionals and the public can be assured that the process of assessing the scientific evidence providesfor the best possible advice. Only evidence statements graded A, B, or C influenced the development ofthese <strong>Guidelines</strong>.Grade D evidence statementsGrade D evidence statements occur when the evidence for a food-diet-health relationship is limited, inconclusiveor contradictory. These D-grade relationships were not used to inform the development of <strong>Guidelines</strong> statements,but can be useful to inform health professionals about the strength of evidence from recent research. The full setof Grade D evidence statements can be found in the Evidence Report 33 and is summarised in Appendix E.Food Modelling System – translating nutrient requirements into dietary patternsThe Food Modelling System was commissioned by the NHMRC between 2008 and 2010. It determines a rangeof combinations of amounts and types of foods that can be consumed to meet nutritional needs with the leastamount of energy for the smallest and least active people within an age and sex group. The modelling applies theNRV Document 8 to meet all NRVs within energy requirements for all groups, including acceptable macronutrientdistribution ranges and suggested dietary targets for all nutrients, with the exception of meeting the high ironrequirements of pregnant girls and women and meeting vitamin D requirements (this is a special case asvitamin D is also produced in the body by the action of sunlight on the skin).The resultant dietary models – Foundation Diets and Total Diets – demonstrate that while nutritional needs aremet through the whole diet and not by single foods, the combination of foods is critical. The models are realisticand flexible in providing information on the serve sizes and minimum recommended number of daily servesrequired for each population group to achieve the required intake of vitamins, minerals and macronutrients.Several processes contributed to the development of this report, including consultation processes arranged byNHMRC and a public consultation of the draft report in April/May 2010, after which the models were finalised.The Food Modelling System informed the revision of the Australian Guide to <strong>Health</strong>y <strong>Eat</strong>ing and companionresources and was considered together with other sources of evidence to determine the recommendations inthese <strong>Guidelines</strong>.6EAT FOR HEALTH – australian dietary guidelinesNational <strong>Health</strong> and Medical Research Council
Capturing new evidenceNutrition research is continuously evolving and studies are published regularly. Relevant results from high qualitystudies (primarily systematic reviews) assessing food, diet and health relationships that were published afterthe literature review for the Evidence Report (i.e. after 2009) were also considered in the development of the<strong>Guidelines</strong>. While results from these studies were not graded, and did not influence the evidence statements,they were included in the <strong>Guidelines</strong> and were deemed warranted to ensure currency.As the Evidence Report only included studies investigating food, diet and health relationships, the results ofother high quality studies published since 2002 were used to update the sections in the <strong>Guidelines</strong> that provideother information (‘Setting the scene’, ‘How eating a particular food may improve health outcomes’, and ‘Practicalconsiderations’ sections) if they met the following criteria:• the study was a high quality randomised controlled trial, intervention, cohort, or observational study, but not aneditorial or opinion piece (meta-analyses were considered)• the outcome of the study related to some aspect of health or chronic disease• the study results were generalisable to the Australian population• the study was related to foods or the total diet rather than nutrients.While they did not influence the evidence statements or grades, these sources were used to assist in refiningtranslation of the evidence.How the evidence was usedGetting the Guideline wording rightThe final wording of each Guideline was developed by the Working Committee through a consensus approach,based on the information gained from the five key sources discussed above. Each Guideline is considered to beequally important in terms of public health outcomes.<strong>For</strong> example, to translate all available evidence regarding consumption of vegetables and health outcomes into aguideline recommendation the following evidence was considered:• the graded evidence statements (from Grade A through to C) about the relationship between consumption ofvegetables and various health outcomes 33• the importance of vegetables as a source of key nutrients in the Australian diet from the Food ModellingSystem 9 and the NRV Document 8• the relatively low energy content of vegetables 8,9• findings of international authoritative reports including the World Cancer Research Fund report (WCRF Report)(see Appendix F) 43• information provided in the 2003 edition of the dietary guidelines. 36Assessment of all available sources of evidence confirmed the importance of consuming vegetables for promotinghealth and wellbeing. The Working Committee translated this evidence into the guideline recommendation to ‘eatplenty of vegetables’.Using evidence statementsThe graded evidence statements from the Evidence Report are included in the section titled ‘Evidence’ undereach guideline recommendation. These sections also include relevant ungraded referenced evidence from theother four key evidence sources to ensure comprehensiveness and currency. The Evidence sections provide thebasis of the scientific information that was translated to form the guideline recommendation at the beginning ofeach chapter.To ensure the <strong>Guidelines</strong> are realistic, practical and achievable, the scientific and social context for each guidelinerecommendation was considered, along with potential mechanisms through which particular dietary patternsmay influence health, to help assess the plausibility of the associations described in the Evidence sections.This information originated predominantly from the previous dietary guidelines series, updated by narrativereviews of additional literature sourced from authoritative reports, from the Food Modelling System, 9 the NRVDocument 8 and high quality studies published since the 2003 edition of the dietary guidelines.IntroductionNational <strong>Health</strong> and Medical Research Council7
Challenges for adoption of the <strong>Guidelines</strong><strong>Dietary</strong> patterns consistent with the <strong>Guidelines</strong>Adherence to dietary recommendations in Australia is poor. 44 Most children’s intake of vegetables, fruit, grain(cereal) foods and milk, yoghurt and cheese products and alternatives is below recommended levels, while theirintake of saturated fat, sugar and salt exceeds recommendations. 12 Analysis of Australia’s 1995 National NutritionSurvey 45 found that energy-dense, nutrient-poor ‘extra foods’ 46 contributed 41% of the total daily energy intake of2–18 year olds. 47The most recent dietary data available for Australian adults (collected in the 1995 National Nutrition Survey)also showed a poor dietary pattern, with inadequate intake of vegetables, fruit, wholegrain cereals and milk,yoghurt and cheese products and alternatives, and higher than recommended proportions of fat intake derivedfrom saturated fat. 45,48 More than 35% of daily energy intake was derived from energy-dense nutrient-poor ‘extra foods’. 47Barriers to dietary patterns consistent with the <strong>Guidelines</strong>Influences on dietary choices throughout life are complex, ranging from individual, physical and social factorsthrough to societal and environmental factors. 49-87Possible barriers to compliance with recommendations may include the food environment (including availabilityand affordability), poor communication of advice, low levels of understanding of the information, low levels of foodliteracy and high levels of food insecurity (this may include the inability to access adequate amounts of nutritious,culturally acceptable foods), conflicting messages (such as advertising and promotion of energy-dense nutrientpoorfoods and drinks), and particular dietary preferences. 88,89There appear to be complex relationships between dietary patterns established in childhood and dietary qualityover time. Studies suggest that frequency of consuming takeaway food increases with age and is associatedwith higher intakes of energy, total fat, saturated fat and sodium, 75-77,90 while frequency of breakfast consumptiondecreases with age and skipping breakfast is associated with reduced intake of calcium and dietary fibre. 91There is some evidence that family meal patterns during adolescence predict diet quality and meal patternsduring early young adulthood. 92 Childhood smoking is also associated with poor dietary habits, 78,83 as is astressful family life. 86,87Improved understanding of what Australians are eating will assist the implementation and uptake of the<strong>Guidelines</strong>, which provide the evidence for what Australians should be eating. Much of our current knowledge ofadult Australian dietary patterns comes from the 1995 National Nutrition Survey; however the 2011–13 Australian<strong>Health</strong> Survey 93 will provide a better understanding of the current diet and nutrition of Australians. This surveyis collecting data on food and nutrient intake, dietary behaviours and supplement usage. Detailed data from thesurvey will be released from May 2013 for the general population and from June 2014 for the Aboriginal andTorres Strait Islander population.Although the key messages of the <strong>Guidelines</strong> may not have changed significantly since the 2003 edition of thedietary guidelines, the evidence base supporting them has strengthened considerably. The challenge now is toensure that these <strong>Guidelines</strong> – particularly the renewed emphasis on achieving and maintaining a healthy weight –are strongly promoted within a context that encourages and supports more nutritious food choices, dietarypatterns and healthy lifestyles within the community.<strong>Dietary</strong> choices and the environmentThe food we eat has an impact on our personal health. The food system (including the production, processing,distribution and consumption of food and drinks) also has broader implications for the health of the environmentand hence the ability of individuals to continue to enjoy a healthy diet. Numerous Australian Government agencieshave responsibilities that cross all of these areas, and a range of activities is underway to monitor, betterunderstand and improve the issues.The concept of sustainable dietary patterns is not straightforward, as there are many complex interactions as foodis grown, transported, sold, prepared, consumed and the remnants disposed. Considering a specifically Australiancontext is also important, as some food production and subsequent handling differs considerably to processes inNorth America and Europe, where much of the literature originates.8EAT FOR HEALTH – australian dietary guidelinesNational <strong>Health</strong> and Medical Research Council
Nevertheless, many Australians consider it important to think about the environmental impact of their foodchoices, in the same way they make other lifestyle choices in the context of environmental impact. 94-97Increasingly, people seek advice from health professionals to help guide these decisions (see Appendix G).Available Australian and international evidence cannot support specific advice on the environmental impact ofparticular food items or brands, but there are some practical steps that people can take, including:• buy and consume foods and drinks that are consistent with these <strong>Guidelines</strong>• avoid overconsumption• minimise food wastage• consider your food buying, storage, preparation and disposal practices• minimise and recycle the packaging of food.Choosing quantities of foods and drinks that are beyond an individual’s energy needs is unhealthy; it also encouragesan unnecessary use of natural resources, which increases the person’s environmental footprint. Food wastagefurther increases the environmental burden. The general principles of these <strong>Guidelines</strong> are compatible withreducing environmental impact as well as promoting good health (see Appendix G).How to use the <strong>Guidelines</strong>This edition of the Australian <strong>Dietary</strong> <strong>Guidelines</strong> has been developed as a single comprehensive report coveringall healthy Australians. Further consideration of dietary patterns for specific subpopulations are provided wherethere is a significant difference in dietary needs.A consistent approach has been used throughout the <strong>Guidelines</strong>, with four main subheadings for eachcomponent of a guideline.• Setting the scene – provides a brief background to the topic.• Evidence – outlines the scientific evidence base from 2002–2009, from studies of associations betweenhuman consumption patterns and health outcomes, and the effects of dietary interventions on healthoutcomes relating to foods, food groups and whole dietary patterns.• How eating a particular food (or particular dietary pattern) may improve health outcomes – describes themechanisms of action that may underlie the evidence presented.• Practical considerations – identifies practical issues and health outcomes for subgroups within thepopulation, including different life stages.Practice guides are included to provide a summary of how each guideline can be put into practice.IntroductionNational <strong>Health</strong> and Medical Research Council9
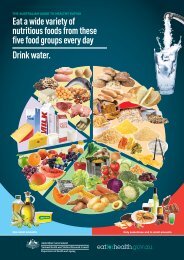
Australian Guide to <strong>Health</strong>y <strong>Eat</strong>ingAustralian Guide to <strong>Health</strong>y <strong>Eat</strong>ingEnjoy a wide variety of nutritious foodsfrom these five food groups every day.Drink plenty of water.Vegetables andlegumes/beansGrain (cereal) foods,mostly wholegrainand/or high cerealfibre varietiesMuesliPolentaQuinoaPenneFettuccineRed kidneybeansWheat flakesRed lentilsChickpeasMixed nutsLentilsRed kidneybeansChickpeasFruitLean meats andpoultry, fish, eggs,tofu, nuts and seedsand legumes/beansMilk, yoghurt, cheese and/oralternatives, mostly reduced fatUse small amountsOnly sometimes and in small amounts10EAT FOR HEALTH – australian dietary guidelinesNational <strong>Health</strong> and Medical Research Council
Guideline 1Achieve and maintain a healthy weightGuideline 1Guideline 1To achieve and maintain a healthy weight, be physically active and choose amounts ofnutritious foods and drinks to meet your energy needs.• Children and adolescents should eat sufficient nutritious foods to grow and develop normally.They should be physically active every day and their growth should be checked regularly.• Older people should eat nutritious foods and keep physically active to help maintainmuscle strength and a healthy weight.Summary• <strong>Health</strong>y weight is associated with reduced risk of chronic disease, including cardiovasculardisease, type 2 diabetes and some cancers. Unhealthy weight refers to being underweight,overweight or obese.• An optimum dietary pattern for adults to achieve and maintain a healthy weight is one inwhich nutrient requirements are met and total energy intake does not often exceed totalenergy expenditure.• Physical activity is an important part of a healthy, active life.• The high and increasing prevalence of overweight and obesity in Australia highlights theneed to provide guidance for achieving and maintaining a healthy weight. Small, persistentexcess energy intake will cause excess weight gain in people of any age.• Recent evidence highlights the importance of achieving an appropriate suitable energyintake, within suitable macronutrient distribution ranges for protein, fat and carbohydrates.In general, the quantities of foods outlined in the Australian Guide to <strong>Health</strong>y <strong>Eat</strong>ingand companion resources should not be exceeded and consumption of energy-dense,nutrient-poor discretionary foods and drinks should be limited.• Weight should be measured regularly in adults and the amount and/or quality of food,drinks and physical activity adjusted accordingly. Children and adolescents needsufficient nutritious foods to grow and develop normally and their growth should bechecked regularly to ensure appropriate development is occurring.• As most Australian adults are now of unhealthy weight, this chapter offers populationlevel advice on managing weight gain and reduction while discouraging inappropriatefood restriction, particularly among high risk groups.This chapter provides information on the importance of quantity, as well as quality, whenchoosing foods to achieve healthy weight, to promote health and wellbeing and preventchronic disease.Achieve and maintain a healthy weightNational <strong>Health</strong> and Medical Research Council11
Guideline 11.1 Setting the sceneA healthy weight is a body weight associated with normal growth and development in children, and a reducedrisk of short- and long-term morbidity and mortality among people of all ages. 98-102 While it is unhealthy to beunderweight, overweight or obese, 88,98 ideal weight varies from one person to another and at different stagesof life. Persistent excess energy intake, whether small or large, can cause unwanted weight gain in people ofany age.There is widespread recognition that overweight and obesity constitute a global problem requiring urgentattention. 89,98,103,104 Overweight and obesity contributed 7.5% of the burden of premature death and disabilityin Australia in 2003. 10 More recent data from Western Australia and Queensland indicate that overweight andobesity have now overtaken cigarette smoking as the single greatest contributing risk factor, being responsiblefor 8.3–8.6% of the total burden of disease and injury. 105,106As is the case internationally, 107 overweight, obesity and associated health problems place a significant economicburden on the Australian health care system. The total direct, indirect and social cost has been estimated at$37.7–$56.6 billion 5,108 with direct costs estimated at $8–$21 billion. 5,109 It is predicted that by 2023, the projectedhealth expenditure for type 2 diabetes will have risen $1.4 billion to $7 billion per year, due mostly to increasingweight gain. 101.1.1 Weight status and trends in AustraliaThe prevalence of overweight and obesity has increased significantly in Australia and most developed countriessince the 1970s. 98,104,110AdultsMeasured height and weight data in 2007–08 showed that 2% of Australian adults were underweight, 37% wereof healthy weight, 37% were overweight and 25% were obese. 11 Overweight and obesity were more common inmen than women (68% versus 55%) and in people aged 65–74 years (75%) than in other age groups.Children and adolescentsA number of national and state-based surveys of children and adolescents using measured height and weightdata have found that 21–25% of children and adolescents are overweight or obese (with 5–8% classified asobese) and 2–5% are underweight. 11,12,111-113 The prevalence of obesity is higher for boys than girls (9% comparedwith 6%), 11 although the prevalence of combined overweight and obesity is similar (26% for boys and 24% forgirls). 11 The prevalence of overweight and obesity in children has increased significantly over the past twodecades. Although the rate of increase appears to be slowing, 111,112 the high prevalence remains of concern. 113Childhood obesity has been identified as one of the most serious public health challenges of the 21st century. 114In the United States (US) it has been predicted that, due to premature mortality associated with obesitydeveloping at a younger age, the current generation of children will be the first in that country’s history to havea life expectancy lower than that of their parents. 115 Obesity is an important determinant of a range of healthdisorders – unless the increasing prevalence of overweight and obesity is arrested, the burden of chronicdisease in future generations will be pandemic 5,110 and cause a crisis in health and economic systems acrossthe world. 88,98,101Predicted trendsIf current trends continue in Australia, it is estimated that by 2025, 83% of men and 75% of women aged20 years or more will be overweight or obese. 116The predicted increases would significantly affect disease burden and health care costs, mostly due to anincreased incidence of type 2 diabetes. Without intervention, type 2 diabetes will account for around 9% ofthe total disease burden in Australia in 2023, up from around 5% in 2003. 1012EAT FOR HEALTH – australian dietary guidelinesNational <strong>Health</strong> and Medical Research Council
How is healthy weight assessed?Guideline 1The most common approach is the use of the body mass index (BMI) calculated as weight (in kilograms)divided by height (in metres) squared (kg/m 2 ).BMI is a measure of body size that is widely used as an index of relative risk of mortality and morbidityat the population level, with risk lowest in the healthy weight range. 100,104BMI categories for adults are as follows: 104,117• < 18.5 kg/m 2 – underweight• 18.5 to 24.9 kg/m 2 – healthy weight• 25.0 to 29.9 kg/m 2 – overweight• ≥ 30.0 kg/m 2 – obese.However, this classification may not be suitable for all population groups: 118,119• some groups may have equivalent levels of risk at a lower BMI (e.g. people of Asian origin) or higherBMI (e.g. people of Polynesian origin including Torres Strait Islanders and Mãori) 120• while specific BMI ranges have not been developed, Aboriginal people have a relatively high limb totrunk ratio and may have equivalent levels of risk at a lower BMI• a higher BMI range may be desirable for people aged over 70 years.Waist circumference is also used as a proxy for chronic disease risk in adults: 12,121• risk is increased at ≥80 cm and high at ≥88 cm for women and increased at ≥94 cm and high at≥102 cm for men• as with BMI, thresholds for other ethnic groups may differ from those for people of European descent.<strong>For</strong> children and adolescents, continuing growth means that it is not possible to have a single set ofnumerical values for BMI cut-offs that apply to all ages and both sexes. Weight appropriateness iscommonly assessed using age-related cut-off values 122,123 or Z-scores (or standard deviation scores). 124<strong>For</strong> more information, see Appendix H.1.1.2 <strong>Health</strong> effects associated with weight statusAdultsOverweight and obesityOverweight and obesity are associated with increased risk of type 2 diabetes, cardiovascular disease, hypertension,metabolic syndrome, some cancers, musculoskeletal conditions, respiratory conditions, sleep apnoea, gall bladderdisease, hernia, reproductive disorders, urinary incontinence, fatty liver disease, and depression and other mentalhealth disorders. 88,89,98,125 About 70% of people who are obese have at least one established comorbidity, resulting inmedical costs that are about 30% greater than those of their healthy weight peers. 107Compared to having a BMI of 18.5–25 kg/m 2 , having a BMI of 30–35 kg/m 2 reduces life expectancy by 2–4 years,and having a BMI of 40–45 kg/m 2 reduces it by 8–10 years. 126 The relative increase in mortality rate attributable toobesity tends to decline with age. 127 Mortality and morbidity are also associated with the amount of weight gainedin adult life. 89,98,101Many obesity-related conditions are preventable, and several are at least partially reversible through weight lossachieved by adopting a nutritious dietary pattern and active lifestyle. 89,98,101Achieve and maintain a healthy weightNational <strong>Health</strong> and Medical Research Council13
Guideline 1UnderweightWhile the greatest risk to health on a population basis is associated with being overweight, being underweightcan also have adverse health consequences including decreased immunity (leading to increased susceptibility tosome infectious diseases), osteoporosis, decreased muscle strength and hypothermia. 36 Among older people,being underweight may be more deleterious to health than being overweight. 128Inappropriate dietary restriction and eating disorders occur in some adults. 129Children and adolescentsOverweight and obesityThe most immediate consequences of overweight and obesity in childhood are social discrimination (associatedwith poor self-esteem and depression), increased risk of developing negative body image issues, and eatingdisorders. 101,130 Overweight children and adolescents are more likely to develop sleep apnoea, breathlessnesson exertion and reduced exercise tolerance, some orthopaedic and gastrointestinal problems, non-alcoholic fattyliver disease, and early signs of metabolic and clinical consequences, such as hypertension, hyperinsulinaemia,hypertriglyceridaemia and type 2 diabetes. 101,130A major long-term consequence is that overweight children are more likely to become overweight or obese adults,with an increased risk of chronic diseases and early mortality. 101,130-132 The risk of chronic disease is increased withrapid weight gain in infancy and early childhood. 88,89UnderweightIn infancy and early childhood, underweight and failure to thrive can be more prevalent than overweight andobesity in some communities. Failure to thrive is most commonly a result of socioeconomic factors, includingpoor living conditions 133 but can also occur among affluent sections of the community due to inappropriatedietary restrictions (e.g. based on fears about ‘unhealthy’ dietary habits). 134 Specialist advice should be soughton underweight and failure to thrive in infants and children (for further information on growth see Appendix H).Inappropriate dietary restriction and eating disorders occur in some adolescents. 1291.1.3 Causes of overweight and obesity in the population<strong>Health</strong>y body weight results from an appropriate balance between energy intake and expenditure (of whichphysical activity is a component). 89,101,135 At the population level, there is increasing evidence that excess energyintake is a major contributor to energy imbalance. 88,135-140The obesogenic (obesity promoting) environmentExcess weight gain is directly and indirectly influenced by a wide range of factors, including inherited biologicalfactors and early life experiences, as well as behavioural, environmental and social factors that influence individualbehaviours. The relationships between these factors are complex and not yet fully understood.Although genetic factors may increase an individual’s susceptibility to being overweight or obese, the dramaticincrease in prevalence of overweight and obesity over the past few decades suggests that socioenvironmentalfactors are a major contributor to the current epidemic. 88,89,98,101,138,139,141 Significant changes during this periodinclude, but are not limited to:• changes in the food supply, particularly increased availability and decreased relative cost of foods which tendto be higher in energy density and relatively nutrient-poor 142• increased availability and marketing of energy-dense, nutrient-poor foods and drinks• urban design which reduces energy expenditure during daily activities and increased reliance on car andlabour-saving devices 138,143• reduced perceptions of safety leading to fewer opportunities for physical activity 144,145• economic and consumer changes, such as a greater number of women in the paid workforce, decreasedfood literacy and cooking skills, and greater reliance on convenience and takeaway foods. 140,141,14614EAT FOR HEALTH – australian dietary guidelinesNational <strong>Health</strong> and Medical Research Council
These changes contribute to an ‘obesogenic’ environment, which promotes excess weight gain by fosteringconsumption of energy-dense and relatively nutrient-poor foods and/or reduced physical activity. 138,147-150In the context of this social and physical environment, overweight and obese individuals need support, ratherthan criticism and discrimination. Education has an important role in establishing health behaviours and thereadiness of individuals to effect behavioural change. <strong>Health</strong>y weight initiatives must achieve a balance betweenindividual and societal responsibility and be culturally appropriate, widely available and accessible, particularly todisadvantaged and vulnerable groups. 89,151Guideline 1Energy intake and trend dataIn adults, energy intake increased by 3–4% in the decade to 1995, equivalent to an additional 350 kilojoules perday (see Figure 1.1). 152 Greater increases were seen in children and adolescents, with energy intake increasingby 11% for 10–15 year-old girls (equivalent to an additional 900 kilojoules per day) and by 15% for 10–15 year-oldboys (equivalent to an additional 1,400 kilojoules per day) (see Figure 1.2). 152 Without compensatory increasesin physical activity, these changes are enough to have resulted in the significant observed increase in meanbody weight. 152It should be noted that results of the 2007 Australian National Children’s Nutrition and Physical Activity Surveycannot be compared with previous national surveys due to differences in methodology. As well, in some groups(such as older girls) there is likely to have been significant under-reporting of energy intake. 12 Up-to-date data willbe provided by the 2011–13 Australian <strong>Health</strong> Survey, which is collecting information about the dietary intake ofAustralians aged 2 years and over. 93Figure 1.1: Mean energy intakes of adults: 1983 and 1995140001200010000TT19831995Kilojoules80006000TT400020000MalesFemalesSource: Adapted from Cook et al (2001). 152Achieve and maintain a healthy weightNational <strong>Health</strong> and Medical Research Council15
Guideline 1Figure 1.2: Mean energy intakes of children aged 10–15 years: 1985 and 199512000T198510000T1995Kilojoules80006000TT400020000BoysGirlsSource: Adapted from Cook et al (2001). 152Energy from macronutrientsMacronutrients (proteins, fats and carbohydrates) all contribute to dietary energy intake. 8 There is a growingbody of evidence that the relative proportions of macronutrients consumed affect the risk of chronic disease andmay also affect micronutrient intake. 8 Optimal proportions of the type of fat (e.g. saturated, polyunsaturated ormonounsaturated, or specific fatty acids within these categories) and carbohydrate (e.g. complex [starches] orsimple [sugars]) may also be important in reducing chronic disease risk. 8The estimated Acceptable Macronutrient Distribution Ranges (AMDR) related to reduced risk of chronic disease are: 8• 20–35% of total energy intake from fat• 45–65% from carbohydrate• 15–25% from protein.Outside these ranges, the risk of chronic disease, overweight and obesity, and inadequate micronutrient intakemay increase, but there are insufficient data available at extremes of population intake. 8Alcohol also contributes to dietary energy. It is recommended that alcohol intake contribute less than 5% of dietaryenergy because of the negative association between intake of alcohol and health outcomes (see Section 3.4).Energy intake from specific food groupsIncreased energy consumption in the decade to 1995 was largely driven by rising consumption of cereal-basedfoods (including cakes, biscuits, pies, pizza and some desserts), confectionery and sugar-sweetened drinks. 152In 1995, consumption of energy-dense and nutrient-poor foods contributed almost 36% of adults’ total energyintake and 41% of their total fat intake. <strong>For</strong> children, such foods contributed 41% of total energy intake and47% of total fat intake. 47,153As an example, changes in food group consumption for boys are illustrated in Figure 1.3. Among these was adecrease in intake of fats from oils and spreads, but an increase in intake of fats from other sources, such ascereal-based foods and confectionery, 152 most of which were classified as ‘extra foods’ in the previous editionof the Australian Guide to <strong>Health</strong>y <strong>Eat</strong>ing.16EAT FOR HEALTH – australian dietary guidelinesNational <strong>Health</strong> and Medical Research Council
Figure 1.3: Mean consumption of selected food groups by boys aged 10–15 years: 1985 and 1995Non alcoholbeverages(exc. water)CerealsGuideline 1cereal-basedfruitvegetableslegumes19851995sugar-basedconfectioneryfats and oils0 100 200 300 400 500 600 700 800 900gramsSource: Adapted from Cook et al (2001). 152Energy expenditureTotal daily energy expenditure includes resting energy expenditure (basal metabolic rate plus necessary tissuerepair and the thermic effect of food), and energy expended in physical activity. 8 Resting energy expenditure makesup 60–80% of total energy expenditure, and is mainly related to lean body mass. 8 Active energy expenditure, whichaccounts for up to 20–40% of total energy expenditure, depends on both the amount of physical activity and thebody mass to be moved during the process. Active energy expenditure is the only aspect of energy expenditurethat is under conscious control through physical activity. 8,154Resting energy expenditure, active energy expenditure and total energy expenditure are all substantially increasedin obesity, 155 contradicting the view that obesity is due to ‘low metabolism’ and is maintained despite a low levelof food intake. 135 However, energy expenditure per kilogram of body mass does decline with increasing BMI, evenat the same levels of physical activity. 1541.1.4 Physical activityPhysical activity includes both structured activities such as sport or organised recreation, and unstructured activitiessuch as incidental daily activities at work or home (e.g. gardening or walking/cycling for leisure or transport). 156<strong>For</strong> the current Australian recommendations for physical activity, see Appendix I.Physical activity levels of specific groupsThe proportion of Australian adults reporting recommended levels of physical activity declined from 62% in1997 to57% in 1999. 157 While the different methodologies do not allow comparison, the 2007–08 National <strong>Health</strong> Surveyshowed that only 37% of adults exercised sufficiently to obtain benefits to their health. 24 State-based surveyssuggest that since around 2004, there have been small increases in physical activity participation at levels thatprovide health benefits. 106,158,159New data to enable monitoring and reporting of adults’ physical activity against national physical activity guidelinesand recommendations will be collected in the 2011–13 Australian <strong>Health</strong> Survey, with detailed results availablefrom May 2013.Achieve and maintain a healthy weightNational <strong>Health</strong> and Medical Research Council17
Evidence statementBabies born to mothers who smoke during pregnancy are at an increased risk of development of overweight or obesity inadolescence and adulthood.GradeBGuideline 1Combined diet and physical activity interventions are associated with reduced risk of overweight and obesity in children.Combined diet and physical activity interventions are associated with reduced risk of overweight and obesity in adults.Consumption of vegetables is associated with reduced risk of weight gain.Consumption of fruit is associated with a reduced risk of obesity and weight gain.Hours spent watching television by children is associated with increased risk of development of overweight or obesity.In developed countries, a low family income or socioeconomic status is associated with increased risk of overweight or obesityduring childhood, adolescence, and young adulthood.Low socioeconomic status is associated with an increased risk of overweight or obesity.Interventions delivered in the school environment that are focused on eating and physical activity improve weight outcomesin children.CCCCCCCCNotes: Grades – A: convincing association, B: probable association, C: suggestive associationIncludes evidence statements and gradings from the Evidence Report (literature from years 2002–2009). Does not include evidence fromother sources, such as the 2003 edition of the dietary guidelines (in which individual studies were classified according to their design aslevel I, II or III but overall grades for relationships were not derived), although these sources have been used to inform these <strong>Guidelines</strong>.Grade C evidence statements showing no association and all Grade D statements can be found in Appendix E.1.2.1 Primary and secondary preventionFavourable outcomes have been consistently observed in interventions focusing on both reduced energy intakeand increased physical activity, supporting the evidence statements that combined interventions assist weightmanagement in children, adolescents and adults.• Adults: There is evidence that diet and physical activity interventions in adults can prevent overweight andobesity (Grade C; Evidence Report, Section 22.2). 171 Lifestyle interventions combining diet and physical activityinterventions are probably associated with reduced risk of developing type 2 diabetes in adults (Grade B;Evidence Report, Section 22.3). 171 <strong>For</strong> further information, see the NHMRC Management of overweight andobesity in adults, adolescents and children (NHMRC Overweight and Obesity <strong>Guidelines</strong>). 121• Children and adolescents: Recent reviews of combined diet and physical activity interventions for children andadolescents suggest that these can prevent overweight and obesity (Grade C; Evidence Report, Section 22.1). 172-175There is convincing evidence that behavioural interventions including diet and physical activity reduce the riskof obesity in overweight children – these interventions are more effective when they are family-based (GradeA; Evidence Report, Section 17.12). 176-179 Recent evidence suggests that interventions delivered in the schoolenvironment that focus on healthy eating and physical activity improve weight outcomes in children (Grade C;Evidence Report, Section 17.1). 180,181 There is a limited amount of quality data on specific components of thecombined programs in treating overweight and obesity; however, the results of combined programs indicatesignificant and clinically meaningful reductions in the level of overweight in obese children and adolescents. 182,1831.2.2 <strong>Dietary</strong> patterns and specific foods and drinksThere is increasing evidence that consumption of specific foods and food groups is associated with risk of excessweight gain, while other food types are associated with a reduced risk of weight gain.• Fat: The 2003 edition of the dietary guidelines and many international public health organisations, includingthe World <strong>Health</strong> Organization (WHO), 98 emphasised the major role of fat consumption in the development ofoverweight and obesity and of reducing fat intake as part of management. More recently, WHO has shiftedits emphasis, stating that there is convincing evidence that energy balance is critical to maintaining healthyweight and ensuring optimal nutrient intakes, regardless of macronutrient distribution. 184 Although no specificmacronutrient may be responsible for the development of obesity, the proportion of macronutrients in the dietdoes influence energy and nutrient intake, which may impinge on weight management and health outcomes.Achieve and maintain a healthy weightNational <strong>Health</strong> and Medical Research Council19
Guideline 1• Sugar: No large long-term studies have measured the long-term development of overweight or obesityspecifically related to consumption of added sugars (Evidence Report, Section 14.3). However, recent evidenceindicates that it is probable that consumption of sugar-sweetened drinks (soft drinks) is associated withincreased risk of weight gain in adults and children (Grade B; Evidence Report, Section 15.1), 185-196 a findingconfirmed by a later longitudinal study. 197• Sugar-sweetened drinks: The literature review to inform the revision of the <strong>Dietary</strong> <strong>Guidelines</strong> for Americans,2010 found strong evidence that greater intake of sugar-sweetened drinks is associated with increasedadiposity in children and moderate evidence that consumption of sugar-sweetened drinks is associated withincreased body weight in adults. 198 Most of the relevant research (see Section 3.3.2) was conducted in the USwhere, unlike Australia, corn syrup containing fructose is commonly used to sweeten soft drinks. Althoughthese sweeteners differ only slightly from those used commonly in Australia, this was taken into considerationin grading the relevant evidence statement.• Glycaemic index: The US review found strong and consistent evidence that glycaemic index and/or glycaemicload are not associated with body weight and that modifying either of these does not lead to greater weightloss or better weight management. 198 There is considerable variability in these indices, depending on inter-andintra-individual factors and the form of food (including the degree of processing, stage of ripeness, cooking andcooling times), which may limit practical application. 199 These factors were not included in the literature reviewto inform the revision of these <strong>Guidelines</strong>.• Vegetables and fruit: There is evidence suggesting that consumption of vegetables is associated with areduced risk of weight gain (Grade C; Evidence Report, Section 2.2). 200-203 The evidence also suggests thatconsuming fruit is associated with a reduced risk of obesity and weight gain (Grade C; Evidence Report,Section 1.3). 200-208 The US review found that the evidence for an association between increased fruit andvegetable intake and lower body weight is modest, but may be important in the long term. 198• Portion size: The US review found strong evidence of a positive relationship between portion size andbody weight. 198• Dairy foods: Recent evidence suggests that consumption of dairy foods is not associated with weight changeor risk of obesity (Grade C; Evidence Report, Section 5.8) 209-214 and that consuming milk is not associated withBMI or BMI change in childhood (Grade C; Evidence Report, Section 5.9). 209,215-219 These findings are consistentwith those of the US review, which found strong evidence that intake of milk and milk products do not have adistinct role in weight control. 198• Grains: There is evidence of a probable association between consumption of three to five serves per dayof grain (cereal) foods (mainly wholegrain) and a reduced risk of weight gain (Grade B; Evidence Report,Section 6.5). 215,220-229• Nuts: There is evidence to suggest that consuming nuts (65–110g per day) is not related to risk of weight gainin the short term (Grade C; Evidence Report, Section 8.1). 230-235• Fruit juice: The US review found that, for most children, there was limited evidence that intake of fruit juice isassociated with increased adiposity when consumed in amounts that are appropriate for the age and energyneeds of the child. However, increased intake of fruit juice was found to be associated with increased adiposityin children who were already overweight or obese. 198In seeking to achieve and maintain a healthy weight it is prudent to choose nutrient-dense foods of lower energydensity – that is, those low in total fat, particularly saturated fat, and added sugars (see Chapter 3) – in a total dietarypattern that seeks to control overall energy intake. 236 The US review found strong and consistent evidence that dietarypatterns that are relatively low in energy density improve weight loss and weight maintenance in young adults. 198Factors associated with risk of overweight and obesity• Breastfeeding: There is convincing evidence that breastfeeding infants, compared with formula feeding, isassociated with a reduced risk of becoming obese in childhood, adolescence and early adulthood (Grade A;Evidence Report, Section 17.2). 237• Birth weight: Increased birth weight, especially above 4,000g, is associated with increased risk of overweightor obesity in childhood, adolescence and later life (Grade A; Evidence Report, Section 17.1). 54,58,61,62,79,238,239There is a J- or U-shaped relationship between birth weight and increased risk of child or adult obesity, withboth low birth weight and high birth weight babies at increased risk. 24020EAT FOR HEALTH – australian dietary guidelinesNational <strong>Health</strong> and Medical Research Council
• Childhood weight gain: There is convincing evidence that excess weight gain relative to height duringchildhood is associated with increased risk of being overweight later in life (Grade A; Evidence Report,Section 17.4). 58,241,242Guideline 1• Parental weight: There is convincing evidence that parental overweight or obesity is associated withincreased risk of child overweight or obesity. The risk is greater when both parents (rather than one) areoverweight or obese (Grade A; Evidence Report, Section 17.7). 49-62• Maternal smoking: There is evidence that babies born to mothers who smoke during pregnancy, as anindependent risk factor, probably have a higher risk of becoming overweight or obese in adolescence andadulthood (Grade B; Evidence Report, Section 17.5). 52,54,59-61,243• Television: Recent evidence suggests that hours spent watching television by children is associated withincreased risk of overweight or obesity (Grade C; Evidence Report, Section 17.3). 49,60,64-71,244-246 Media use,including television viewing, may displace time children spend in physical activities 246,247 and eating mealsand snacks in front of the television may also be associated with increased energy intake. 248• Socioeconomic status: There is evidence from developed countries to suggest that a low family incomeor socioeconomic status is associated with increased risk of overweight or obesity during childhood,adolescence and young adulthood (Grade C; Evidence Report, Section 17.9). 49,52,55,64,65,68,72-74 Similarly, theevidence suggests that low socioeconomic status is associated with an increased risk of overweight orobesity (Grade C; Evidence Report, Section 17.10). 59,62,239,249-252• Other factors: Although there were insufficient studies to make an evidence statement, other factorsassociated with increased risk of overweight and obesity throughout life included:––being overweight in adolescence 78––consuming takeaway food and low quality snacks 75-77––childhood smoking 78,83––increased price of fruit and vegetables 68,79––low self-esteem and/or depression 80-82––low locus of control score 84,85––stressful family life 86,87––food insecurity 65,81,253––self-reported dieting, 76,82,254 particularly in girls 255––inadequate sleep 60,244,256,257––low rates of breakfast consumption. 258The literature review to inform the revision of the US dietary guidelines found strong and consistent evidencethat children and adults who eat fast food, particularly those eating at least one fast food meal per week, are atincreased risk of weight gain, overweight and obesity. There was not enough evidence to evaluate any associationbetween eating at other types of restaurants and risk of weight gain, overweight and obesity. 198 The US reviewalso found moderate evidence suggesting that children who do not eat breakfast are at increased risk ofoverweight and obesity, with the evidence being stronger for adolescents. 198The US review also found a limited body of evidence showing conflicting results about whether liquid and solidfoods differ in their effects on energy intake and body weight, except that soup at a meal may lead to decreasedenergy intake and body weight. 198Finally, an emerging body of evidence documents the impact of the obesogenic food environment on body weightin children and adults. Current evidence indicates that the food environment is associated with dietary intake,especially lower consumption of vegetables and fruits, and resulting in higher body weight. 198 This is discussedfurther in Appendix A.Achieve and maintain a healthy weightNational <strong>Health</strong> and Medical Research Council21
Guideline 11.3 How dietary patterns can affect energy balance andweight outcomesEnvironmental and lifestyle factors resulting in overconsumption of energy in the diet and a decrease in physicalactivity are major contributors to the obesity epidemic. A small, persistent energy imbalance is enough tocause excess weight gain in both children and adults, which over time progressively increases the BMI. 135,139Available data from developed countries, including Australia, confirm an increase in energy intake concurrentwith the dramatic increase in the prevalence of overweight and obesity in children and adults since 1980. 139There has been much debate about the role of energy, carbohydrate and fat intake in the obesity epidemic. 236,259,260While reducing excess fat intake has been recognised as an important strategy to reduce energy intake in successfulweight loss interventions, 259 there is little evidence that population fat intake is associated with the obesity epidemicindependently of total energy intake. 260Foods with a higher energy density encourage energy intake above requirements. 198,261 Foods that are high inenergy density also tend to be more palatable, and high palatability is associated with increased food intake insingle-meal studies. 142,262 Fat and sugar are positively associated with energy density while water and dietaryfibre are negatively associated. Fat plays a role because of its high energy density compared to protein andcarbohydrates. Water and dietary fibre play a role through a dilution effect, although this is less for dietary fibrebecause of the much smaller range of fibre concentrations in food compared with both water and fat.It is plausible that the proportions of macronutrients (fat, carbohydrate, protein and alcohol) and types ofmacronutrients comprising total energy intake may affect an individual’s propensity to habitually overconsume.In this regard, dietary patterns that tend to be relatively low in total fat and moderate (not high) in carbohydrateare consistent with reduced risk of excess weight gain. Energy from drinks, in particular, may add to total energyintake without displacing energy consumed in the form of solid food, and it is plausible that sugar-sweeteneddrinks may contribute to excess energy intake through lack of impact on satiety. 216 The satiety value of foods mayalso be important in managing appetite and hunger. 263Energy-dense dietary patterns are associated with higher consumption of grain-based foods, fats and sweetsand lower consumption of vegetables and fruit. 264 International data suggest that the major foods contributing toincreased energy intake include sweetened drinks, snack foods and fast food 261,265,266 and that increasing portionsize is also an important contributor. 198,267,268 The low cost of energy-dense nutrient-poor food relative to nutrientdensefood also has a major role. 261,264The three key lifestyle areas related to overweight and obesity are dietary pattern, physical activity and behaviouralchange. Multicomponent interventions that address all three areas are more effective than those that addressonly one or two. Positive outcomes have been described, at least in the short term, in clinical weight lossregimes that include a range of interventions. 269,270 <strong>For</strong> further information, see the NHMRC Overweight andObesity <strong>Guidelines</strong>. 1211.4 Practical considerations: achieve and maintain a healthy weightIntentional weight loss in overweight and obese individuals reduces the risk factors for mortality and morbidity,and alleviates the symptoms of many chronic conditions. 269,270 It is not necessary to lose large amounts of weightto achieve substantial health gains. <strong>For</strong> example, it is estimated that a weight loss of 5 kg in all people who areoverweight or obese would reduce the national prevalence of type 2 diabetes by 15%. 271 Improving nutritionand/or increasing physical activity also benefits health in areas beyond weight control, such as bone strength,mental health and immune function. 2,272There is a need to provide population guidance on promotion of healthy weight, primary prevention of overweightand obesity, weight maintenance, weight loss, and management of weight-related conditions, disorders anddiseases. A focus on healthy weight is a more positive way to address weight issues than focusing on obesityand overweight. It encourages those who are a healthy weight to maintain that weight. It also helps to reducethe risk of any unintended negative consequences, such as disordered eating. Promotion of healthy weightincorporates prevention and management of underweight, overweight and obesity in children and adults andpromotes healthy growth in children.22EAT FOR HEALTH – australian dietary guidelinesNational <strong>Health</strong> and Medical Research Council
Given the scope of the <strong>Guidelines</strong>, the guidance here focuses on promotion of healthy weight through primaryprevention of overweight and obesity, weight maintenance and achieving healthy weight (through weight loss) inpeople who are overweight without serious comorbidities. Clinical guidance for managing overweight and obesityand its complications for individuals is included in NHMRC Overweight and Obesity <strong>Guidelines</strong>. 121Guideline 1Prevention of overweight and obesity is important because:• weight loss is difficult to achieve and even more difficult to maintain• for most people who are classified as obese, and for many who are overweight, a return to a healthy-rangeBMI may not be a realistic target• the health consequences of obesity tend to be cumulative and may not be fully reversible once the personhas been classified as overweight or obese• it is more efficient and cost effective to prevent weight gain rather than treat overweight and obesity. 88,98,101The community as a whole has a social responsibility to address the current epidemic of obesity. It is especiallyimportant that supportive social, economic and physical environments are created, so that it is easier forindividuals, families, groups and communities to choose healthy dietary and physical activity patterns andachieve and maintain a healthy weight.All initiatives and approaches that promote physical activity, healthy eating, access to nutritious food, and thehealthy growth of children contribute to promoting healthy weight at the population level.1.4.1 Physical activity and dietary patterns in achieving and maintaining ahealthy weightPhysical activityPreviously, it was thought that if energy intake was controlled, 30 minutes of moderate intensity daily physicalactivity would be sufficient to prevent weight gain in adults, providing sitting time was less than 4.5 hours/day. 273-275However, in the current environment of abundant availability, promotion and consumption of energy-dense food,it is now internationally recommended that 45–60 minutes of moderate intensity daily physical activity is theminimum required for the general population to prevent the transition to overweight and obesity withoutreduction in current energy intake. 88,276-279 At least 60–90 minutes of moderate-intensity activity or lesser amountsof vigorous activity may be required to prevent weight regain in formerly obese people. 276The current physical activity guidelines for Australian infants, children and adolescents may be adequate tosupport optimum growth and development and weight control (together with consuming a nutritious diet andappropriate energy intake). 35,121 This is supported by recent evidence from Europe. 280The current physical activity guidelines for Australians are summarised in Appendix H, and these are underreview in 2012.<strong>Dietary</strong> patternsFoundation Diets developed by the Food Modelling System 9 represent the basis of optimum diets to achieveand maintain a healthy weight as they provide nutrient requirements with minimum energy intake.Compared to the most recent available data on adult intakes, Foundation Diets include higher quantities ofvegetables, fruit, wholegrain cereals, poultry, fish, eggs and low fat milk, yoghurt and cheese products, andlower quantities of starchy vegetables, refined grain (cereal) foods, higher and medium fat milk, yoghurt andcheese products and lean red meats (latter for men only). 9 Decreased consumption of discretionary foodswould be needed to achieve the dietary patterns within energy constraints. Changes from higher fat to lowerfat milk, yoghurt and cheese products and from refined grain (cereal) foods to wholegrain (cereal) foods wouldalso be necessary. 9To avoid excess or inappropriate weight gain and therefore prevent development of overweight and obesity,the smallest, least active adults in each age and sex group should adopt dietary patterns consistent with theFoundation Diets. Additional foods and drinks can only be included without leading to weight gain if physicalactivity levels are increased. 9Achieve and maintain a healthy weightNational <strong>Health</strong> and Medical Research Council23
Guideline 1Taller and/or more active adults in each age and sex group can choose additional serves of foods from the fivefood groups and/or unsaturated spreads and oils and/or discretionary foods to increase energy intake to meetenergy requirements (that is, to comprise Total Diets), 9 but they need to monitor weight or waist circumferenceto ensure energy intake does not exceed expenditure. If energy requirements are exceeded by energy intake ona regular basis, weight gain will occur.There is wide variation in individual energy needs, so to prevent weight gain (or inappropriate weight loss) at anindividual level, weight (and waist circumference) should be measured regularly (e.g. every 2–3 months) and theamount and/or quality of dietary intake and physical activity levels adjusted accordingly. 9As a basic principle when adjusting dietary patterns, the first steps are to choose nutritious foods from thefive food groups and the unsaturated fat allowance in amounts consistent with Foundation Diets and to limitdiscretionary (energy-dense, nutrient-poor) choices. If further restrictions are required, rather than eliminatingone category of food from the five food groups, smaller serves should be chosen. 9Recommended quantities of specific food groups to suit those preferring different dietary patterns are includedin the Foundation Diets for adults set out in the Food Modelling System. 91.4.2 Weight loss in adults who are overweightThese <strong>Guidelines</strong> do not encourage inappropriate food restriction. However, they do discourage consumption ofenergy-dense, nutrient-poor discretionary foods and drinks.In dietary patterns to achieve a healthy weight and assist weight loss, the recommendations of types andquantities of foods outlined in the Foundation Diets, outlined throughout this document and in the companionresources should not be exceeded. Adhering to Foundation Diets only, without discretionary foods or additionalserves of the five food groups, could represent a daily reduction in energy intake of 1,850 kilojoules for womenand 2,700 kilojoules for men who are average height for their age and sex group. This could result in a satisfactoryamount of weight loss, even if physical activity levels are not increased.A combination of increased physical activity and energy restriction is more effective than energy restriction alonefor weight loss and maintenance of weight loss. Physical activity can affect body composition favourably duringweight loss by preserving or increasing lean mass while promoting fat loss. Physical activity affects the rate ofweight loss in a dose-response manner, based on its frequency, intensity and duration.Weight loss will not be achieved unless energy intake is lower than total energy expenditure. Lifestyleimprovements, through cognitive and behaviour change, to increase physical activity and improve dietary intakeis fundamental to weight management. Such education, training and support may be provided to individuals orgroups. 121 Weight loss is most likely to be maintained where dietary and physical activity habits are acceptableand sustainable. In this regard, regular weight loss of initially around 1.0 to 4.0 kg per month, reaching 10% lossof initial weight in the medium term and 10–20% loss of initial weight over 1–5 years, is likely to be most effectiveand sustained. 121,281Individuals who are overweight or obese and have associated cardiovascular disease or type 2 diabetes riskfactors should seek clinical advice about the range of available treatment options. 1211.4.3 Pregnant and breastfeeding womenObesity in pregnancy is one of the most common, and potentially modifiable, risk factors for adverse pregnancyoutcomes 282 and longer term adverse outcomes for mothers 283 and children. 284 Since about one-third of pregnantwomen in Australia are overweight or obese, 285 preventing excess gestational weight gain is an urgent health priority.Appropriate maternal weight gain during pregnancy (see Tables 1.2 and 1.3) is important for the health of the infant:• too little weight gain during pregnancy increases the risk of a low birth weight infant• excess weight gain during pregnancy increases the risk of macrosomia and gestational diabetes and is alsoassociated with increased risk of obesity and metabolic syndrome in infants later in life. 286,287Evidence supports recommendations to manage pregnancy to reduce the risk of excess weight gain andgestational diabetes. 288,28924EAT FOR HEALTH – australian dietary guidelinesNational <strong>Health</strong> and Medical Research Council
Appropriate steady weight gain during pregnancy is important to optimise the health outcomes (short term andlong term) for the infant and the mother. 288,289 Steady weight gain helps to avoid adverse effects on specific foetalorgan systems during critical periods (e.g. neural tube 6–8 weeks, kidney development 28–30 weeks).Guideline 1Weight loss diets are not recommended at any time during pregnancy. 289Mothers who gain excess weight during pregnancy are unlikely to lose it later, 290 although dietary patterns thatcomprise regular meals, plenty of fruit and vegetables, high-fibre bread and restricted high sugar snacks 291 mayhelp women reach a healthy weight after giving birth.In recent years there has been increasing awareness of the importance of perinatal nutrition in terms of thedevelopment of disease in adulthood, known as foetal origins of disease or Barker hypothesis. 292 There is alsoincreasing evidence of the importance of growth and optimum nutrition in relation to cognitive development 293and future bone mass. 294Evidence of a probable association between babies born to mothers who smoke during pregnancy and a higherrisk of overweight or obesity in adolescence and adulthood supports recommendations that pregnant womenshould not smoke cigarettes (Grade B; Evidence Report, Section 17.5). 52,54,59-61,243<strong>For</strong> further information on pregnant and breastfeeding women, see the Infant Feeding <strong>Guidelines</strong>. 295Table 1.2: 2010 Institute of Medicine recommendations for total and rate of weight gain during pregnancy, bypre-pregnancy BMIPre-pregnancy BMITotal weight gain in kgRates of weight gain* 2nd and3rd trimester in kg/weekUnderweight (< 18.5 kg/m 2 ) 12.5–18.0 0.51 (0.44–0.58)Normal weight (18.5–24.9 kg/m 2 ) 11.5–16.0 0.42 (0.35–0.50)Overweight (25.0–29.9 kg/m 2 ) 7.0–11.5 0.28 (0.23–0.33)Obese (≥ 30.0 kg/m 2 ) 5.0–9.0 0.22 (0.17–0.27)Multiple pregnancyTwin pregnancy 15.9–20.4 0.7Triplet pregnancy 22.7 —Note: *Calculations assume a 0.5–2kg weight gain in the first trimesterSource: Institute of Medicine 2009. 289Table 1.3: Weight gain during pregnancy: recommendations for Asian women, by pre-pregnancy BMIPre-pregnancy BMI (kg/m 2 )Total weight gain in kg(during pregnancy)Weight gain per week in kg(after 12 weeks)27.5 ≤ 7.0 —Source: Adapted from Institute of Medicine 289 and matched with Asian BMI cut-offs.Achieve and maintain a healthy weightNational <strong>Health</strong> and Medical Research Council25
Guideline 11.4.4 Infants, children and adolescentsInfants, children and adolescents need sufficient nutritious food to grow and develop normally. The focus should beon maintaining a rate of growth consistent with the norms for age, sex and stage of physiological maturity.Physical growth is best assessed by the conventional measures of weight, length or height, and head circumference(see Appendix H). Maintaining a positive energy balance and adequate nutrient intake is critical in achieving andsustaining normal growth and development. During periods of rapid growth, intentional restriction of weightgain – for example, through dieting – is usually inappropriate.GrowthRelative to their body weight, children’s nutrient and energy requirements are greater than those of adults. 8Children are nutritionally vulnerable up to around 5 years of age, after which their growth rate slows and theirnutritional needs reduce relative to their body size. As a child’s rate of growth is a fundamental indicator ofnutritional status and health and wellbeing, parents, carers and health professionals must be responsive tothe developmental and nutritional needs of children.Between birth and 18 years of age, body weight increases about 20-fold. During infancy and adolescence the rateof growth can change rapidly, while from 12 months of age the rate of increase in weight and length is essentiallylinear. Growth decelerates rapidly during the first year of life. During adolescence it accelerates over 1–3 yearsand then decelerates rapidly until growth in height ceases at about 16 years in girls and 18 years in boys.Childhood is a period of education about eating and good nutrition, so appropriate use of food is important inestablishing healthy nutrition practices for life. Food intake may drop off during the second year of life, whenparents’ encouragement and example may be needed. After starting school, children are subject to an increasingarray of influences from outside the home, particularly peer pressure, which peaks in adolescence.<strong>Dietary</strong> patterns for achieving and maintaining a healthy weight in infants, childrenand adolescentsFoundation Diets represent the basis of optimum diets for infants, children and adolescents. Sufficient nutritiousfoods must be provided to support optimum growth and development in all children.<strong>For</strong> the youngest, shortest or least active in each age and sex group, dietary modelling suggests that there isno opportunity for additional energy intake beyond Foundation Diets unless increased physical activity increasesenergy expenditure and requirement. <strong>For</strong> these children Foundation Diets are equivalent to Total Diets.<strong>For</strong> older, taller or more active children in each age and sex group, additional serves of foods from the five foodgroups and/or unsaturated spreads and oils and/or discretionary food choices may be made to increase energyintake until energy requirements are met. 9 Growth and weight of children should be checked regularly (as outlinedin Appendix G) and the amount and/or quality of diet and physical activity adjusted accordingly. 9Compared to current intakes, Foundation Diets for infants, children and adolescents include higher quantitiesof vegetables, fruit, wholegrain cereals, poultry, fish, eggs and low fat milk, yoghurt and cheese products, andinclude lower quantities of starchy vegetables, refined grain (cereal) foods, higher and medium fat milk, yoghurtand cheese products. <strong>For</strong> children, as for adults, decreased consumption of discretionary food choices is neededto achieve the dietary patterns in the Australian Guide to <strong>Health</strong>y <strong>Eat</strong>ing and companion resources, together witha change from refined grain (cereal) foods to wholegrain cereals and from higher fat to lower fat milk, yoghurt andcheese products for children over 2 years of age.Recommended quantities of specific food groups to suit those preferring a range of dietary patterns are includedin the Foundation Diets for infants, children and adolescents set out in the Food Modelling System. 9<strong>Dietary</strong> patterns for weight management in children and adolescents who are alreadyoverweight and obeseManagement of overweight and obesity in childhood is recommended to reduce risk of overweight in later life.Individual assessment and clinical supervision is recommended to ensure appropriate growth and developmentwhile managing weight in overweight or obese children and adolescents. As parental overweight or obesityis associated with increased risk of overweight or obesity in children, a family-focused approach to weightmanagement is likely to be beneficial. 176-179 <strong>For</strong> further information on weight management, see NHMRCOverweight and Obesity <strong>Guidelines</strong>. 12126EAT FOR HEALTH – australian dietary guidelinesNational <strong>Health</strong> and Medical Research Council
<strong>Dietary</strong> restriction beyond prudent adherence to the Foundation Diets and limited intake of discretionary foodsand drinks is not recommended for infants, children or adolescents, as this may result in nutrient deficiencies andsuboptimal growth and development. Adherence to Foundation Diets should assist maintenance of body weightduring growth for children who are overweight. The aim is to maintain weight while the child grows in height,thus ‘normalising’ BMI for age.Guideline 1To help achieve a healthy weight and associated health benefits, most Australian infants, children and adolescentsshould also follow the recommendations of the Australian physical activity guidelines (see Appendix I).1.4.5 Older peopleOlder people should eat nutritious foods and keep physically active to help maintain muscle strength and ahealthy weight.Daily energy expenditure declines throughout adult life, as does physical activity. 45 Energy expenditure isdependent on fat-free mass, which decreases by about 15% between the third and eighth decades of life,contributing to lowered metabolic rate in older people. 296 The decline in energy expenditure must be balancedby adjusting energy intake to maintain body weight within the healthy range and to prevent an increase in bodyfat. 8 <strong>Dietary</strong> patterns and quantities consistent with the Foundation and Total Diets are for older people who aregenerally fit and well. 9Most older people will benefit from increased physical activity 137,297 including reduced sedentary behaviour, increasedmoderate-intensity aerobic activity such as brisk walking or running 298 and particularly activities promoting bone andmuscle strength, flexibility and balance such as yoga or tai chi. 299 In addition to assisting with weight management,these can help reduce the risk of falls 299,300 and may increase opportunities for social engagement. 301Older people commonly have a decrease in skeletal muscle mass and strength, which is the result of a decline inthe production of muscle tissue. 302 Height may also decrease with age as a result of changing spinal shape andintervertebral thickness, making it difficult to determine height and therefore BMI.While overweight and obesity are still prevalent in older adults, 303 consideration of overall morbidity and mortalitysuggests that for obese older people a substantial reduction in BMI may not provide the healthiest long-termoption. 304 Although weight loss achieved by following a nutrient-dense diet and increasing physical activity mayconfer benefits, this is still to be tested in good quality trials. 303 Lowering blood pressure and normalising bloodlipids rather than reducing weight may be more appropriate for older people who are overweight. 302While most of the older population live independently, it has been estimated that 25–40% of those over 80 yearsof age could be considered frail. 305 Malnutrition in older people is often associated with one or more illnessessuch as chronic obstructive lung disease and heart failure, dementia, dysphagia, poor dentition, depression,social isolation, use of drugs, alcohol and other substance abuse, poverty, and despair. 305,306 In Australia, 5–11%of people eligible for Home and Community Care services are malnourished. 307 In acute care, 20–30% of peopleare admitted with malnutrition, the prevalence increasing with age and the number of health problems. 307,308 Olderpeople can develop sarcopenia, a form of muscle wasting, and some older people also experience sarcopenicobesity, where there is a combination of reduced muscle mass and/or strength and excess body fat. 303 As suchthe guidelines in this document are not appropriate for frail elderly people or those with complex health conditionsand an appropriate health professional should be consulted. 34,302The decrease in energy expenditure with ageing is generally accompanied by decreased appetite and diminishedfood intake, so may account for the undernutrition seen in some older people. 309 Recent studies suggest that,for an older person, being underweight may be more deleterious for health than being overweight. 1281.4.6 Aboriginal and Torres Strait Islander peoplesThe last national survey measuring height and weight in Aboriginal and Torres Strait Islander peoples was conductedin 1994. 310 Although recent measured data are lacking, prevalence of overweight and obesity calculated fromself-reported height and weight data – at around 60% – is higher among Aboriginal and Torres Strait Islanderpeoples than from self-reported data from non-Indigenous Australians. 311-313Among Aboriginal and Torres Strait Islander groups living in rural and remote areas, disparities in the cost ofnutritious foods are potential barriers to the adoption of nutrient-dense, low energy-dense diets. 99,140,264,314-317The 2011–13 Australian <strong>Health</strong> Survey will provide data on objective and self-reported height and weightmeasures in Aboriginal and Torres Strait Islander peoples. <strong>For</strong> more information see Appendix A.Achieve and maintain a healthy weightNational <strong>Health</strong> and Medical Research Council27
Guideline 11.4.7 Australians of Asian originThere is little evidence that Australians of Asian origin are at increased risk of overweight, although specialconsideration might need to be given to this group in assessing body fatness. The WHO levels of BMI thatcorrespond to increasing degrees of risk of chronic morbidity and of mortality were primarily derived forpopulations of European origin 118 so may not apply to Australians of Asian origin.Australians of Asian origin have a higher proportion of body fat for the same BMI than Caucasians, so applyingthe current WHO BMI cut-off points may underestimate body fatness and comorbidity risk in this population. 1181.4.8 People with eating disordersWhen promoting healthy weight, optimum nutrition and physical activity, it is essential to avoid inadvertentlyencouraging disturbed body image and disordered eating or exercise behaviour. 129 Characteristics of disorderedeating, such as restrained eating, binge eating, fear of fatness, purging and distorted body image, are commonlyreported in adolescents, particularly in early adolescence and late teens, but eating disorders may occur at anyage. 129 Estimated lifetime prevalence of anorexia nervosa, bulimia nervosa, and binge eating among women isin the range of 0.3–1.5%, 0.9–2.1% and 2.5–4.5% respectively, with estimated rates among men considerablylower. 129 People with suspected eating disorders need to be referred for specialist assistance froma health professional.Effective interventions to reduce the risk of eating disorders include: 129• promotion of nutritious dietary patterns rather than negative focus on specific foods• avoiding stigmatisation of those of various body shapes and weight• promotion of media literacy, such as critical evaluation of presented body ideals• promotion of good mental health.28EAT FOR HEALTH – australian dietary guidelinesNational <strong>Health</strong> and Medical Research Council
1.5 Practice guide for Guideline 1Table 1.4: Summary of practical considerations for Guideline 1Guideline 1Population groupAdults—to achieveand maintain ahealthy weightAdults—to promoteweight lossInfants, childrenand adolescents—to achieve andmaintain a healthyweightInfants, childrenand adolescents—to manageoverweightPregnant andbreastfeedingwomenOlder peopleAustralians ofAsian originConsiderations• Nutritious foods should be chosen from the five food groups and the unsaturatedfat allowance, in amounts consistent with Foundation Diets• Discretionary (energy-dense, nutrient-poor) choices should be limited• Taller and/or more active adults in each age and sex group can choose additionalserves of foods from the five food groups and/or unsaturated spreads and oilsand/or discretionary foods to increase energy intake to meet energy requirements• Weight and waist circumference should be measured regularly (e.g. every 2 or3 months)• The recommendations of the Australian physical activity guidelines should be followed• The Foundation Diets should be adhered to, without discretionary foods or anyadditional serves of the five food groups• Weight loss will not be achieved unless energy intake is lower than totalenergy expenditure• Behavioural change to increase physical activity and improve dietary intakeis fundamental to weight management• Foundation Diets represent the basis of optimum diets to support optimum growthand development• Growth and weight should be checked regularly and the amount and/or quality ofdiet and physical activity adjusted• Childhood is a period of education about good nutrition—appropriate use of foodhelps to establish healthy nutrition practices for life• Restricting diet — beyond adherence to the Foundation Diets and limiting intake ofdiscretionary foods and drinks—is not recommended• The recommendations of the Australian physical activity guidelines should be followed• Appropriate steady weight gain during pregnancy is important to optimise short- andlong-term health outcomes for both infant and mother• Weight loss diets are not recommended at any time during pregnancy• Declining energy expenditure with age must be balanced by adjusting energy intake tomaintain body weight within the healthy range• Physical activity is needed to help maintain muscle strength• Lowering blood pressure and normalising blood lipids may be more appropriate foroverweight older people than reducing weight• The upper range of BMI for healthy adults may be more appropriate for older persons• The Australian <strong>Dietary</strong> <strong>Guidelines</strong> are not appropriate for frail elderly people or those withcomplex health conditions—an appropriate health professional should be consulted• Applying the current WHO BMI cut-off points may underestimate body fatness andcomorbidity riskWhere to next?The next chapter provides information on the importance of consuming a wide variety of nutritious foods topromote healthy weight, to promote health and wellbeing and to prevent chronic disease.Achieve and maintain a healthy weightNational <strong>Health</strong> and Medical Research Council29
GUIDELINE 2Enjoy a wide variety of nutritious foodsGuideline 2Enjoy a wide variety of nutritious foods from these five groups every day:• Plenty of vegetables, including different types and colours, and legumes/beans• Fruit• Grain (cereal) foods, mostly wholegrain and/or high cereal fibre varieties, such as bread,cereals, rice, pasta, noodles, polenta, couscous, oats, quinoa and barley• Lean meats and poultry, fish, eggs, tofu, nuts and seeds, and legumes/beans• Milk, yoghurt, cheese and/or their alternatives, mostly reduced fat (reduced fat milks arenot suitable for children under 2 years)Guideline 2And drink plenty of water.Summary• <strong>Dietary</strong> patterns that include a wide variety of nutritious foods are more likely to meetnutrient requirements, promote health and wellbeing and confer health benefits thanrestricted diets.• A variety of foods should be consumed from each of the five food groups – vegetablesand legumes/beans; fruit; grain (cereal) foods mostly wholegrain and/or high cereal fibrevarieties; lean meats and poultry, fish, eggs, nuts and seeds, and/or legumes/beans; andmilk, yoghurt, cheese and/or alternatives. Mostly reduced fat milk, yoghurt and cheeseproducts are recommendedfor adults, but reduced fat milks are not suitable as the main milk drink for children underthe age of 2 years.• There are many different ways that these nutrient-dense foods can be chosen to contributeto nutritious dietary patterns that suit personal preferences. However economic, social andcultural factors can affect the ability of individuals and groups to access nutritious foods.• Although there have been improvements in diet-related health over the past decades,current consumption patterns still contribute to obesity and an increased risk of chronicdisease including cardiovascular disease, type 2 diabetes and several cancers.• Together with adherence to Guideline 3 (on limiting intake of specific foods high insaturated fat, added sugars and/or salt) and Guideline 1 (on achieving and maintaining ahealthy weight), consumption of a wide variety of nutritious foods and choosing water asa drink will substantially reduce the risk of diet-related chronic disease and promote healthand wellbeing in Australia.This chapter provides information on why the consumption of a wide variety of nutritiousfoods is beneficial to health, the evidence for the recommended approach, and includespractical advice for the general population and specific subpopulation groups.Enjoy a wide variety of nutritious foodsNational <strong>Health</strong> and Medical Research Council31
2.1 Enjoy a wide variety of nutritious foods2.1.1 Setting the sceneNo single food – with the exception of breast milk for about the first 6 months of life – can provide all the nutrientsin the amounts needed for good health. <strong>Dietary</strong> patterns that include a wide variety of nutritious foods and water aremore likely than restricted diets to meet nutrient requirements 8 and confer health benefits. A dietary pattern needs toinclude a variety of choices from each of the five food groups – vegetables; fruit; grain (cereal) foods; lean meats andpoultry, fish, eggs, nuts and seeds and legumes/beans; and milk, yoghurt, cheese and/or alternatives.Guideline 2Most Australians today eat a wide variety of foods from different cuisines. The available food supply generallymeets the nutritional needs of the population, but appropriate choices must be made to ensure that all nutrientrequirements are met, so that diet-related chronic disease can be prevented or delayed, and so that optimumhealth and wellbeing can be achieved. 9 Australia is also fortunate in having a safe food supply with low levels ofcontaminants and pollutants. 318The most recent dietary survey data available for Australian adults – the National Nutrition Survey 1995 – showedan increase in the number of foods being consumed by adults in that year compared with 1983. 45 New data onfood consumption patterns are being collected in the 2011–13 Australian <strong>Health</strong>y Survey, with detailed resultsavailable from May 2013. It is expected that the variety of foods consumed has continued to increase since 1995.This is largely as a result of cultural diversity in the population arising from waves of immigration from Europeancountries after World War II and Asian and African countries since the 1970s. 319,320 Initially, new varieties offresh fruit and vegetables, grain (cereal) foods and different types of meat and legume/beans became available.Increasing demand for convenience and/or fast foods – also as a result of changes in social and economicconditions – has led to the availability of approximately 30,000 different types of foods and drinks. 321 However,many of these – particularly snack and fast foods and drinks – are energy-dense and nutrient-poor, so care isrequired to choose diets consistent with the <strong>Guidelines</strong>. 322Despite the variety of foods available in Australia, comparison of actual intakes with NRVs 8 shows that somepeople are still at risk for deficiencies of particular nutrients. <strong>For</strong> example, intakes of iron and calcium continueto be low in relation to recommendations for some girls and women of reproductive age 9 and iodine intake isinadequate in some pregnant and breastfeeding women. 323Consuming a dietary pattern consistent with the evidence presented in this chapter will help to promote health,protect against disease and reduce the prevalence of nutrient deficiencies. Together with adherence to Guideline1 and Guideline 3, adherence to this guideline will help to reduce the risk of diet-related chronic disease such ascardiovascular disease, type 2 diabetes and some cancers, 8,9,33 and promote health and wellbeing.Food choices to reduce the impact on the environment are consistent with those to improve health. Each foodgroup provides a variety of foods from which people can choose based on dietary preferences or plant-based orbelief-based dietary patterns.2.1.2 The evidence for consuming ‘a wide variety of nutritious foods’Evidence of the health benefits of a dietary pattern consisting of a variety of nutritious foods in appropriateamounts has strengthened over the past decade. The evidence suggests that high diet quality is associated witha reduced risk of chronic disease and improved health outcomes (Grade C; Evidence Report, Section 20.3). 20,324-327Reviews of studies of a range of eating patterns suggest that:• higher quality diet is associated with reduced morbidity• the negative health effects tend to be greater in those with lower quality diets, such as men, young people andpeople with lower educational and socioeconomic status• consuming a dietary intake pattern consistent with national dietary guidelines or other scientifically informedrecommendations is associated with reduced morbidity and mortality (Grade C; Evidence Report, Section 20.3). 19,20Recent evidence also confirms that a dietary pattern consistent with current guidelines to consume a wide varietyof nutritious foods may be associated with superior nutritional status, quality of life and survival in older adults. 21,2232EAT FOR HEALTH – australian dietary guidelinesNational <strong>Health</strong> and Medical Research Council
Table 2.1: Evidence statements for consuming ‘a wide variety of nutritious foods’Evidence statementThe evidence suggests that high quality diet is associated with a reduced risk of chronic disease and improvedhealth outcomes.The evidence suggests the consumption of a dietary intake pattern aligned with national dietary guidelines orrecommendations is associated with reduced morbidity and mortality.GradeCCNotes: Grades – A: convincing association, B: probable association, C: suggestive associationIncludes evidence statements and gradings from the Evidence Report (literature from years 2002–2009). Does not include evidence fromother sources, such as the 2003 edition of the dietary guidelines (in which individual studies were classified according to their design aslevel I, II or III but overall grades for relationships were not derived), although these sources have been used to inform these <strong>Guidelines</strong>.Grade C evidence statements showing no association and all Grade D statements can be found in Appendix E.2.1.3 How consuming a wide variety of nutritious foods may improvehealth outcomesNutritional science has traditionally characterised foods according to their macro- and micronutrient values, butthere is increasing evidence of the role that whole foods play in promoting health and wellbeing, and of the roleof food components other than nutrients in protecting against some communicable and non-communicablechronic diseases when consumed as part of a varied nutritious diet. 328,329 These non-nutrient components includephytochemicals, which are obtained from plants and are biologically active but not directly associated withdeficiency syndromes. They include carotenoids, flavonoids, isoflavonoids, polyphenols, isothiocyanates, indoles,sulphoraphanes, monoterpenes, xanthins and non-digestible oligosaccharides. It is not always known which foodconstituents are responsible for the protective effects of specific foods against specific chronic diseases, and it islikely that many other active constituents will be discovered in the future. Interactions between these compoundsare likely to be complex, either causing or masking effects, or acting synergistically with other compounds. 9Guideline 2<strong>Dietary</strong> variety has the benefit of diluting potential toxicants found naturally in foods. 330 Diversity in food intakecan reduce an individual’s exposure to any one group of toxicants. Other ways of minimising this risk includeappropriate and careful processing, cooking and storage of food (see Chapter 5).Another potential benefit of food variety comes from maximising the bioavailability of nutrients. 331 The many complexrelationships between foods, nutrients and food components (such as phytates) can influence the absorption,metabolism and retention of nutrients. When dietary patterns are varied and nutrients are in adequate supply,these interactions pose fewer problems than in restricted, monotonous dietary patterns.Clinical problems associated with excess intake of nutrients are nearly always associated with intakes ofsupplements. 8 It is also possible to develop symptoms of toxicity when dietary patterns concentrate onparticular foods, or if the same nutrient is consumed in different chemical forms. 8,332 Examples include excessiveconsumption of carrot juice or regularly eating very large quantities of liver, which may cause vitamin A toxicity. 3332.1.4 Practical considerations: enjoy a wide variety of nutritious foodsIt is important to consider this Guideline together with other <strong>Guidelines</strong>, particularly Guideline 3 on limiting intakesof specific foods high in saturated fats, added sugars and/or added salt and Guideline 1 on healthy weight. The word‘plenty’ is used judiciously to encourage increased consumption of vegetables (except those that are fried).<strong>For</strong> the other food groups, the <strong>Guidelines</strong> do not advocate plenty, but rather focus on an adequate amount ofthe preferred varieties within each food group, for example wholegrain, or lean, or lower fat and plain water,preferably from the tap. This serves to distinguish between eating a variety and overconsumption, as there issome evidence that there may be a link between eating a variety of energy-dense food and drinks and excessfood intakes (see Chapter 1). Variety refers to nutritious food, not discretionary foods.Different quantities of different types of foods from the five food groups are recommended for different ages,sexes, and those with different energy (kilojoule) intake requirements. These are based on dietary modelling toinform the revised Australian Guide to <strong>Health</strong>y <strong>Eat</strong>ing 9 and companion resources. Discussion of dietary patternsand the environment is included in Appendix G.Enjoy a wide variety of nutritious foodsNational <strong>Health</strong> and Medical Research Council33
Pregnant and breastfeeding womenConsuming a variety of nutritious foods is particularly important during pregnancy and while breastfeeding.Quality nutritious dietary patterns during pregnancy may reduce the risk of babies being small for their gestationalage or exhibiting restricted intrauterine foetal growth, 334-336 or being large for their gestational age, 337 and may alsohelp reduce the risk of pregnant women developing pre-eclampsia. 338,339 Quality nutritious dietary patterns beforeand during pregnancy may help reduce the risk of women developing gestational diabetes mellitus. 339-342Guideline 2Maternal diet during pregnancy and while breastfeeding does not appear to affect the risk of asthma, eczema orother allergy symptoms in infants. 343-347 Some health outcomes (such as allergies) in children will be affected moreby their diet through infancy and childhood than their mother’s diet during pregnancy, with in-utero influenceslikely to be minimal. However, a cohort study found that mothers who adopt high quality dietary patterns aremore likely to have children who also consume nutritious diets. 348Foods that should be avoided during pregnancy include those associated with increased risk of Listeria bacteria,such as soft cheeses, cold seafood, sandwich meats, pâté, bean sprouts and packaged or pre-prepared salads(see Chapter 5 for further information on food safety). 349Consumption of fish can be valuable in pregnancy however care may be required with intakes of certain speciesof fish due to the potential risk of excessive mercury intake (see Section 2.4.4).Constipation is a common symptom during pregnancy. 350 Clinical treatment of constipation generally includesadvice to consume a high fibre diet, including wholegrain cereals, fruit, vegetables and legumes, and to avoiddehydration by drinking sufficient water, which is consistent with these <strong>Guidelines</strong>.InfantsExclusive breastfeeding is recommended for around the first 6 months of age after which solid foods of suitabletexture can be introduced. At around the age of 6 months, infants are physiologically and developmentally readyfor new foods, textures and modes of feeding and need more nutrients than can be provided by breast milk orformula alone. There is no particular order or rate for the introduction of new foods, other than the first foodsshould be rich in iron. Food choices should be varied to ensure adequate energy (kilojoule) and nutrient supply.Breastfeeding should continue until 12 months and beyond for as long as the mother and child desire. <strong>For</strong> moreinformation on breastfeeding and the transition to solids, see the Infant Feeding <strong>Guidelines</strong>. 351When introducing solid foods to infants, parents and carers should ensure that a wide variety of nutritious foods ofdifferent colours, suitable textures and types is offered. This will provide the additional nutrients required as infantsgrow and the variety will help to increase acceptance of different nutritious foods. It is also more likely to improvethe acceptance of a varied diet during childhood.Nuts are a problem for small children as their size and consistency increases the risk of inhalation and choking.<strong>For</strong> this reason, they should not be given to children aged less than 3 years. However nut pastes and nut spreadscan be offered to infants from around 6 months of age. <strong>For</strong> further information on appropriate foods for infants,see the Infant Feeding <strong>Guidelines</strong>. 351Children and adolescentsChildren and adolescents should be encouraged to consume enough of a wide variety of nutritious foods tosupport normal growth and development. 129<strong>Eat</strong>ing disorders and disordered eating are believed to affect a significant number of the Australian population,although the exact number is unknown due to the absence of accurate data. Adolescents, mainly girls, may bevulnerable to disordered eating and may choose a restricted diet.34EAT FOR HEALTH – australian dietary guidelinesNational <strong>Health</strong> and Medical Research Council
AdultsMales living alone are at particular risk of not eating a wide variety of nutritious foods. Analysis of the 1995 NationalNutrition Survey 36 showed that, in nearly all age groups, adult men consumed significantly fewer typesof foods than other groups.Older peopleThe diet of older people is generally more varied than that of younger groups. 45 However some older people areat increased risk of consuming monotonous, limited diets due to factors such as reduced mobility, poor dentitionand poverty, which may reduce access to a range of fresh foods.Aboriginal and Torres Strait Islander peoplesLimited data on dietary intake among Aboriginal and Torres Strait Islander peoples are available. Very restricteddietary patterns – in which over 50% of energy (kilojoule) intake was derived by meat, flour and sugar – have beendescribed in remote Aboriginal communities, 352 with relatively little change observed recently. 353 However themajority of Aboriginal and Torres Strait Islander people live in urban areas and their most significant dietary issuestend to be also experienced by many people in lower socioeconomic groups. <strong>For</strong> further information please seeAppendix A.Guideline 2People in lower socioeconomic groupsIn some urban centres, people in lower socioeconomic groups have less access to supermarkets and greateraccess to fast food outlets than more advantaged groups. 354,355 Supermarkets generally offer a wider variety offood products, as well as fresh raw food.In Australia, the cost of a nutritious diet has been estimated to account for about 40% of the disposable incomeof welfare-dependent families, compared to only 20% of an average family’s disposable income. <strong>Health</strong> professionalsshould be aware of the budget challenges healthy food habits may pose for people who are welfare dependentand should note that checking and comparing the price of food products can reduce the weekly food cost by about13%. 316 Further details regarding the association of equity issues and consumption of varied and nutritious dietsare included in Appendix A.People living in remote areasThe decreased availability of nutritious foods (such as fresh fruit and vegetables, wholegrain bread and low fat milkproducts) in remote and regional areas in Australia has been described frequently. The cost of nutritious foods inthese areas is also over 30% higher than in major cities and may impact on food security. 28,317,356,357People with vegetarian or vegan dietary patternsAbout 4% of all respondents in the 1995 National Nutrition Survey described themselves as vegetarian or vegan. 45The food frequency questionnaire data recorded only 2% as consuming no animal products, and a further 2% asrestricting consumption of animal foods to fish or white meat. 45 Many more people eat vegetarian meals regularlyor occasionally.Appropriately planned vegetarian diets, including total vegetarian or vegan diets, are healthy and nutritionallyadequate. Well-planned vegetarian diets are appropriate for individuals during all stages of the lifecycle. 358Those following a strict vegetarian or vegan diet can meet nutrient requirements as long as energy needs aremet and an appropriate variety of plant foods are eaten throughout the day. Those following a vegan diet shouldchoose foods to ensure adequate intake of iron and zinc and to optimise the absorption and bioavailability of iron,zinc and calcium. 359 Supplementation of vitamin B 12may be required for people with strict vegan dietary patterns. 8Enjoy a wide variety of nutritious foodsNational <strong>Health</strong> and Medical Research Council35
2.2 Enjoy plenty of vegetables, including different types and colours,and legumes/beans, and enjoy fruit2.2.1 Setting the sceneGuideline 2There are many nutritional, societal, culinary and environmental reasons to ensure that vegetables, includinglegumes/beans, and fruit are a major component of Australian dietary patterns. These foods are nutrient dense,relatively low in energy (kilojoules) and are good sources of minerals and vitamins (such as magnesium, vitamin Cand folate), dietary fibre and a range of phytochemicals including carotenoids. Many of the sub-componentsof foods and their relationships have not been studied in detail, and it is expected that other sub-components –and their biological effects – are still to be discovered.The inclusion of a variety of vegetables, including legumes/beans, and fruit provides a diversity of colours, texturesand flavours, adding to the enjoyment of eating. Vegetables, including legumes/beans, and fruit should be eaten intheir whole food forms to maximise the impact on a range of health benefits. Fruit should mostly be eaten freshand raw because of the low fibre content of fruit juice and the high energy density and ‘stickiness’ (which mayhave implications for dental caries) of dried fruit. 9 Some vegetables are suitable to eat raw, while it is best to cookothers to make them more palatable and digestible. Dried legumes should be cooked. Some processed fruits andvegetables, such as those that are canned or frozen in natural juices, are nutritious alternatives as long as they areproduced without added salt, sugar (including concentrated fruit juice) or fat (in particular saturated fat).Different fruits and vegetables are rich in different nutrients. <strong>For</strong> example, green leafy and Brassica (or cruciferous)vegetables are generally high in folate, and starchy vegetables are a good source of complex carbohydrates.Legumes/beans provide a valuable and cost-efficient source of protein, iron, some essential fatty acids, solubleand insoluble dietary fibre and micronutrients for all Australians, but particularly for those consuming vegetarianor vegan meals. 9The health benefits of consuming diets high in vegetables, including legumes/beans, and fruit have been reportedfor decades and are consistently recognised in international dietary guidelines. 35,36,198,360 However fruit andvegetable access, affordability and availability may be difficult for some groups. Further discussion can be foundin Appendix A.2.2.2 The evidence for consuming ‘plenty of vegetables’The scientific evidence for the health benefits of consuming vegetables, including legumes/beans, has beenstrong for several decades and has generally continued to strengthen over recent years, particularly the evidencefor a protective effect against cardiovascular disease. 361 Recent research on vegetable intake and cancer hasfocused more on investigating the health effects of consuming different subgroups of vegetables on site-specificcancers than the effect of total vegetable intake. There is strengthened evidence of the beneficial effects of intakeof various non-starchy vegetables in reducing risk of some site-specific cancers. High dietary intakes of somestarchy vegetables may help explain the weaker association between total vegetable intake and many site-specificcancers. There is also greater clarity on the quantity of vegetables to produce beneficial health effects, plusincreasing evidence of a protective effect against a number of chronic diseases for consumption of vegetablesand fruit when considered together (see Appendix J).Although serve sizes of vegetables differed between studies considered in the Evidence Report, 33 the evidencestatements presented in Table 2.2 are based on the Australian standard serve size of 75g.36EAT FOR HEALTH – australian dietary guidelinesNational <strong>Health</strong> and Medical Research Council
Table 2.2: Evidence statements for consuming ‘plenty of vegetables’Evidence statementConsumption of each additional daily serve of vegetables is associated with a reduced risk of coronary heart disease.Consumption of vegetables is associated with reduced risk of stroke.Consumption of vegetables is associated with reduced risk of weight gainConsumption of vegetables is associated with a reduced risk of oral and nasopharyngeal cancers.GradeBBCCConsumption of preserved vegetables is associated with increased risk of oral and nasopharyngeal cancer.Consumption of one to two serves per day of tomato is associated with a reduced risk of prostate cancer.Consumption of more than one serve per week of spinach is associated with reduced risk of colorectal cancer.Consumption of cruciferous vegetables is associated with reduced risk of lung cancer.CCCCGuideline 2Notes: Grades – A: convincing association, B: probable association, C: suggestive associationIncludes evidence statements and gradings from the Evidence Report (literature from years 2002–2009). Does not include evidence fromother sources, such as the 2003 edition of the dietary guidelines (in which individual studies were classified according to their design aslevel I, II or III but overall grades for relationships were not derived), although these sources have been used to inform these <strong>Guidelines</strong>.Grade C evidence statements showing no association and all Grade D statements can be found in Appendix E.Cardiovascular disease, type 2 diabetes and excess weight• Cardiovascular disease: It is probable that each additional daily serve of vegetables is associated witha reduced risk of coronary heart disease (Grade B; Evidence Report, Section 2.1). 362-367 It is probablethat consumption of vegetables is associated with a reduced risk of stroke (Grade B; Evidence Report,Section 2.4). 368,369 The protective effect is stronger at higher intakes.• Type 2 diabetes: Recent evidence suggests that consumption of vegetables does not appear to be directlyassociated with the risk of type 2 diabetes (Grade C; Evidence Report, Section 2.3). 370-372 This supportsthe inconsistent findings described in other studies for fruit and vegetables considered together and forfruit alone. 371,372 However, as there is a strong relationship between type 2 diabetes and body weight(see Chapter 1), the association between consumption of vegetables and reduced risk of excess weightgain (see below) suggests longer-term studies may be required to further investigate potential effects.• Excess weight: Recent evidence suggests that consuming vegetables is associated with a reduced riskof weight gain (Grade C; Evidence Report, Section 2.2). 200-203,207Cancer• Oral, nasopharyngeal and oesophageal: Evidence suggests that consuming vegetables is associated witha reduced risk of oral and nasopharyngeal cancers (Grade C; Evidence Report, Section 2.10). 373-377 This isconsistent with the findings described by the WCRF report (see Appendix F). 43 However the evidence alsosuggests that consumption of preserved vegetables (salted, dried, fermented or pickled) is associated withincreased risk of these cancers (Grade C; Evidence Report, Section 2.10). 373-377• Other alimentary cancers: It is unclear from recent studies whether there is an association between totalvegetable consumption and risk of other alimentary cancers, however relationships found previously 35,36 stilltend to be present when a longer time frame and different types of vegetables are considered (EvidenceReport, Section 2). Although recent evidence suggests that total consumption of vegetables is not associatedwith reduced risk of oesophageal cancer (Grade C; Evidence Report, Section 2.9), 378-381 evidence from theWCRF report suggests that consumption of non-starchy vegetables probably reduces risk of cancer of theoesophagus (see Appendix F). 43Enjoy a wide variety of nutritious foodsNational <strong>Health</strong> and Medical Research Council37
• Prostate cancer: The evidence suggests that consumption of one to two serves of tomatoes a day isassociated with reduced risk of prostate cancer (Grade C; Evidence Report, Section 2.13). 382,383 This isconsistent with the probable relationship between intake of lycopene-containing foods and probable reducedrisk of prostate cancer described by the WCRF report (see Appendix F). 43• Endometrial, ovarian and pancreatic cancer: The 2003 edition of the dietary guidelines reported a possiblereduction in risk of endometrial and pancreatic cancer with vegetable consumption. 36 However, in more recentstudies there is no evidence to suggest an association between total vegetable consumption and ovarian(Grade C; Evidence Report, Section 2.11) 384,385 or endometrial cancer (Grade C; Evidence Report, Section2.12). 386-388 However, findings from the WCRF report suggest decreased risk of both ovarian and endometrialcancer with consumption of non-starchy vegetables specifically (see Appendix F). 43Guideline 2• Colorectal cancer: The evidence suggests no association between consumption of green leafy, cruciferousvegetables, or carrots, potatoes, beans or lentils and risk of colorectal cancer (Grade C; Evidence Report,Section 2.15). 389 More specific studies suggest that consumption of more than one serve per week of spinachis associated with reduced risk of colorectal cancer (Grade C; Evidence Report, Section 2.15) 389 and evidenceof a suggestive protective effect of intake of non-starchy vegetables on colorectal cancer has been described inthe WCRF report (see Appendix F). 43• Lung cancer: Recent evidence 390 suggests consuming cruciferous vegetables is associated with reducedrisk of lung cancer (Grade C; Evidence Report, Section 2.14). The WCRF report found evidence of a probableassociation with the reduced risk of lung cancer and consumption of vegetables containing carotenoids andalso found evidence suggesting that non-starchy vegetables were protective of lung cancer (see Appendix F). 43This supports the notion that different types of vegetables may have different effects which may help to explainconflicting results seen when all vegetables are grouped together in varying proportions in different studies.• Other cancers: Recent evidence is limited and/or inconclusive for the association regarding other types ofvegetable consumption and gastric, breast, lung and colorectal cancers (Evidence Report, Sections 2.5, 2.6,2.7 and 2.8).Other conditionsThe 2003 edition of the dietary guidelines included evidence of associations between the consumption ofvegetables and some aspects of eye health, including cataracts and macular degeneration. 36 Further evidencewas not available from more recent studies. 3912.2.3 The evidence for consuming ‘plenty of legumes/beans’While evidence of the health benefits of consumption of legumes/beans appears to have strengthened since the2003 edition of the dietary guidelines, the recent research is dominated by studies into the health benefits of soyfoods and products rather than investigations into legumes per se. 1Table 2.3: Evidence statements for consuming ‘plenty of legumes/beans’Evidence statementConsumption of soy foods is associated with reduced total cholesterol and low-density lipoprotein (LDL) cholesterol.Consumption of legume foods is associated with reduced risk of colorectal cancer.GradeCCNotes: Grades — A: convincing association, B: probable association, C: suggestive associationIncludes evidence statements and gradings from the Evidence Report (literature from years 2002–2009). Does not include evidence fromother sources, such as the 2003 edition of the dietary guidelines (in which individual studies were classified according to their design aslevel I, II or III but overall grades for relationships were not derived), although these sources have been used to inform these <strong>Guidelines</strong>.Grade C evidence statements showing no association and all Grade D statements can be found in Appendix E.Recent evidence confirms a protective effect for consumption of legumes, and particularly soy foods, againstseveral risk factors and diseases. However more research is needed to determine the quantities of legume/beans1 The evidence presented here was reviewed with a focus on whole foods, and for this reason studies of soy isolatesare not reported.38EAT FOR HEALTH – australian dietary guidelinesNational <strong>Health</strong> and Medical Research Council
equired to produce health benefits, long-term efficacy, and the relative effect of legume foods, including ofsoy-based foods themselves, as opposed to food components such as isoflavones.Cardiovascular disease, type 2 diabetes and excess weight• Cardiovascular disease: Recent evidence suggests that consumption of soy foods is associated with reducedtotal cholesterol and LDL cholesterol levels, as markers for coronary heart disease risk (Grade C; EvidenceReport, Section 7.4). 392• Type 2 diabetes: No recent studies of the relationship between legumes/beans and type 2 diabetes were identified.• Excess weight: No recent studies of the relationship between legumes/beans and weight loss were identified. 393-395Cancer• Colorectal cancer: Evidence suggests that consuming legumes is associated with reduced risk of colorectalcancer (Grade C; Evidence Report, Section 7.3). 396-400 However, in one study the effect was only significantfor women, 399 as also seen in the recent analysis of the European Prospective Investigation into Cancer andNutrition (EPIC) database. 401 However no evidence of an association between consumption of legumes andcolorectal cancer was described in the WCRF report (see Appendix F). 43Guideline 2• Other cancers: Recent evidence is limited and/or inconclusive for an association regarding legume/beanconsumption and breast or prostate cancer (Evidence Report, Sections 7.1 and 7.2). Similar limited associationshave been described in the WCRF report (see Appendix F). 43 An insufficient number of studies were availableto form an evidence statement on legume/bean consumption and gastric cancer. However the WCRF reportfound limited evidence of a relationship between the consumption of legumes and a decreased risk of gastriccancer (see Appendix F). 43Other conditionsRecent evidence is limited and/or inconclusive regarding an association between consumption of soy foods andbone fracture in post-menopausal women, cerebral and myocardial infarction, and mortality due to cardiovasculardisease and hypertension.2.2.4 The evidence for consuming ‘fruit’Evidence for the health advantages of including fruit in the diet has been strong for decades, but has strengthenedconsiderably recently, particularly for cardiovascular disease. There is also increasing evidence of a protectiveeffect against a number of chronic diseases for consumption of vegetables and fruit when considered together(see Appendix J). Protective effects are increasingly described in quantitative terms, although different serve sizeshave been used in different studies, which make comparison difficult, while findings about dose response are notalways consistent across studies.Table 2.4: Evidence statements for consuming ‘fruit’Evidence statementConsumption of each additional daily serve of fruit is associated with a reduced risk of coronary heart disease.Consumption of at least one and a half serves of fruit a day, ideally two and a half or more, is associated withreduced risk of stroke.Consumption of fruit is associated with a reduced risk of obesity and weight gain.Consumption of fruit is associated with a reduced risk of oral and nasopharyngeal cancerGradeBBCCNotes: Grades – A: convincing association, B: probable association, C: suggestive associationIncludes evidence statements and gradings from the Evidence Report (literature from years 2002–2009). Does not include evidence fromother sources, such as the 2003 edition of the dietary guidelines (in which individual studies were classified according to their design aslevel I, II or III but overall grades for relationships were not derived), although these sources have been used to inform these <strong>Guidelines</strong>.Grade C evidence statements showing no association and all Grade D statements can be found in Appendix E.Enjoy a wide variety of nutritious foodsNational <strong>Health</strong> and Medical Research Council39
The following studies relate primarily to whole fruit, although some included dried fruit and/or fruit juice in theirdefinitions of fruit intake. The evidence regarding fruit juice and excess weight is included under drinks in Section3.3.2. Although serve sizes differed between studies, the evidence statements presented below are based onstandard serve sizes of 150g.Cardiovascular disease, type 2 diabetes and excess weightGuideline 2• Cardiovascular disease: It is probable that consumption of each additional daily serve of fruit is associatedwith a reduced risk of coronary heart disease (Grade B; Evidence Report, Section 1.1). 362-364 Increased protectionof at least 7% was gained from each additional serve of fruit consumed per day. It is probable that consumingat least one and a half serves of fruit a day, ideally two and a half or more, is associated with a reduced risk ofstroke (Grade B; Evidence Report, Section 1.2). 368,369• Type 2 diabetes: The recent evidence suggests that consumption of fruit is not associated with risk of type 2diabetes (Grade C; Evidence Report, Section 1.4). However, as there is a strong relationship between type 2diabetes and body weight (see Chapter 1), the association between consumption of fruit and reduced risk ofexcess weight gain (see below) suggests longer-term studies may be required to investigate potential effects.• Excess weight: The recent body of evidence suggests that consumption of fruit is associated with a reducedrisk of obesity and weight gain (Grade C; Evidence Report, Section 1.3). 200-208Cancer• Alimentary tract cancer: There is emerging evidence that fruit consumption is associated with reduced riskof several types of cancer along the alimentary tract. The recent body of evidence suggests that consumptionof fruit is associated with a reduced risk of oral and nasopharyngeal cancer (Grade C; Evidence Report, Section1.10), 373,374,376,377,402 consistent with findings of a convincing effect on reduced risk of cancers of the mouth, pharynxand larynx and a limited effect on nasopharyngeal cancers described in the WCRF report (see Appendix F). 43• Breast cancer, ovarian cancer and endometrial cancer: Expanding on previous reports, 36 recent evidencenow suggests that consumption of fruit is not associated with risk of breast cancer (Grade C; Evidence Report,Section 1.6), 378,403-407 ovarian cancer (Grade C; Evidence Report, Section 1.11) 384,385 or endometrial cancer (GradeC; Evidence Report, Section 1.12). 386-388,408• Colorectal cancer: Recent evidence suggests that consumption of fruit is not associated with risk of colorectalcancer (Grade C; Evidence Report, Section 1.8). 378,389,402,407,409-411 Further, there is limited evidence to suggest anassociation between the consumption of most fruits by specific type and colorectal cancer (Evidence Report,Section 1.14), 389,411 which expands on earlier studies by the WCRF (see Appendix F). 43• Other cancers: Recent evidence is limited and/or inconclusive for an association regarding fruit consumptionand gastric, lung, oesophageal and pancreatic cancers (Evidence Report, Sections 1.5, 1.7, 1.9 and 1.13).2.2.5 How consuming plenty of vegetables, including different types and colours,and legumes/beans, and fruit may improve health outcomesVarious mechanisms may explain the different health benefits of diets high in vegetables, legumes/beans andfruit. These include potential synergies between the foods as well as the action of specific components foundat high levels in these foods, including vitamins and minerals, various phytochemicals including carotenoids andbioflavonoids (such as anthocyanins and flavonols), as well as dietary fibre and other specific characteristics ofthese foods such as low energy (kilojoules) density.Cardiovascular disease, type 2 diabetes and excess weight mechanismsFood components with anti-oxidant activity including vitamins (vitamin C and E) and phytochemicals in thesefoods may reduce the risk of inflammation and haemostasis, and of cholesterol becoming oxidised and depositedin blood vessels to form the atherogenic plaques that underlie many cardiovascular conditions. 392,412-414 Severalstudies have shown that consumption of vitamin C is associated with reduced risk of cardiovascular disease andstroke, however, other studies have shown no protective effect. 8,415 Plant foods including vegetables and fruitprovide potassium and magnesium, both of which have been linked to lower blood pressure. 8 Importantly, reviewsof the effect of beta-carotene on coronary heart disease suggest that benefits may be related to the componentsof the foods, various antioxidants and micronutrients in these foods or other confounding factors, rather than tothe beta-carotene alone. 41640EAT FOR HEALTH – australian dietary guidelinesNational <strong>Health</strong> and Medical Research Council
Most fruit, vegetables and legumes have a low energy (kilojoule) density and high dietary fibre and water content,providing a plausible mechanism for the association of consumption of these foods with reduced risk of weightgain. Any effect is likely to be mediated through potentially increasing satiety, and also through taking longer tochew, which leads to reducing total energy (kilojoule) intake. 8,9 High dietary fibre intakes have been linked to lowerrates of obesity, type 2 diabetes and cardiovascular disease, mainly through an effect on plasma cholesterol. 8The majority of vegetables are nutrient-dense and low in kilojoules – in particular, green, Brassica and other ‘salad’vegetables are relatively low in energy (kilojoules). 9 However, starchy vegetables are less nutrient-dense and arehigher in kilojoules, but provide a rich source of complex carbohydrates. 9Diets high in fibre and specific complex carbohydrates such as non-starch polysaccharides have been usedwith modest success by people with type 2 diabetes attempting to lose weight. The small effects seen inthese experimental situations might relate to a satiating effect due to the prolongation of food absorption and asmoothing of the blood glucose response after meals. 8In the prevention and dietary control of type 2 diabetes, some vegetables are likely to be of particular valuebecause of their low energy density and relatively high content of dietary fibre, although longer term studiesmay be required to demonstrate effects.Legumes are also believed to confer cardiovascular health benefits because they provide a valuable low saturatedfat source of protein as an alternative to meats, and because of their glycaemic properties and phytoestrogenand isoflavone content. 417,418 These reviews suggest the isoflavone in soy foods may have a role in cholesterolreduction, improved vascular health, preservation of bone-mineral density 417 and anti-oestrogenic, anti-proliferative,pro-apoptotic, anti-oxidative and anti-inflammatory processes. 418 However more research is needed to determinethe relative effect of legumes/beans and soy foods themselves as opposed to isoflavones specifically.Guideline 2Cancer mechanismsThere is no dominant mechanism to explain the protective effect of vegetables, legumes/beans and fruit forsome cancers, and this is complicated by the range of site-specific cancer mechanisms. Some risk factors forcancer, such as oxidising radiation, can operate primarily from childhood or early adult life and antioxidants orother protective constituents of vegetables, including legumes/beans, and fruit may need to be consumedregularly from early life to be effective. 419 Phytochemicals and several vitamins and minerals found in vegetablesand fruit are thought to protect against some cancers by a range of mechanisms. Vegetables in the green leafyand Brassica subgroup are particularly high in folate 9 and inadequate amounts of folate are thought to increasethe risk of cancer by leading to a rise in homocysteine and megaloblastic changes in bone marrow and otherrapidly dividing tissues. 8 Poor folate status is thought to affect the induction of DNA hypomethylation, increasingchromosomal fragility or diminishing DNA repair, as well as increasing secondary choline deficiency, reducing killercell surveillance, and increasing risk of faulty DNA synthesis and metabolism of cancer-causing viruses. 8 Somestudies have suggested that folate, primarily from fruit and vegetables, may be more effective in reducing cancerrisk among those with habitual high alcohol intake. 420,421Several studies have indicated that vitamin C (found in most fruit and vegetables but particularly in citrus fruit,capsicum and tomatoes) is protective against cancer, whereas others have not found convincing evidence ofthis. 8 Lycopenes found in tomatoes are thought to be protective of prostate cancer, particularly when tomatoesare cooked in olive oil. 43 Carotenoids found predominantly in orange, red and yellow fruit and vegetables are alsothought to be associated with maintenance of immune function. 8 Dithiolthiones and isothiocyanates (found inBrassica or cruciferous vegetables) and allyl sulphides (found in Allium vegetables) have been shown to stimulatedetoxification processes. 36 The anti-inflammatory action of other phytochemicals, such as flavonoids, is alsothought to be important in reducing cancer risk. 422 Potatoes are not as rich in phytochemicals as other types ofvegetables, and this may help explain the weaker association with decreased cancer risk and consumption ofstarchy vegetables compared with other vegetables. 43 There is increasing evidence that whole foods are moreeffective in reducing risk of cancer than specific vitamin and mineral supplements, and that some supplementsmay actually increase risk of cancer. 423,424Localised contact with phytochemicals may be an important factor in the aetiology of epithelial cancers of thealimentary system (oral, oesophagus, stomach and bowel). Proposed protective mechanisms include: 8,425• the reduced formation of cancer-promoting substances in the gastrointestinal tract due to antioxidant activity• the part played by phytochemicals and micronutrients in the detoxification of carcinogenic substances• functions relating to the containment and destruction of existing cancer cells by means of a variety ofphysiological processes and improved immunological activity against cancer cells.Enjoy a wide variety of nutritious foodsNational <strong>Health</strong> and Medical Research Council41
<strong>Dietary</strong> fibre from vegetables and fruit is thought to reduce the risk of some cancers. 8 However, although aprobable decreased risk of colorectal cancer with intake of foods containing dietary fibre has been described inthe WCRF report (see Appendix F), 43 only one of the human trials 426 has shown any benefits of high fibre intakesper se on colon cancer or on markers of the risk of colon cancer. It may be that the dietary fibre component ofthese foods is not solely responsible for any apparent protective effect. 82.2.6 Practical considerations: enjoy plenty of vegetables, including different types andcolours, legumes/beans, and enjoy fruitGuideline 2Consuming at least five serves of vegetables per day (75g per serve) is recommended for Australian adults,while amounts recommended for children and adolescents depend on their age and sex (see Tables 2.5 and2.6). The most recent dietary surveys 12,45 show that consumption of vegetables and legumes/beans in Australiais generally less than half that recommended for adults and children, and the mix of vegetables consumed alsoneeds to be addressed. Based on the most recent consumption data, to meet the recommended food groupintakes, most adults should increase their total consumption of vegetables by more than 30%. 9 A 30% increasein intake of green and Brassica vegetables, 140% in red- and orange-coloured vegetables and 90% in othervegetables would be optimal to increase the variety of vegetables consumed. 9Consuming at least two serves of fruit per day (150g per serve) is recommended for adults, while amountsrecommended for children and adolescents depend on age and sex (see Tables 2.5 and 2.6). The most recentdietary surveys 12,45 show that fruit consumption should approximately double to meet recommended intakes. 9The companion resources provide more detailed information on the recommended number of serves and servesizes of vegetables, legumes/beans and fruit required for different omnivore population groups. Fruit and vegetablesdo not need to be perfectly shaped or unmarked to provide nutritional value. Discussion of dietary patterns and theenvironment is included in Appendix G.Table 2.5: Minimum recommended number of serves of vegetables, legumes/beans and fruit per dayRecommended number of serves per day*Age (years) Vegetables and legume/beans FruitBoys 2–3 2 ½ 14–8 4 ½ 1 ½9–11 5 212–13 5 ½ 214–18 5 ½ 2Men 19–50 6 251–70 5 ½ 270+ 5 2Girls 2–3 2 ½ 14–8 4 ½ 1 ½9–11 5 212–13 5 214–18 5 2Pregnant (up to 18 years) 5 2Breastfeeding (up to 18 years) 5 ½ 2Women 19–50 5 251–70 5 270+ 5 2Pregnant (19–50 years) 5 2Breastfeeding (19–50 years) 7 ½ 2Note: *Additional amounts of the Five Food Groups or unsaturated spreads and oils or discretionary choices are needed only by peoplewho are taller or more active to meet additional energy requirements.Source: Food Modelling System. 942EAT FOR HEALTH – australian dietary guidelinesNational <strong>Health</strong> and Medical Research Council
Table 2.6: Standard serve size equivalents for vegetables, legumes/beans and fruitFood groupVegetables and legumes/beansServe sizes (100 –350kJ)75g (½ cup) cooked green or Brassica or cruciferous vegetables75g (½ cup) cooked orange vegetables75g (½ cup) cooked dried or canned beans, chickpeas or lentils, no added salt75g (1 cup) raw green leafy vegetablesFruit75g starchy vegetables (e.g. ½ medium potato, or equivalent of sweet potato, taro, sweet cornor cassava)75g other vegetables e.g. 1 medium tomato150g (1 piece) of medium-sized fruit e.g. apple, banana, orange, pear150g (2 pieces) of small fruit e.g. apricots, kiwi fruit, plumsGuideline 2150g (1 cup) diced, cooked or canned fruit*125ml (½ cup) 100% fruit juice* #30g dried fruit* # e.g. 4 dried apricot halves, 1½ tablespoons of sultanasNotes: *Preferably with no added sugar#Only to be used occasionally as a substitute for other foods in the groupSource: Food Modelling System. 9Vegetables and fruit should be stored and prepared properly to maintain nutrient status. Vegetables should bewashed to remove microbes and surface debris, and overcooking should be avoided. Root vegetables should bepeeled or scrubbed (see Chapter 5). Tinned and/or frozen varieties are nutritious alternatives to raw produce.Pregnant and breastfeeding womenFruit and vegetable consumption before and during pregnancy makes an important contribution to healthoutcomes for women and their children. Many women may need to increase their current consumption of thesevaluable foods as a prospective cohort study found that only about half of pregnant women may be consumingthe recommended amounts of fruits and vegetables. 427 While fruit and vegetables are valuable foods for pregnantwomen, pre-prepared or pre-packaged cut fruit and vegetables should be avoided due to risk of listeriosis. 349,428InfantsPureed and mashed vegetables, including legumes/beans, and fruit are important in the diets of infants fromaround 6 months of age. Choices should be varied to ensure adequate energy (kilojoule) and nutrient intake.Fruit juice is not recommended for infants. When additional liquids are required for infants, water is preferable.All acidic drinks, including juices, increase the risk of dental erosion. 351,429By 12 months of age, infants should be consuming a wide variety of foods consumed by the rest of the family,having progressed from pureed or mashed foods to foods that are chopped into small pieces. Care should betaken early on to choose foods of a suitable texture. Hard pieces of foods, such as some raw vegetables and nuts,should be avoided as they can cause choking. A variety of tastes and textures may be more appealing. As with allfoods, some vegetables may need to be introduced more than ten times before being accepted. 430 Whole fruit ispreferable to fruit juice due to its higher fibre content.Enjoy a wide variety of nutritious foodsNational <strong>Health</strong> and Medical Research Council43
Children and adolescentsThe recommended quantities of vegetables and fruit intakes for children and adolescents vary depending on theirage and sex. 9 To meet the dietary recommendations, children and adolescents need to approximately double theiroverall vegetable consumption 9 and increase the overall variety of vegetables consumed. Current fruit intakes by2–3 year olds are close to the recommended levels but need to increase proportionately with age.A wide variety of different coloured, textured and tasting vegetables and fruit, both fresh and cooked, should beoffered frequently to toddlers and preschoolers. Parents and carers can provide model behaviour by consuming awide range of vegetables and fruit.Guideline 2Children and adolescents should be encouraged to select a wide variety of vegetables and fruit, at meal timesand between meals. In recent years, most Australian states and territories have improved the nutritional qualityof food supplied at schools through strategies incorporating a colour-coded system in which vegetables, includinglegumes/beans, and fruit are classified ‘green’ with the recommendation that children eat plenty. 431-438 Fruit can be‘fast food’ to help satisfy increasing appetites. Unless prescribed by a dietitian, special diets that restrict intakeof any fruit or vegetables should be avoided for children and adolescents. The intake of energy-dense hot friedpotato chips as a snack or with meals should be limited.Older peopleAlthough most of the emphasis is on the value of dietary patterns rich in vegetables and fruit throughout life, thereis still benefit in adopting such habits later in life. In general, older adults tend to have higher intakes of fruit andvegetables than younger adults. 45 Due to poor dentition, softer textured or cooked vegetables and fruit may bepreferable for some older people. Tinned and/or frozen varieties are nutritious alternatives to raw produce.Aboriginal and Torres Strait Islander peoplesVery low intakes of vegetables and fruit have been described among Aboriginal and Torres Strait Islander groupsin urban and rural communities. 30,353,439,440 Availability of quality fresh produce can be a particular problem inmany remote areas. 28,317,356 Frozen and canned vegetables and fruit, plus available traditional plant foods, arenutritious alternatives.2.3 Enjoy grain (cereal) foods, mostly wholegrain and/or highcereal fibre varieties2.3.1 Setting the sceneFoods originating from grains (cereals) include those from wheat, oats, rice, barley, millet and corn. They rangefrom highly nutrient-dense wholegrain breads and grain (cereal) foods such as oats, to lower-nutrient dense whiterice, white bread, pasta and noodles. Excluded are refined grain (cereal) food products with high levels of addedsugar, fat (in particular saturated fat) and/or salt/sodium, such as cakes.Key nutrients in wholegrain foods include starch (complex carbohydrate), protein, dietary fibre, B group vitamins,vitamin E, iron, zinc, magnesium and phosphorus. Other protective components are fermentable carbohydrates,oligosaccharides, flavonoids, phenolics, phytoestrogens, lignans, protease inhibitors, saponins and selenium. 35,36In Australia it is mandatory for wheat flour used in bread making to be fortified with folic acid and thiamin, and forthe salt used to be iodised. 44144EAT FOR HEALTH – australian dietary guidelinesNational <strong>Health</strong> and Medical Research Council
2.3.2 The evidence for consuming ‘grain (cereal) foods, mostly wholegrain and/orhigh cereal fibre varieties’The evidence for the association of grain (cereal) foods, mostly wholegrain and/or high cereal fibre varieties,with reduced risk of cardiovascular disease, type 2 diabetes and excess weight gain has strengthened since the2003 edition of the dietary guidelines.The literature is difficult to interpret because studies use varied definitions of ‘wholegrain’. FSANZ applies theterm to products that use every part of the grain (cereal) including the outer layers, bran and germ even if theseparts are separated during processing and regardless of whether the grain (cereal) is in one piece or milled intosmaller pieces. 441 In the literature review for these <strong>Guidelines</strong>, the most commonly used definition was found tobe that of Jacobs et al 1998, 442 who defined wholegrain foods as those containing 25% or more of wholegrains.Other studies have included bran cereals as part of the definition of wholegrain and others only examined certaintypes of grain (cereal) food such as oats.Table 2.7: Evidence statements for consuming ‘grain (cereal) foods, mostly wholegrain and/or high cereal fibre varieties’Evidence statementGradeGuideline 2Consumption of cereal foods (especially wholegrains and those with fibre from oats or barley) is associated with a reduced riskof cardiovascular disease in adults.Consumption of one to three serves per day of wholegrain cereals is associated with a reduced risk of cardiovascular disease.Consumption of cereal foods (especially three serves a day of wholegrains) is associated with reduced risk of type 2 diabetesConsumption of three to five serves per day of cereal foods (mainly wholegrain) is associated with a reduced risk of weight gain.Consumption of one to three serves per day of cereals high in fibre is associated with reduced risk of colorectal cancer in adults.BBBBCNotes: Grades – A: convincing association, B: probable association, C: suggestive associationIncludes evidence statements and gradings from the Evidence Report (literature from years 2002–2009). Does not include evidence fromother sources, such as the 2003 edition of the dietary guidelines (in which individual studies were classified according to their design aslevel I, II or III but overall grades for relationships were not derived), although these sources have been used to inform these <strong>Guidelines</strong>.Grade C evidence statements showing no association and all Grade D statements can be found in Appendix E.Cardiovascular disease, type 2 diabetes and excess weight• Cardiovascular disease: There is evidence of a probable association between the consumption of grain (cereal)foods (especially wholegrains and those with fibre from oats or barley) and a reduced risk of cardiovasculardisease in adults (Grade B; Evidence Report, Section 6.3). 226,443-458 Almost all the high level trials were conductedwith oats, with the evidence of beneficial lowering of levels of LDL and total cholesterol levels. The protectiveeffect was noted with between one to three serves per day of wholegrain foods (predominantly oats).• Type 2 diabetes: There is evidence of a probable association between the consumption of grain (cereal) foods(especially wholegrains) and reduced risk of type 2 diabetes (Grade B; Evidence Report, Section 6.7). 445,457,459-466The evidence supports three serves per day of wholegrain foods conferring between 21% and 42% reductionin risk of type 2 diabetes.• Excess weight: There is evidence of a probable association between consumption of three to five serves perday of grain (cereal) foods (mainly wholegrain) and reduced risk of weight gain (Grade B; Evidence Report,Section 6.6). 215,220-229Enjoy a wide variety of nutritious foodsNational <strong>Health</strong> and Medical Research Council45
Cancer• Colorectal cancer: There is recent evidence suggesting that consumption of one to three serves of cerealshigh in dietary fibre per day is associated with reduced risk of colorectal cancer in adults (Grade C; EvidenceReport, Section 6.2). 397,467-471 Although previously the WCRF report noted a probable relationship, it recentlyreviewed the evidence and found it convincing that fibre-rich foods offer protection against colorectal cancer(see Appendix F). 43,472 This is also supported by a recent systematic review and dose response meta-analysisof prospective studies showing that three serves of wholegrain and high fibre cereals per day reduced the riskof colorectal cancer. 473• Other cancers: Recent evidence is inconclusive for an association regarding the consumption of grain (cereal)foods and risk of other cancers in adults (Evidence Report, Section 6.1).Guideline 22.3.3 How consuming grain (cereal) foods, mostly wholegrain and/or high cerealfibre varieties may improve health outcomesMuch depends on which wholegrain is being considered. 474 <strong>For</strong> example, oat ß-glucan binds with bile acids, sothe liver breaks down more cholesterol to maintain a supply of bile acids. Wheat does not contain these solublefibres. Also, the slow rate of glucose delivery from oats reduces the requirement for insulin. 475 The slower rate ofabsorption created by the presence of dietary fibre from some grain (cereal) foods can also influence appetite.<strong>For</strong> example, oat ß-glucan has been shown to have effects on postprandial cholecystokinin levels, decreasedinsulin response and extended subjective satiety in overweight adults. 476 Other sources of dietary fibre, suchas psyllium may act in a similar fashion. Grain (cereal) foods also contain starch (complex carbohydrate) thatmay be resistant to digestion in the small intestine (resistant starch) and may help to provide a more protectiveenvironment in the colon, particularly in the context of meals. 477 Note that as some degree of processing isapplied to most grains (cereals) to aid digestion, the effects can be significantly influenced by the technologyapplied in processing and cooking. 478Because wholegrains contain more nutrients and phytochemicals, concentrated in the bran and germ, 479 they arelikely to have greater effects than refined grains (cereals). Wholegrains contain phenolic compounds with stronganti-oxidant capacity that may be protective against processes involved in the pathology of type 2 diabetes,cardiovascular disease and cancer. 480 Choosing wholegrain options may also assist with satiety and help in notover consuming food beyond energy (kilojoule) requirements.The 2003 edition of the dietary guidelines discussed the glycaemic index (GI) of individual foods as a physiologicallybased classification of carbohydrate-containing foods according to their potential to raise blood glucose. 36Various factors such as the particle size of milled grains (cereals), the ratio of amylose to amylopectin, the degreeof starch gelatinisation and the presence of other food components such as viscous soluble fibres, fat, proteinand organic acids may affect the GI value of a food and may limit practical application. 199 Additionally, the accuracywith which published values can be used to predict GI when foods are eaten together as a meal is limited. 481Lower GI diets may assist in the management of type 1 and type 2 diabetes but are not associated with weightloss (see Chapter 1). 36,198 Further research on GI and health outcomes may be required to investigate otherpotential associations.The 2003 edition of the dietary guidelines also noted that consumption of dietary fibre assists in maintaining thehealth and function of the digestive system, for example in preventing constipation. 35,362.3.4 Practical considerations: enjoy grain (cereal) foods, mostly wholegrain and/or highcereal fibre varietiesConsuming at least four to six serves of grain (cereal) foods, mostly wholegrain and/or high cereal fibre varieties,per day is recommended for Australian adults, while the amount recommended for children and adolescentsdepends on their age and sex (see Tables 2.8 and 2.9), ranging from four serves a day for 2–8 year olds to sevena day for older adolescents.The companion resources provide more detailed information on the recommended number of serves and servesizes of grain (cereal) foods required for different population groups. Discussion of dietary patterns and theenvironment is included in Appendix G.46EAT FOR HEALTH – australian dietary guidelinesNational <strong>Health</strong> and Medical Research Council
Table 2.8: Minimum recommended number of serves of grain (cereal) foods per day, mostly wholegrain and/or high cerealfibre varietiesAge (years)Number of serves*Boys 2–3 44–8 49–11 512–13 614–18 7Men 19–50 651–70 670+ 4 ½Girls 2–3 44–8 49–11 412–13 514–18 7Pregnant (up to 18 years) 8Breastfeeding (up to 18 years) 9Women 19–50 6Guideline 251–70 470+ 3Pregnant (19–50 years)8 ½Breastfeeding (19–50 years) 9Note: *Additional amounts of the Five Food Groups or unsaturated spreads and oils or discretionary choices are needed only by peoplewho are taller or more active to meet additional energy requirements.Source: Food Modelling System. 9Table 2.9: Standard serve size equivalents for grain (cereal) mostly wholegrain and/or high cereal fibre varietiesFood groupGrain (cereal) foods,mostly wholegrain and/orhigh cereal fibre varieties,such as breads, cereals,rice, pasta, noodles,polenta, couscous,oats, quinoa and barleyServe sizes (500kJ)1 slice of bread or ½ a medium roll or flat bread (40g)½ cup cooked rice, pasta, noodles, barley, buckweheat, semolina, polenta, bulgur or quinoa (75–120g)½ cup cooked porridge (120g), 2/3 cup wheat cereal flakes (30g) or ¼ cup muesli (30g)3 crispbreads (35g)1 crumpet (60g) or 1 small English muffin or scone (35g)¼ cup flour (30g)Source: Food Modelling System 9Enjoy a wide variety of nutritious foodsNational <strong>Health</strong> and Medical Research Council47
Based on current consumption data, to meet recommended food group intakes 9 adults would require a 30%increase in grain (cereal) foods, comprising a 160% increase in current wholegrain consumption and a 30%decrease in refined grain (cereal) food consumption. <strong>For</strong> children over the age of 4 years, 20–60% more wholegrainfoods and 10–30% less refined cereal foods would be required to meet recommended intakes. 9 Refined grain(cereal) food products with high levels of added sugar, fat (in particular saturated fat) and/or salt, such as cakes andbiscuits, are classified as discretionary foods and are not included in the grain recommendation. While these canbe included in small amounts in Total Diets with higher energy (kilojoules) allowances, for the Australian populationas a whole their intake would need to be reduced substantially.Guideline 2The suite of models which informed the update of the Australian Guide to <strong>Health</strong>y <strong>Eat</strong>ing 9 and companion resourcesallows for variation in choice and amount of grain (cereal) foods to accommodate a range of cuisines. A variety ofgrain (cereal) food choices allow for different forms of dietary fibre and starches (complex carbohydrates). Reading thelabels on processed grain (cereal) foods such as rice and pasta is important, to check that added sodium, sugar and/orsaturated fat are kept to a minimum.Pregnant and breastfeeding womenAs periconceptional folic acid intake helps protect against neural tube defects in the developing foetus, 482 themandatory fortification of flour used for bread making in Australia with folic acid 483 provides an additional reasonfor women of reproductive age to consume bread. However, for women planning a pregnancy and during the first3 months of pregnancy, a daily folic acid supplement that contains at least 400 µg of folic acid is recommended inaddition to eating foods that are naturally rich in folate or are fortified with folic acid. 483,484Pregnant and breastfeeding women have increased iodine requirements. As most leavened bread in Australia ismade with iodised salt, this contributes to total iodine intake. However, this does not replace the need for iodinesupplements (150 µg/day) for women planning a pregnancy, throughout pregnancy and while breastfeeding. 323InfantsIron-fortified cereals can be one of the first foods offered to infants at around 6 months of age.Older peopleA high intake of wholegrain forms of grain (cereal) foods may not be well tolerated if there is a problem withdentition. Softer varieties such as finely milled wholemeal bread and/or other fibre-enriched foods maybe suitable.People with vegetarian or vegan dietary patternsWholegrain foods are valuable sources of nutrients for the whole population but particularly important invegetarian and vegan diets as a source of iron and zinc.2.4 Enjoy lean meats and poultry, fish, eggs, tofu, nuts andseeds, and legumes/beans2.4.1 Setting the sceneLean meats and poultry, fish, eggs and plant-based alternatives such as tofu, legumes/beans, nuts and seeds arean important component of Australian cuisine, culture and lifestyle. The ‘lean meats and alternatives’ food groupis diverse, both nutritionally and biologically. The foods in this group have traditionally been seen as ‘protein-rich’,but they also provide a wide variety of other nutrients that may be more important in the typical high-proteinAustralian diet. Important nutrients include iodine, iron, zinc and other minerals, vitamins, especially B 12, andessential fatty acids including omega-3 long chain polyunsaturated fatty acid (omega-3 LCPUFAs). All indigenousAustralian fish contain omega-3 LCPUFAs. 485,486 Grass-fed meats, poultry and some eggs are also sources of theseessential fatty acids. Evidence of the health benefits of lean meats and alternatives is consistently recognised ininternational dietary guidelines. 35,36,198,36048EAT FOR HEALTH – australian dietary guidelinesNational <strong>Health</strong> and Medical Research Council
Processed and cured meats can be high in added salt and saturated fat and are not recommended as substitutesfor unprocessed meat. These foods fit in the ‘discretionary foods’ category. Lean poultry and eggs can be includedin the diet within the overall recommended quantities for this whole food group. 9 Eggs are an alternative to meat,a relatively inexpensive source of protein and are versatile foods. Note that although pork is not considered redmeat for marketing purposes in Australia, it is classified as red meat in the international literature, and so has beenconsidered as red meat for the purposes of these <strong>Guidelines</strong>. 9Fish and other seafood are central foods in the cuisines of many traditional cultural and religious groups, and arepopular foods in Australian society. Fish is nutritious, providing energy (kilojoules), protein, selenium, zinc, iodineand vitamins A and D (some species only) as well as omega-3 LCPUFAs. Evidence of the health benefits of fishconsumption is consistently recognised in international dietary guidelines. 35,36,198,360Nuts and seeds are rich in energy (kilojoules) and nutrients, reflective of their biological role in nourishingplant embryos to develop into plants. In addition to protein and dietary fibre, they contain significant levels ofunsaturated fatty acids and are rich in polyphenols, phytosterols and micronutrients including folate, severalvaluable forms of vitamin E, selenium, magnesium and other minerals. They are nutritious alternatives to meat,fish and eggs, and play an important role in plant-based, vegetarian and vegan meals and diets. 9Legumes/beans, including lentils, tofu and tempeh, provide a valuable and cost-efficient source of protein, iron,some essential fatty acids, soluble and insoluble dietary fibre and micronutrients. They are valuable inclusions inany diet, and are especially useful for people who consume plant-based meals. 9Guideline 22.4.2 The evidence for consuming ‘lean meats and poultry, fish, eggs, tofu, nuts andseeds, and legumes/beans’In the following studies, serve sizes of the different foods are as included in the companion resources (see alsoTable 2.12, Section 2.4.4).Table 2.10: Evidence statements for consuming ‘lean meats and poultry, fish, eggs, tofu, nuts and seeds, and legumes/beans’Evidence statementConsumption of greater than 100–120 g/day red meat per day is associated with an increased risk of colorectal cancer.Consumption of fish more than once per week is associated with a reduced risk of developing dementia in older adults.Consumption of red meat is associated with increased risk of renal cancer.Consumption of at least two serves a week of fish is associated with reduced risk of mortality from cardiovascular disease,and with reduced incidence of cardiovascular disease.Consumption of fish at least twice a week is associated with a reduced risk of stroke.Consumption of fish two or more times per week is associated with reduced risk of age-related macular degeneration.Consumption of nuts (65–110g per day) is associated with a reduction in serum cholesterol.GradeBBCCCCCNotes: Grades – A: convincing association, B: probable association, C: suggestive associationIncludes evidence statements and gradings from the Evidence Report (literature from years 2002–2009). Does not include evidence fromother sources, such as the 2003 edition of the dietary guidelines (in which individual studies were classified according to their design aslevel I, II or III but overall grades for relationships were not derived), although these sources have been used to inform these <strong>Guidelines</strong>.Grade C evidence statements showing no association and all Grade D statements can be found in Appendix E.Lean meatsPast literature reporting on the health benefits and/or risks of consuming meat has been predominantly based onstudies investigating the nutrient effects related to (for example) iron, protein or zinc in isolation 36 or the abilityof the body to absorb nutrients rather than looking at the whole food. Since the 2003 edition of the dietaryguidelines, the evidence linking meat consumption and increased risk of disease has strengthened in some areasand remains unclear in others. The evidence is difficult to interpret because of widely varying definitions of ‘meat’.Some studies include only unprocessed red meat. Others may include some or all of a variety of processedmeats, including smoked, salted and chemically preserved foods, with meat within dishes such as pizza, lasagnaor casseroles variously included or excluded. The poor definitions partly explain the often inconsistent findingsin relation to health effects, with several large cohort studies and some Asian studies failing to adequatelyEnjoy a wide variety of nutritious foodsNational <strong>Health</strong> and Medical Research Council49
disaggregate possibly different effects of unprocessed red meat and processed meats. In particular, the definitionof red meat varies greatly between studies.Cardiovascular disease, type 2 diabetes and excess weightAn insufficient number of recent studies investigating the relationships between consumption of meat andcardiovascular disease, type 2 diabetes and excess weight were identified in the literature review to developevidence statements. A large cohort trial that found modest increases in total mortality, cardiovascular mortalityand cancer mortality with red and processed meat intakes 487 was not included due to lack of clarity over theinclusion of processed meats, liver and sausages with unprocessed red meat.Guideline 2Cancer• Colorectal cancer: There is evidence of a probable association between consumption of red meat and increasedrisk of colorectal cancer (Grade B; Evidence Report, Section 4.7). 43,488-496 The WCRF reported a convincingrelationship between red and processed meat and increased risk of colorectal cancer (see Appendix F). 43Several studies from Asian countries showed no increased risk of colorectal cancer associated with low intakesof red meat such as 27g per day 494 and 42g per day. 492• Renal cancer: The evidence suggests that consumption of red meat is associated with an increased risk ofrenal cancer (Grade C; Evidence Report, Section 4.6).• Bladder and prostate cancer: The evidence suggests that consumption of red meat one to six times perweek is not associated with risk of bladder cancer (Grade C; Evidence Report, Section 4.1). 43,497,498 The evidencesuggests that consumption of red meat is not associated with risk of prostate cancer (Grade C; EvidenceReport, Section 4.3). 43,499,500• Pancreatic cancer: A review of the current evidence suggests that consumption of 30-200 grams of red meat perday is not associated with risk of pancreatic cancer (Grade C; Evidence Report, Section 4.2). 43,501 The WCRF reportalso found limited evidence to suggest red meat increases the risk of pancreatic cancer (see Appendix F). 43• Other cancers: Recent evidence is inconclusive for an association regarding the consumption of red meat andbreast and lung cancer (Evidence Report, Sections 4.4 and 4.5).Given these risks, advice is provided on how much meat can be eaten to maximise the health benefits ofconsuming meat, while minimising the health risks – see Section 2.4.4.Lean poultryCardiovascular disease, type 2 diabetes and excess weightAn insufficient number of recent studies investigating the relationships between consumption of poultry andcardiovascular disease, type 2 diabetes and excess weight were identified in the literature review to developevidence statements.CancerRecent evidence examining an association between poultry consumption and breast or colorectal cancer isinconclusive (Evidence Report, Sections 10.1 and 10.2). The WCRF report also concluded that the evidence is toolimited in amount, consistency or quality to draw any conclusions about the relationship between poultry andcancer risk (see Appendix F). 43FishThe evidence regarding the health benefits of fish has strengthened since the 2003 edition of the dietaryguidelines. People who regularly consume diets high in fish tend to have lower risks of a range of conditions,including cardiovascular disease, stroke, and macular degeneration, and dementia in older adults.Early literature focused on evidence indicating that fish oils (omega-3 LCPUFAs) provided specific health benefitsfor brain development and function and cardiovascular health, and extrapolated this to fish as the predominantfood containing these fatty acids. 36 Recent research continues to be dominated by pharmacological studies of theeffects of nutrients derived from fish, particularly delivered in fish oils. The evidence obtained from the literatureconsiders relationships with the consumption of fish per se, so studies of fish oil or omega-3 supplements are notreported in the evidence statements below. However, the overall chapter examines evidence relating to omega-3LCPUFAs, bearing in mind that these fats can also be delivered in foods other than fish.50EAT FOR HEALTH – australian dietary guidelinesNational <strong>Health</strong> and Medical Research Council
The evidence provided below for health benefits relates consistently to fish in the form of finfish from marine orfreshwater sources, either farmed or wild. Few studies have investigated the effects of other types of seafood.As for red meat, the distinction between different preparation methods and different fish types is not always welladdressed in the literature and may contribute to a lack of consistency in some instances.Cardiovascular disease• Incidence and mortality: Evidence suggests that consuming at least two serves of fish per week isassociated with reduced incidence of cardiovascular disease (particularly myocardial infarction) (Grade C;Evidence Report, Section 9.1) 502-505 and with reduced risk of mortality from cardiovascular disease (Grade C;Evidence Report, Section 9.1). 502,504,506-513• Stroke: The evidence suggests that consumption of fish at least twice a week is associated with a reduced riskof stroke (Grade C; Evidence Report, Section 9.5). 505,514-516• Other cardiovascular conditions: Only a small number of case-control and cohort studies are available, withinconsistent results, to examine the relationship between fish consumption and the incidence of heart failure,atrial fibrillation and high blood lipids.Guideline 2CancerEvidence of an association between fish consumption and breast, colorectal, prostate and renal cancer was examinedhowever no conclusive associations could be drawn (Evidence Report, Sections 9.6, 9.7, 9.8 and 9.9).Other conditions• Dementia: The recent body of evidence demonstrates that it is probable that the consumption of fish morethan once a week is associated with a reduced risk of developing dementia in older adults (Grade B; EvidenceReport, Section 9.2). 503,517-524• Depression: The recent evidence suggests that consumption of at least one serve of fish per week is notassociated with reduced risk of depression (Grade C; Evidence Report, Section 9.3). 525-529• Macular degeneration: The recent evidence suggests that eating fish two or more times a week is associatedwith reduced risk of age-related macular degeneration (Grade C; Evidence Report, Section 9.4). 530EggsSince the 2003 edition of the dietary guidelines, the evidence associating egg consumption with health outcomeshas not changed greatly (Evidence Report, Section 11). There do not appear to be any increased health risksassociated with consumption of eggs. 531-533 There is recent evidence to suggest that consumption of eggs everyday is not associated with increased risk of coronary heart disease (Grade C; Evidence Report, Section 11.1). 455,534-551Nuts and seedsConsumption of nuts and seeds may help reduce the risk of heart disease and is not associated with weightgain if total energy (kilojoule) intake is controlled. 230-235 Since the 2003 edition of the dietary guidelines, theevidence for the benefits of consumption of nuts and seeds on heart disease has been shown to be relatedto favourable effects on serum cholesterol. The evidence on lack of association with weight gain is a newdevelopment (Grade C; Evidence Report, Section 8.1). 230-235Cardiovascular disease and excess weight• Cardiovascular disease: Evidence suggests that consumption of nuts (65–110g per day) is associated witha reduction in serum cholesterol, a surrogate marker for cardiovascular disease (Grade C; Evidence Report,Section 8.2). 231,232,234,235,552 Results of two large cohort studies report that substituting one serve of nuts for redmeat per day results in a significant reduction (19–30%) in cardiovascular disease risk. 553,554• Excess weight: Evidence suggests that the consumption of nuts (65–110g per day) does not lead to weightgain, at least in the short term (Grade C; Evidence Report, Section 8.1). 230-235Enjoy a wide variety of nutritious foodsNational <strong>Health</strong> and Medical Research Council51
CancerNo recent studies investigating the association of consumption of nuts and seeds with cancer were identified.Legumes/beansFew studies on legumes/bean foods, other than soy foods, were identified in the literature review to inform thereview of these dietary guidelines. <strong>For</strong> the evidence regarding legumes/beans, see Evidence Report, Section 7.Guideline 22.4.3 How consuming lean meats and poultry, fish, eggs, tofu, nuts and seeds,and legumes/beans may improve health outcomesThis is such a broad and diverse group of foods that a variety of possible mechanisms may influence the effectsof their consumption.Smoked, salted and chemically preserved foods have properties that may be responsible for increased healthrisks. Endogenous formation of N-nitroso compounds has been suggested as a possible link between red meatand colorectal cancer 555,556 or that inflammatory effects of haem iron may be relevant 557 and further research isoccurring. As with other areas of diet and disease risk, an individual’s dietary pattern may be more relevant thana direct effect from a single component. 558,559It has been suggested that components of meat such as saturated fats, or other dietary and lifestyle factorsassociated with meat intake, may be relevant factors for further study. Previous evidence related to the amount ofsaturated fat in red meat and increased risk of cardiovascular disease may not be relevant for lean Australian meats.The protective effect of fish consumption on cardiovascular disease is thought to be mediated through theinfluence of specific nutrients such as omega-3 LCPUFAs. These essential fatty acids exert their physiologicaleffect by altering cell membrane composition, fluidity, receptors and membrane-bound enzymes, gene expressionand eicosanoid production (see Section 3.1.1).Nut consumption provides benefits by enhancing anti-inflammatory processes 560 and lowering serum cholesterolpossibly due to the presence of phytosterols, which reduce cholesterol re-absorption, 561 and/or the effects ofshifting dietary fat quality, notably replacing saturated with unsaturated fat. Nut consumption is also associatedwith increased levels of adiponectin, which has anti-inflammatory and anti-atherogenic properties. 562 Early worksuggests that the delivery of components such as tocopherols and phenolic acids may help to reduce lipidperoxidation and oxidative DNA damage, and there is some indication that walnuts with a relatively high contentof the amino acid L-arginine may have an effect on vasodilation through nitrous oxide pathways. 560 Other nutsare also significant sources of arginine. Proposed mechanisms for effects on weight control include increasedsatiety, increased faecal fat excretion, increased thermogenesis 563 and increased fat oxidation. 5642.4.4 Practical considerations: enjoy lean meats and poultry, fish, eggs, tofu,nuts and seeds, and legumes/beansThe most recent dietary survey data for adults in Australia showed that daily mean consumption of meat,poultry and game was 200g for men and 120g for women. 45 Adult men and women daily consumed 99gand 54g of lean red meat respectively. 45The recommended consumption of lean meats and poultry, fish, eggs, tofu, nuts and seeds and legume/beansfor children and adults is one to three serves a day depending on age and sex (see Tables 2.11 and 2.12).During pregnancy, three to four serves a day are recommended to provide additional iron and zinc.To enhance dietary variety and reduce some of the health risks associated with consuming meat, up to amaximum of 455g per week (one serve [65 g] per day) of lean meats is recommended for Australian adults. 9The companion resources provide more detailed information on the recommended number of serves andserve sizes of lean meats, poultry, fish, eggs, nuts and seeds and legumes/beans required for differentpopulation groups. Discussion of dietary patterns and the environment is included in Appendix G.52EAT FOR HEALTH – australian dietary guidelinesNational <strong>Health</strong> and Medical Research Council
Table 2.11: Minimum recommended number of serves of lean meats, poultry, fish, eggs, tofu, nuts and seeds, andlegumes/beans per dayAge (years)Number of serves*Boys 2–3 14–8 1 ½9–11 2 ½12–13 2 ½14–18 2 ½Men 19–50 351–70 2 ½70+ 2 ½Girls 2–3 1Guideline 24–8 1 ½9–11 2 ½12–13 2 ½14–18 2 ½Pregnant (up to 18 years)Breastfeeding (up to 18 years)3 ½2 ½Women 19–50 2 ½51–70 270+ 2Pregnant (19–50 years)Breastfeeding (19–50 years)3 ½2 ½Note: *Additional amounts of the Five Food Groups or unsaturated spreads and oils or discretionary choices are needed only by peoplewho are taller or more active to meet additional energy requirements.Source: Food Modelling System. 9Table 2.12: Standard serve size equivalents for lean meats, poultry, fish, eggs, tofu, nuts and seeds, and legumes/beansFood groupLean meats andpoultry, fish,eggs, tofu, nutsand seeds, andlegumes/beansServe sizes (500–600kJ)65g cooked lean red meats (e.g. beef, lamb, pork, venison or kangaroo) or ½ cup of lean mince, 2 small chops,2 slices of roast meat (about 90–100g raw weight)80g cooked poultry (about 100g raw weight) e.g. chicken, turkey100g cooked fish fillet (about 115g raw weight) or 1 small can of fish, no added salt, not in brine2 large eggs (120g)1 cup (150g) cooked dried beans, lentils, chickpeas, split peas, or canned beans170g tofu30g nuts or seeds or nut/seed paste, no added salt*Note: *Only to be used occasionally as a substitute for other foods in the group.Source: Food Modelling System. 9Enjoy a wide variety of nutritious foodsNational <strong>Health</strong> and Medical Research Council53
Based on most recent consumption data, to meet recommended intakes, omnivorous adults in Australia would needto consume 40% more poultry, fish, seafood, eggs, tofu, nuts and seeds, and legumes/beans but men consumingan omnivorous diet would need to consume around 20% less lean red meat than currently. 9 <strong>For</strong> children 2–16 yearsof age, around 30–85% more ‘poultry, fish, seafood, eggs, tofu, nuts and seeds, and legumes/beans’ and around25–70% more lean red meat (by replacing fatty cuts of meat) would be required above current intakes to meetrecommendations. Exact quantities depend on age and sex. 9Guideline 2Depending on age and sex, health benefits may be seen with consumption of 1.4 to 2.8 serves (140–280g) of fishper week for adults, with proportionately less for adolescents and children. The most recent dietary survey dataavailable for adults showed that mean weekly consumption of fish and seafood was 168g for men and 119g perweek for women. 45 To meet recommended food group intakes, fish consumption will need to increase by morethan 40%, particularly for men. 9 The extent to which Australian fish populations are sufficient to meet the guidelineadvice needs consideration. Information from the Department of Agriculture, Fisheries and <strong>For</strong>estry shows thatAustralia has become a net importer of fish products over the past decade, and several industry initiatives havenow been developed to address the sustainability of fish stocks in Australia. 565,566 Some imported fish may havelower levels of omega-3 LCPUFAs compared with Australian seafood. 485,486Legumes are not only important in vegetarian and vegan diets but their significant nutrient profile could benefit allAustralians. There is variability in the amount of legumes recommended in the diet; the dietary models developedfor these guidelines include a minimum of two serves per week. 9Previous reported intakes of nuts and seeds in Australia have been very low (only around 4g per day for adults). 45Consumption may have risen since. The dietary models include modest amounts of nuts and seeds. However,because intakes have been low, this would require tripling the intake for children over 8 years of age andincreasing adult intakes substantially, including in omnivore Foundation Diet models. 9Legumes, nuts and seeds can be included in the diet in a variety of ways, including as snacks, in dishes(e.g. added to salads, vegetables, various main course dishes and breakfast cereals) and in food products suchas breads and spreads.Pregnant and breastfeeding womenLean red meat is a good source of protein, iron and zinc for pregnant and breastfeeding women, although rawor undercooked meat, chilled pre-cooked meats, and pâté and meat spreads should be avoided due to risk oflisteriosis (see Chapter 5). 349,428 While meat is a good source of iron, iron deficiency in pregnancy is common inAustralia and iron supplements may be needed. Pregnant women should discuss checking their iron status withtheir doctor.Maternal consumption of fish during pregnancy is likely to have a number of health benefits for women and theirchildren. However the fish should be low in mercury. FSANZ provides guidance for pregnant women on suggestedamounts and frequency of consumption of particular fish species. 567 Pregnant women are advised:• if consuming shark/flake, marlin or broadbill/swordfish, have no more than one serve (100g cooked) perfortnight and no other fish that fortnight• if consuming orange roughy (deep sea perch) or catfish, have one serve (100 g cooked) per week and no otherfish that week. 349,567Pregnant women should avoid eating foods containing raw eggs, because of risk of salmonella. 428Pregnant and breastfeeding women do not need to avoid consuming nuts for fear of causing an allergic reactionin their babies. Only women who are allergic to these foods themselves need to avoid them. 568-572InfantsFoods from the meats and alternatives group are important in the diets of infants over the age of around 6 months.In particular, this group of foods helps meet infants’ increased needs for iron, zinc and protein. The food should beinitially pureed before serving. <strong>For</strong> all infants, special care is required to adequately de-bone fish.Previously nuts were often restricted for infants and children because of the risk of inducing allergy. However thishas not been proven in nutrition studies. 351 The texture should be suitable (e.g. peanut butter/paste). Only childrenover 3 years should be offered whole nuts due to the risk of choking. 35154EAT FOR HEALTH – australian dietary guidelinesNational <strong>Health</strong> and Medical Research Council
Children and adolescentsThe demands of growth increase the need for iron, protein and many nutrients found in this food group.Women of child-bearing ageMenstrual loss doubles the iron requirements of young women compared to young men, 36 although thatincreased requirement is lessened for women taking the oral contraceptive pill. Good food sources of iron areparticularly important for this group. Lean red meats and some types of seafood are excellent sources of iron. 9Poultry, legumes, tofu, nuts and eggs also provide some iron. <strong>For</strong> pregnant women, additional sources of ironmay be required and an appropriate health professional should be consulted.Older peopleLean meats and poultry, fish, eggs, tofu, legumes/beans and nuts and seeds are nourishing foods for older adults andshould be included in the diet as a ready source of protein to help maintain muscle mass. 9 People with poor dentitionshould be advised to choose forms of food that are easier to eat, such as softer foods, soups and casseroles.Whole nuts may not be well tolerated where there is a problem with dentition. In these cases, the inclusion ofground nuts, nut pastes or nut meal in dishes may be more appropriate.Guideline 2People with vegetarian or vegan dietary patternsNuts and seeds and legumes/beans are important foods for people who choose vegetarian or vegan dietarypatterns and meals without meat as they can provide an alternative source of nutrients. <strong>For</strong> several nutrients,including iron, calcium and vitamin B 12, animal foods are highly bioavailable sources and care needs to be takento ensure a variety of alternatives if these foods are excluded.<strong>For</strong> lacto-ovo vegetarian diets, eggs provide vitamin B 12and milk, yoghurt and cheese products can supply calciumand vitamin B 12. The Food Modelling System used a ratio of a 5:1:1 ‘legume: egg: nuts and seeds’ mixed foodgroup. As comparable data was not available for Australia, this was based on the United States Departmentof Agriculture (USDA) recommendations for proportions of these foods that would provide an adequate aminoacid balance. 9 As no Australian national data were available about choices within food categories for lacto-ovovegetarians, the same proportions within food groups (e.g. for vegetables, fruit, cereals) were used as for theequivalent omnivore group.<strong>For</strong> pregnant women and children consuming vegetarian diets, it should be noted that iron was limiting in thediets as modelled and additional sources of iron would be essential to meet their requirements. 9 Vitamin B 12is only available from animal food sources and supplementation may be needed by people with vegetarian orvegan dietary patterns.Food safetyFish that have been exposed to heavy metals, dioxins and dioxin-like polychlorinated biphenyls (PCBs) fromindustrial pollution of marine and freshwater environments can present a toxicological food safety risk to humanbiological systems if consumed in sufficiently large amounts. Although fish caught in specific locations could leadto high human exposure – for example, west of the Sydney Harbour Bridge 573 – exposure in Australia is generallylow. 574 The Food and Agriculture Organisation of the United Nations (FAO) and WHO held an expert consultationon this issue and concluded in general that the disadvantages of foregone health benefits from fish consumptionoutweigh the risks of increased exposure to heavy metals, dioxins and PCBs, although it was acknowledged thatclose monitoring and evaluation of the fish supply and dietary exposure is needed. 575Enjoy a wide variety of nutritious foodsNational <strong>Health</strong> and Medical Research Council55
2.5 Enjoy milk, yoghurt, cheese and/or alternatives,mostly reduced fat2.5.1 Setting the sceneGuideline 2In past dietary guidelines these foods have been referred to as dairy foods, but greater specificity is requiredto reflect definitions in the relevant literature (for example butter, cream and ice-cream are not included).Milks, cheeses and yoghurts are most frequently produced from cow’s milk in Australia. Fermented milkproducts that contain viable micro-organisms in the product are also available. Other sources for milk and relatedproducts include goats, sheep, soy, almonds and various cereals including oats and rice. Milk substitutes thatare not fortified with calcium and other nutrients are not included in this food group.Milk, cheese and yoghurt have various health benefits and are a good source of many nutrients, including calcium,protein, iodine, vitamin A, vitamin D, riboflavin, vitamin B 12and zinc. These foods provide calcium in a readilyabsorbable and convenient form. However, in reflecting on Australian consumption patterns and ensuring allnutrient requirements are met within energy requirements, it is recommended that reduced fat varieties shouldbe chosen on most occasions. 9 The inclusion of mostly or all full fat milk, cheese and yoghurts proportionallyincreases total fat, saturated fat and overall energy components of the diet. Unmodified milk from animal sourcessuch as cow’s, goats or sheep, should not be given as a main drink before 12 months of age.Alternatives to milk, cheese and yoghurt include calcium-enriched legume/bean/cereal milk products such ascalcium-enriched soy, rice and oat drinks. Soy (except soy follow-on formula) and other nutritionally incompleteplant-based drinks such as rice, oat, coconut or almond drinks are inappropriate alternatives to breast milk orformula in the first 12 months. <strong>For</strong>tified soy drink or calcium-enriched plant-based drinks can be used after12 months of age under health professional supervision, as long as other sources of protein and vitamin B 12are included in the diet. Further information about legumes/beans is included with vegetables and meat andalternative groups above.It should be noted that reduced fat varieties of milks and/or plant-based drinks are not suitable as a drink forchildren under the age of 2 years due to energy requirements for growth and they may also not be appropriatefor adults over the age of 70 years due to reduced body weight and energy intake.2.5.2 The evidence for consuming ‘milk, yoghurt, cheese and/or alternatives,mostly reduced fat’The evidence for the health benefits of consumption of these dairy foods (mainly reduced fat varieties) hasstrengthened since the 2003 edition of the dietary guidelines, 36 however the evidence base primarily comprisessmall, short-term studies with varied definitions of dairy foods. The evidence for the relationship between foodscontaining calcium and increased bone density in post-menopausal women was not re-examined because it wasregarded as an accepted relationship. 36Table 2.13: Evidence statements for consuming ‘milk, yoghurt, cheese and/or alternatives, mostly reduced fat’Evidence statementConsumption of at least two serves per day of dairy foods (milk, yoghurt, and cheese) is associated with reduced risk ofischemic heart disease and myocardial infarction.Consumption of two or more serves of dairy foods per day is associated with reduced risk of stroke.Consumption of three serves of low fat dairy foods is associated with reduced risk of hypertension.Consumption of more than one serve of dairy foods per day, especially milk, is associated with a reduced risk of colorectal cancer.Consumption of three or more serves of milk per day is not associated with risk of renal cell cancer.Consumption of three serves of any milk, cheese or yoghurt products a day is associated with reduced risk of hypertension.Consumption of two to four serves of dairy foods per day is associated with reduced risk of metabolic syndrome.GradeBBBBBCC56EAT FOR HEALTH – australian dietary guidelinesNational <strong>Health</strong> and Medical Research Council
Evidence statementConsumption of at least one and a half serves of dairy foods (milk, yoghurt, cheese) per day is associated with reduced risk oftype 2 diabetes.Consumption of more than one serve of milk per day is associated with reduced risk of rectal cancer.Consumption of dairy products (particularly milk) is associated with improved bone mineral density.GradeCCCNotes: The term ‘dairy’ refers to cow’s milk and the yoghurt and cheese produced from it.Grades – A: convincing association, B: probable association, C: suggestive associationIncludes evidence statements and gradings from the Evidence Report (literature from years 2002–2009). Does not include evidence fromother sources, such as the 2003 edition of the dietary guidelines (in which individual studies were classified according to their design aslevel I, II or III but overall grades for relationships were not derived), although these sources have been used to inform these <strong>Guidelines</strong>.Grade C evidence statements showing no association and all Grade D statements can be found in Appendix E.Cardiovascular disease, type 2 diabetes and excess weightGuideline 2• Coronary heart disease: It is probable that the consumption of at least two serves per day of dairy foods(milk, cheese and yoghurt) is associated with reduced risk of ischaemic heart disease and myocardial infarction(Grade B; Evidence Report, Section 5.3). 576• Stroke: It is probable that the consumption of two or more serves of dairy foods per day (milk, cheese andyoghurt) is associated with reduced risk of stroke (Grade B; Evidence Report, Section 5.4) 576,577 particularlyreduced fat varieties.• Hypertension: It is probable that consumption of three serves of low fat dairy foods (milk, cheese and yoghurt)is associated with reduced risk of hypertension (Grade B; Evidence Report, Section 5.5). The evidence alsosuggests that consumption of three serves of any milk, cheese or yoghurt products per day is associated withreduced risk of hypertension (Grade C; Evidence Report, Section 5.5). 213,578-581• Type 2 diabetes: The evidence suggests that consumption of two to four serves of dairy foods (milk, cheese,yoghurt) per day is associated with reduced risk of metabolic syndrome (Grade C; Evidence Report,Section 5.7) 576,582 and that consumption of at least one and a half serves of milk, cheese and yoghurt perday is associated with reduced risk of type 2 diabetes (Grade C; Evidence Report, Section 5.6). 213,576,583• Excess weight: The evidence suggests that consumption of dairy foods is not associated with weight changeor risk of obesity in adults (Grade C; Evidence Report, Section 5.8) 209-214 and consumption of milk is notassociated with BMI or change in BMI in childhood (Grade C; Evidence Report, Section 5.9). 215,217-219,584,585Total energy intake is always important in weight management. 9Cancer• Rectal and colorectal cancer: Recent evidence suggests it is probable that consumption of more than oneserve of dairy foods per day (especially milk) is associated with reduced risk of colorectal cancer (Grade B;Evidence Report, Section 5.11) 492,586,587 The evidence suggests that consumption of more than one serve ofmilk per day is associated with reduced risk of rectal cancer (Grade C; Evidence Report, Section 5.12). 586-588The WCRF report found probable evidence that consuming milk is associated with reduced the risk ofcolorectal cancer (see Appendix F). 43• Renal cell, breast and endometrial cancer: It is probable that consumption of three or more serves of milkper day is not associated with risk of renal cell cancer (Grade B; Evidence Report, Section 5.13). 589 There isevidence to suggest that mean consumption of one serve of dairy food (milk cheese, yoghurt) per day is notassociated with the risk of breast cancer (Grade C; Evidence Report, Section 5.15) 590,591 and that consumptionof dairy food (milk, cheese, yoghurt) is not associated with risk of endometrial cancer (Grade C; EvidenceReport, Section 5.16). 592• Prostate cancer: Recent evidence suggesting an association between milk consumption and prostate canceris inconclusive (Evidence Report, Section 5.14). The WCRF also found limited evidence that consumption ofmilk and dairy products is associated with risk of prostate cancer (see Appendix F). 43Enjoy a wide variety of nutritious foodsNational <strong>Health</strong> and Medical Research Council57
Other conditionsThe traditional nutritional rationale for the inclusion of dairy foods such as milk, cheese and yoghurt is their highcalcium content and the positive relationship between calcium and bone mass. 8• Bone mineral density: Recent evidence suggests that consumption of dairy foods (particularly milk) isassociated with improved bone mineral density (Grade C; Evidence Report, Section 5.1) 590,593-598 but this iscontradicted by evidence suggesting that less than one serve of milk per day during adult life is not associatedwith risk of osteoporotic or hip fracture (Grade C; Evidence Report, Section 5.2). 599,600Guideline 22.5.3 How consuming milk, yoghurt, cheese and/or alternatives, mostly reduced fat,may improve health outcomesThere is a range of bioactive substances in milk products that may have a contributing role in health outcomes.The mechanism by which milk, yoghurt and cheese consumption (especially milk) affect blood pressure 601 mightbe due to calcium modulating endothelial function. 602 Calcium from foods may be preferable to calcium fromsome supplements. A recent meta-analysis of the effect of calcium supplementation on myocardial infarction andcardiovascular events 603 suggested that calcium supplements, without co-administered vitamin D, were associatedwith an increased risk of myocardial infarction. The same group has more recently reported a similar effect fromcalcium supplements with vitamin D. 604 However, the effect of an equivalent dose of calcium from milk, yoghurtand cheese products has a much smaller effect than calcium supplements on the proposed risk factor, namelyraised serum calcium levels. 605There may be a negative association between calcium and blood pressure although this is variable, depending onother dietary factors, and it has been suggested that calcium supplementation may lower blood pressure only inpeople with a relatively high salt intake. 606Several reasons have been suggested for the lack of an association between a low consumption of milk andincreased risk of osteoporotic fracture of the hip. <strong>For</strong> example, it has been suggested that women who consumedhigher quantities of milk chose to do so because they were known to be at an elevated risk of osteoporosis or thatmilk intake during childhood was more important. 607A randomised controlled trial of children who were overweight found that 200ml of milk per day combined withnutrition education was associated with a reduced consumption of sugar-sweetened drinks and increased leanbody mass. 6082.5.4 Practical considerations: enjoy milk, yoghurt, cheese and/or alternatives,mostly reduced fatConsuming at least two and a half serves of milk, cheese, yoghurt and/or alternatives, mostly reduced fat, isrecommended for Australian adults, while the recommended food group intakes for children and adolescentsdepend on age and sex (see Tables 2.14 and 2.15). 9 Varieties of cheese that are lower in salt are also preferable(see Section 3.2).The companion resources provide more detailed information on the recommended number of serves and servesizes of milk, yoghurt, cheese and/or alternatives required for different omnivore population groups. Discussion ofdietary patterns and the environment is included in Appendix G.58EAT FOR HEALTH – australian dietary guidelinesNational <strong>Health</strong> and Medical Research Council
Table 2.14: Minimum recommended number of serves of milk, yoghurt, cheese and/or alternatives per day, mostly reduced fatAge (years)Number of serves*Boys 2–3 1 ½4–8 29–11 2 ½12–13 3 ½14–18 3 ½Men 19–50 2 ½51–70 2 ½70+ 3 ½Girls 2–3 1 ½4–8 1 ½Guideline 29–11 312–13 3 ½14–18 3 ½Pregnant (up to 18 years)3 ½Breastfeeding (up to 18 years) 4Women 19–50 2 ½51–70 470+ 4Pregnant (19–50 years)Breastfeeding (19–50 years)2 ½2 ½Note: *Additional amounts of the Five Food Groups or unsaturated spreads and oils or discretionary choices are needed only by peoplewho are taller or more active to meet additional energy requirements.Source: Food Modelling System. 9Table 2.15:Food groupStandard serve size equivalents for milk, yoghurt, cheese and/or alternatives, mostly reduced fatServe sizes (500–600kJ)Milk, yoghurt, cheeseand/or alternatives,mostly reduced fat1 cup (250ml) milk – fresh, UHT long life or reconstituted powdered1/2 cup (120ml) evaporated unsweetened milk3/4 cup (200g) yoghurt40g (2 slices or 4 x 3 x 2 cm piece) hard cheese e.g. cheddar1/2 cup (120g) ricotta cheese1 cup (250ml) soy, rice or other cereal drink with at least 100mg of added calcium per 100mlSource: Food Modelling System. 9Enjoy a wide variety of nutritious foodsNational <strong>Health</strong> and Medical Research Council59
The 1995 National Nutrition Survey 45 included a category called ‘milk products and dishes’ which included itemssuch as milks, yoghurts, cheese, cream, ice-cream and milk-based custards, as well as milk substitutes such assoy drinks and soy cheeses. On the day of the survey, 93% of subjects consumed foods from this category, theaverage intake being 322g for adult men and 258g for adult women. Older men consumed less of these foodsthan younger men, but consumption remained relatively stable in women across age groups.To meet recommended food group intakes for adults 9 consumption of milk, yoghurt and cheese products wouldneed to approximately double overall, with a halving of higher fat varieties and a four-fold increase in reducedfat varieties of milk, cheese and yoghurt. Alternatives such as calcium-enriched soy or other drinks could besubstituted for these dairy foods.Guideline 2Pregnant and breastfeeding womenMilk, yoghurt and cheese product intake during pregnancy and lactation have benefits for both women andtheir babies. Reduced fat milk, yoghurt and cheese products are recommended during pregnancy and whilebreastfeeding. 428,572Pregnant women are advised to avoid consuming unpasteurised dairy products and soft, semi-soft and surfaceripenedcheeses (e.g. brie, camembert, ricotta, fetta and blue cheeses) due to risk of listeriosis. 349,609InfantsCow’s milk should not be given as a drink to infants (under 12 months of age). However cow’s milk may be servedin small quantities as custards, with cereals or as yoghurt. Any milk given to infants (as a drink) should be breastmilk or infant formula.Milk given to infants and toddlers should be pasteurised. As children under 2 years are growing rapidly and haverelatively high energy (kilojoule) needs, reduced fat milks are not recommended as a main milk food for this age,but are suitable after 2 years of age.<strong>For</strong> further information, see the Infant Feeding <strong>Guidelines</strong>. 351Children and adolescentsMilk is an important source of calcium and protein for growing children and adolescents. The decreased intake ofmilk and milk products among adolescent girls is of concern, and can lead to low calcium intake in this group. 45Diets restricting intake of milk and milk products (or calcium-fortified alternatives) are not generally suitable forgrowing children and adolescents. Suspected lactose intolerance and allergy in children and adolescents shouldbe confirmed by a medical practitioner.Older people<strong>For</strong> older Australians, milk is a good source of protein, calcium and energy (kilojoules). All milks, including wholemilk, are good choices for older people whose appetite is reduced or who have lost weight, unless medicallyadvised otherwise.People with lactose intoleranceThe rate of lactose intolerance is relatively high in many Asian communities compared with Caucasians. High rates oflactose intolerance have been described among Aboriginal and Torres Strait Islander groups. 610,611 Lactose-intolerantadults and children often avoid milk and milk products, however up to 250ml of milk may be well tolerated if brokenup throughout the day and consumed with other foods. 612 Cheese contains little lactose and the lactose in yoghurt ispartially broken down by bacteria that thicken the yoghurt, so should be well tolerated. Lactose-free dairy productsand calcium-fortified beverages are also available.People with vegetarian or vegan dietary patternsThe 2003 edition of the dietary guidelines addressed vegetarian and vegan diets and their influence on calciumneeds because of the relatively high oxalate and phytate content in some plants. However, lacto-ovo vegetariansappear to have calcium intakes similar to those of omnivores. Those who follow a vegan or vegetarian dietand avoid milk products, should consume alternative calcium-fortified products and seek advice from a healthprofessional about whether they need to take supplements. 3660EAT FOR HEALTH – australian dietary guidelinesNational <strong>Health</strong> and Medical Research Council
2.6 Drink plenty of water2.6.1 Setting the sceneWater is essential for life. All biochemical reactions occur in water. It fills the spaces between the cells andhelps form structures of large molecules such as protein and glycogen. Water is also required for digestion,absorption and transportation, as a solvent for nutrients, for elimination of waste products and to regulatebody temperature. 613Water is lost from the body in sweating (from 100ml to several 1,000ml/day), insensible losses from the lungsand skin (approximately 800ml/day), faecal losses (200ml/day) and urine. A minimal urine volume to excrete soluteload is estimated at 500ml/day but may need to be much greater in older people due to declining kidney function. 614Excluding obvious sweating, the normal turnover of water has been estimated at approximately 4% of total bodyweight per day in adults. In a 70 kg adult, this is equivalent to 2,500–3,000ml/day.Some of this turnover will come from the water contained in foods but the majority of dietary intake comesfrom free water and/or other water-containing fluids. 8,36 Ambient temperature, physical activity and body sizeall influence requirements, creating wide variations in daily needs for water. Losses from the lungs and skinincrease at high temperatures, high altitude and low humidity. During summer, when heat stress may be high,water depletion can lead to heat exhaustion, loss of consciousness and heat stroke. 615,616Guideline 2Details of water requirements for all ages are found in the NRV Document, but for adult males and femalesthe estimated daily average intake is 2.6 L and 2.1 L (8–10 cups) respectively. 8 This includes all fluids, but it ispreferable that the majority of this intake is from plain water. Water requirements can increase considerably inhigh temperatures and in increased physical activity.There are no reports of any specific hazards from the usual consumption of water by healthy individuals. Excesswater intake can cause hyponatraemia, but this is rare in the general population. In general, self-regulation ofexcess water consumption occurs in healthy people in temperate climates.2.6.2 The evidence for ‘drink plenty of water’Water is essential for human life because it is required in amounts that exceed the body’s ability to produce it.Given this, no recent studies investigating the relationship between water consumption and health outcomeswere identified in the literature review. Many commonly consumed fluids provide water, however they may alsobe acidic such as low-joule soft drink or contain added sugar, alcohol or caffeine. Recent studies that investigatedintake of these fluids and health outcomes are reviewed below.Table 2.16: Evidence statements for ‘drink plenty of water’Evidence statementConsumption of sugar-sweetened beverages is associated with increased risk of weight gain in adults and children.Consumption of coffee of four or more cups per day is associated with reduced risk of type 2 diabetes.Consumption of green and black tea is associated with reduced risk of stroke.Consumption of coffee is associated with reduced risk of endometrial cancer.Consumption of coffee is associated with reduced risk of hepatocellular cancer.Consumption of soft drink is associated with increased risk of dental caries in children.Consumption of soft drinks is associated with increased risk of reduced bone strength.GradeBBCCCCCNotes: Grades – A: convincing association, B: probable association, C: suggestive associationIncludes evidence statements and gradings from the Evidence Report (literature from years 2002–2009). Does not include evidence fromother sources, such as the 2003 edition of the dietary guidelines (in which individual studies were classified according to their design aslevel I, II or III but overall grades for relationships were not derived), although these sources have been used to inform these <strong>Guidelines</strong>.Grade C evidence statements showing no association and all Grade D statements can be found in Appendix E.Enjoy a wide variety of nutritious foodsNational <strong>Health</strong> and Medical Research Council61
Reviews have also shown an association between inadequate water consumption and poor health. Dehydrationof as little as 2% loss of body weight results in impaired physiological responses and performance. 8 The reportedhealth effects of chronic mild dehydration and poor fluid intake include increased risk of kidney stones, urinarytract cancers, colon cancer and mitral valve prolapse as well as diminished physical and mental performance. 8Cardiovascular disease, type 2 diabetes and excess weightGuideline 2• Cardiovascular disease:––The evidence suggests that consumption of black tea is not associated with risk of cardiovascular disease(Grade C; Evidence Report, Section 15.21). 617-621––The evidence suggests that consumption of green and black tea is associated with reduced risk of stroke(Grade C; Evidence Report, Section 15.20). 619,622-625––The evidence suggests that consumption of coffee is not associated with risk of coronary heart disease(Grade C; Evidence Report, Section 15.13), 626-629 although this was not the case for cigarette smokers.• Blood pressure: Recent evidence is inconclusive in regard to an association between coffee consumptionand systolic blood pressure (Evidence Report, Section 15.14).• Type 2 diabetes: There is evidence of a probable association between consumption of more than four cupsof coffee a day and a reduced risk of type 2 diabetes (Grade B; Evidence Report, Section 15.15). 630-637• Excess weight: It is probable that consumption of sugar-sweetened beverages is associated with weightgain in children and adults (Grade B; Evidence Report, Section 15.1). 185-196Cancer• Breast, colorectal and ovarian cancer: The evidence suggests that consumption of coffee is not associatedwith risk of breast cancer, 638 colorectal cancer 494,639-641 or ovarian cancer 642-644 (Grade C; Evidence Report,Sections 15.7, 15.9 and 15.11).• Endometrial and hepatocellular cancer: The evidence suggests that consumption of coffee is associatedwith decreased risk of hepatocellular cancer 645 and endometrial cancer 646,647 (Grade C; Evidence Report,Sections 15.6 and 15.8).• Gastric cancers: The evidence is inconclusive regarding an association between coffee consumption andrisk of gastric cancer (Evidence Report, Section 15.5).• Other cancers: The WCRF report states it is unlikely that coffee has any substantial effect on the risk ofrenal cancers (see Appendix F). 43• Ovarian and colorectal cancer: The evidence suggests that consumption of green or black tea is notassociated with ovarian cancer (Grade C; Evidence Report, Section 15.18) 642-644 or colorectal cancer(Grade C; Evidence Report, Section 15.19). 639-641,648,649• Other cancers: Recent evidence is inconclusive regarding an association between consumption of greenand black tea and breast, gastric or lung cancer (Evidence Report, Sections 15.16, 15.17 and 15.22).Dental health• The evidence suggests that consumption of soft drinks is associated with increased risk of dental caries inchildren (Grade C; Evidence Report, Section 15.14) and increased risk of reduced bone strength (Grade C;Evidence Report, Section 15.3). 195,650-653• Fluoride added to tap water provides protection against dental caries. 654 The mildly alkaline nature of salivais the key protective element against erosion of teeth by acids. If dehydration occurs after exercise or fromparticular medications, an adequate intake of water is essential for maximising the protective effect of salivaon oral health. 655 Dehydration also causes loss of salivary protection against attrition, erosion and abrasion.• The Australian Dental Association reports that 68% of Australian school students have at least one tooth eroded. 656Erosion is related to the acidity of drinks, whether sweetened with sugar or artificial sweeteners, as well as thebacterial fermentation that can occur with consumption of sugar (see Section 3.3.2). The relationship betweenthe acidity of sweetened drinks and dental erosion is also supported by the American Academy of PediatricsCommittee on School <strong>Health</strong>. 65762EAT FOR HEALTH – australian dietary guidelinesNational <strong>Health</strong> and Medical Research Council
2.6.3 How drinking plenty of water may improve health outcomes<strong>For</strong> oral health, water has an advantage over many commercially available drinks, including sugar-sweetened orlow-kilojoule soft drinks, ‘sports’ and ‘energy’ drinks. As well as the potentially adverse direct effects of sugar andenergy (see Section 3.3), the carbonation process creates an acidic environment that contributes to the erosion oftooth enamel. 655 Tap water also has the beneficial effects of added fluoride in many communities in Australia andfluid intake can affect saliva production and saliva, which is primarily water and essential for the maintenance oforal health. 8,36The mechanism by which coffee consumption may protect against type 2 diabetes is not clear. It has been reportedthat insulin resistance is decreased in peripheral tissues after exposure to caffeine 658 and conversely, the effect ofcaffeine on thermoregulation has been suggested as a mechanism by which glucose homeostasis is improved. 659Other components of coffee, possibly magnesium, may also assist by benefiting insulin sensitivity and reducing riskof type 2 diabetes. 660 Tea contains polyphenols known as catechins which have been reported to reduce hypertension,atherosclerosis and thrombogenesis. 661 Polyphenols also play a part in nitric oxide production from the vascularendothelium, enhancing endothelial health and reducing the risk of cardiovascular diseases and stroke. 6612.6.4 Practical considerations: drink plenty of waterAdequate fluid consumption is an integral component of a healthy diet. Water is a good source of fluids and hasthe advantage of not adding energy (kilojoules) to the diet. It is preferable to meet most fluid needs by drinkingplain water. Many commonly consumed fluids such as tea and coffee provide water, although they can haveunwanted stimulant effects in susceptible people.Guideline 2The NHMRC has developed comprehensive guidelines on tap water standards for drinking. 662 Australian tap wateris an ideal option because it is inexpensive and meets high palatability and hygiene standards. Most tap water inAustralia is fluoridated, which has been shown to be a safe and effective public health measure. Fluoridation oftap water provides an additional benefit for development of strong teeth and bones, making it a very good choiceto ensure adequate hydration. Tank water and bottled waters are a useful alternative when access to tap water islimited. Not all bottled waters contain fluoride.However, access to and availability of clean and safe water may be limited for some population groups, particularlyin remote regions of Australia. Discussion of dietary patterns and the environment is included in Appendix G.Pregnant and breastfeeding womenAs stated in the 2003 edition of the dietary guidelines, pregnant and breastfeeding women have an increasedwater requirement because of expanding extracellular fluid space and the needs of the foetus and the amnioticfluid. The fluid need is therefore 750–1,000ml a day above basic needs. 36Many authoritative bodies advise pregnant and breastfeeding women to limit their caffeine intake. <strong>For</strong> example theAustralian Department of <strong>Health</strong> and Ageing and New Zealand Ministry of <strong>Health</strong> advise that intake be restrictedto a maximum of 300 mg of caffeine per day (about three cups of coffee or six cups of tea). 428,663InfantsWater turnover is higher in infants and young children than in adults. Adequate levels of hydration are important,especially during times of potential heat stress (e.g. due to hot weather or fever). Breast milk supplies adequatewater up to around 6 months of age, but cooled boiled water may need to be provided for formula-fed infants. 351Older peopleOlder people can experience dehydration due to inadequate intake of water or other drinks. The normal declinein kidney function with age, plus hormonal changes, decreased thirst perception, medication, cognitive changes,limited mobility and increased use of diuretics and laxatives may create concern for older people. 34 These changesmay be normal adaptations of the ageing process but the outcomes of dehydration in older people are serious andinclude cognitive impairment, functional decline, falls or stroke. Particular care must be taken to ensure adequatewater intake in this group.Enjoy a wide variety of nutritious foodsNational <strong>Health</strong> and Medical Research Council63
2.7 Practice guide for Guideline 2Table 2.17: Considerations in advising people from specific groups to consume a wide variety of foodsPopulation groupConsiderationsGuideline 2Pregnant and breastfeeding women• Quality nutritious dietary patterns are essential in meeting thenutrient requirements of mother and foetus within the mother’senergy requirements• Pregnant women are at higher risk of foodborne illness. Foodsassociated with a risk of Listeria bacteria should be avoided• While bread in Australia contains iodine and folate, supplementaryfolate is recommended preconception and in the first trimesterand iodine should be supplemented preconception and throughoutpregnancy and breastfeeding• During pregnancy, care needs to be taken with consumption ofsome fish species due to the high mercury content• Nuts need only be avoided if the woman herself has an allergyto them• Fluid need is 750–1,000ml a day above basic needs• A high-fibre diet and drinking sufficient water is effective intreating constipationInfants(less than 12 months)Children and adolescents• Exclusive breastfeeding is recommended for around the first6 months, and should continue for 12 months and beyond for aslong as the mother and child desire• Breast milk supplies adequate water up to around 6 months of age,but cooled boiled water may need to be provided for formula-fedinfants from birth• A wide variety of solid foods should be introduced from around6 months, with first foods being iron rich (e.g. iron-fortified cereal,meat and alternatives)• Texture of solid foods should be appropriate to the infant’sdevelopment• Some foods may need to be introduced many times before theyare accepted• Hard pieces of food(e.g. some raw vegetables/fruit, whole nuts)should be avoided. Nut butters or pastes do not increase the risk ofallergies and can be introduced from 6 months• Breast milk or infant formula should be the main drinks in the first12 months, however cow’s milk may be served in small quantitiesas custards, with cereals, or as yoghurt between 6 and 12 months• A wide variety of nutritious foods is needed to support normalgrowth and development• Parents and carers can support quality optimal dietary patterns bymodelling behaviours and purchasing and preparing nutritious foods• Reduced fat milk, yoghurt and cheese products are recommendedfor children 2 years and older• <strong>Dietary</strong> restrictions are not generally suitable for growing childrenand adolescents and suspected food intolerance and allergy shouldbe confirmed by a medical practitioner• Adolescents may be vulnerable to disordered eating64EAT FOR HEALTH – australian dietary guidelinesNational <strong>Health</strong> and Medical Research Council
Older people• Reduced mobility, isolation, poor dentition and poverty may reduceaccess to nutrititious foods• Particular care is required to ensure adequate water intake as theoutcomes of dehydration are serious• People with chronic health issues and the frail elderly often havedietary requirements that are different to those of healthy, freelivingolder peoplePeople living in remoteareas and people in lowersocioeconomic groups• <strong>Health</strong>y food habits may be difficult to afford• In urban areas there may be less access to supermarket foods andgreater access to fast foods• In rural and remote areas a wide variety of fresh foods may not belocally available or may be expensive. Available traditional foods canbe a nutritious alternative• Seasonal, frozen and canned fruit and vegetables, dried milk powderand grains and tinned fish can be nutritious, accessible optionsGuideline 2People with vegetarian orvegan dietary patterns• A variety of plant foods should be chosen to ensure adequate intakeof iron and zinc• Vitamin B 12is only available from animal food sources andsupplementation may be neededWhere to next?Both the quality and quantity of foods and drinks consumed can have a significant impact on health andwellbeing. The following chapter discusses how the overconsumption of some foods, such as thosecontaining saturated fat, added salt, added sugars and alcohol, is associated with increased risk of somehealth conditions.Enjoy a wide variety of nutritious foodsNational <strong>Health</strong> and Medical Research Council65
GUIDELINE 3Limit intake of foods containing saturated fat,added salt, added sugars and alcoholGuideline 3Limit intake of foods containing saturated fat, added salt, added sugars and alcohol.a. Limit intake of foods high in saturated fat such as many biscuits, cakes, pastries, pies, processed meats,commercial burgers, pizza, fried foods, potato chips, crisps and other savoury snacks.• Replace high fat foods which contain predominantly saturated fats such as butter, cream, cookingmargarine, coconut and palm oil with foods which contain predominantly polyunsaturated andmonounsaturated fats such as oils, spreads, nut butters/pastes and avocado.• Low fat diets are not suitable for children under the age of 2 years.b. Limit intake of foods and drinks containing added salt.• Read labels to choose lower sodium options among similar foods.• Do not add salt to foods in cooking or at the table.c. Limit intake of foods and drinks containing added sugars such as confectionary, sugar-sweetened softdrinks and cordials, fruit drinks, vitamin waters, energy and sports drinks.d. If you choose to drink alcohol, limit intake. <strong>For</strong> women who are pregnant, planning a pregnancy orbreastfeeding, not drinking alcohol is the safest option.SummaryGuideline 3• This Guideline emphasises the importance of limiting intake of foods and drinks high in saturated fat,added salt, added sugars and alcohol, based on evidence that these foods are associated with increasedrisk of obesity and/or chronic diseases, including cardiovascular disease, type 2 diabetes and/or somecancers. There is limited capacity for including energy-dense discretionary foods in nutritious dietarypatterns within the energy requirements of many Australians.• The link between dietary saturated fat, serum cholesterol and cardiovascular disease is well established.Replacing dietary saturated fat with monounsaturated and polyunsaturated fats is associated with improvedblood lipid profiles and reduced risk of cardiovascular disease. Fat-rich foods are energy-dense, which isprudent to consider in a total dietary pattern that seeks to control overall energy intake. Low fat diets are notsuitable for children under the age of 2 years. Reduced fat milk may be used from the age of 2 years.• Reducing sodium intake decreases blood pressure in both normotensive and hypertensive adults, and theevidence has strengthened that reducing sodium intake may decrease risk of mortality, stroke and heartdisease in people with hypertension. Salt in processed foods is the major source of sodium in Western diets.• Frequent consumption of foods and drinks high in added sugars is a major risk factor in dental caries.There is strengthened evidence of an association between intake of sugar-sweetened drinks and risk ofexcess weight gain.• The health, social and economic costs associated with excessive alcohol consumption are well-documented.Limiting alcohol intake is also an important strategy for achieving appropriate energy intake.• Discretionary foods should only be consumed sometimes and in small amounts. While discretionaryfoods can contribute to the overall enjoyment of eating, often as part of social activities and family orcultural celebrations, if their intake is not reduced, most Australians need to greatly increase physicalactivity to ‘burn up’ the additional energy (kilojoules) from discretionary foods to help achieve andmaintain a healthy weight (see Guideline 1).This chapter provides information on why consumption of these food types should be limited. It includespractical considerations for meeting the guideline recommendation, for example, by choosing a variety ofnutritious foods (Guideline 2), using only small amounts of unsaturated fats, spreads and oils, and avoidingor limiting discretionary foods and drinks.Limit intake of foods containing saturated fat, added salt, added sugars and alcoholNational <strong>Health</strong> and Medical Research Council67
3.1 Limit intake of foods high in saturated fat3.1.1 Setting the sceneContinuing research into diet and cardiovascular disease emphasises reducing saturated fat in the diet, whichmeans limiting intake of foods with high saturated fat content. Fat is a nutrient in food but the term ‘fats’ hasalso been applied to whole foods (e.g. butter, margarine and oils). Foods known as fats can also be ingredientsin other foods (e.g. cakes and biscuits) or added as a culinary adjunct (e.g. oil in cooking or dressings). As anutrient, fat has high energy value (fat delivers about 37 kJ/g, compared to around 17 kJ/g for carbohydrateand protein).The evidence indicates that replacing dietary saturated fat with monounsaturated and polyunsaturated fats isassociated with improved blood lipid profiles and reduced risk of cardiovascular disease. Replacing the type offatty acids in fats requires a total diet approach and is not always possible with all foods. Both the amount andtype of fat need to be carefully considered as all types of fat provide kilojoules and the proportion of total fatin a diet influences energy intake, which may have an impact on weight management (see Chapter 1).As people choose to eat foods, rather than food components or nutrients, the focus of this guidelinerecommendation is on foods containing fats, not fatty acids per se. Information on particular types of fattyacids is included in the NRV Document. 8Most fats in foods are in the form of triglycerides, which are made up of a unit of glycerol combined withthree fatty acids that may be the same or different. The differences between one triglyceride and another arelargely due to the fatty acids attached to the glycerol unit. Other dietary fats include phospholipids, phytosterolsand cholesterol. 8Guideline 3Over time, the understanding of physiological effects and pathways have been gradually refined – for example,with the discovery of low-density and high-density cholesterol and more recently, the discovery of sub-fractionsof these. 664 Additional physiological characteristics are being studied as possible markers of cardiovascular risk(e.g. vascular reactivity and carotid intima medial thickness). It is also apparent that not all fatty acids withineach group have the same effects – for example, stearic acid might not have the same effects as some othersaturated fatty acids (SFAs). 664 However, as a general message to the public, limiting total dietary saturated fatremains the best guide.Fatty acids include SFAs, monounsaturated fatty acids (MUFAs) or polyunsaturated fatty acids (PUFAs). The typeof fatty acid depends on the chemical bonding within the fatty acid molecule, specifically the number of doublebonds between the carbon atoms. This gives fatty acids differing chemical properties that cause differentbiological effects. MUFAs and PUFAs with one or more double bonds in the trans configuration are knownas trans-fatty acids (TFAs). 665 Omega fatty acids (omega-3 and omega-6 PUFAs) are sub-classes of PUFAs.The essential fatty acids (which humans do not make) are considered to be linoleic acid (omega-6 PUFA) andalpha-linolenic acid (omega-3 PUFA). The most common omega-9 fatty acid is oleic acid, a MUFA.Staple foods with a relatively higher fat content, such as nuts, seeds, some grains (e.g. oats), dairy foodsand meats, have various combinations of fatty acids. Fish is the predominant source of two omega-3 LCPUFAs,eicosapentaenoic acid (EPA) (20:5) and docosahexaenoic acid (DHA) (22:6). Grass-fed meat, kangaroo and offalcontain small quantities of these omega-3 LCPUFAs as well as another, docosapentaenoic acid (DPA) (22:5).The NRV Document recommends that: 8• total fat account for 20–35% of energy (kilojoule) intake• total SFAs and trans fats comprise no more than 10% of energy intake• 4–10% of energy comes from linoleic acid (omega-6 PUFA) and 0.4–1% from alpha-linolenic acid(omega‐3 PUFA).Given that total energy intake reflects the sum of the energy value of all foods consumed, food choices andculinary practices can have a substantial impact on whether these fatty acid targets are met. 968EAT FOR HEALTH – australian dietary guidelinesNational <strong>Health</strong> and Medical Research Council
3.1.2 The evidence for ‘limit intake of foods high in saturated fat’The early work on dietary fats and heart disease focused on the type of fat in the overall diet, with the fat beingcontributed by a wide range of foods. The evidence that replacing saturated fats with polyunsaturated fats affectsserum cholesterol levels has been accumulating for the last 60 years, 36,666 and the relationship has been confirmedin a recent review of human intervention trials and other studies. 94,667-670The intake of trans fats is low in Australia and consequently there is no specific recommendation to limit theirintake compared to current intake. 671 However, it is important to ensure that intake remains at its current low level.The evidence for associations between foods high in fat and the development of type 2 diabetes, hypertension,cancer and poor mental health has been reviewed in detail.The <strong>Guidelines</strong> recommend some caution in choosing foods high in fat (in particular saturated fat) because ofthe implications for weight management and cardiovascular disease risk. Fat-rich foods are energy (kilojoule)dense, heightening the risk of excess energy intake 672 as shown by dietary modelling. 9 Additionally, there is ampleevidence of the relationship between dietary patterns and disease risk at the population level. 94 Fat content is animportant component of dietary quality and it may be that the evidence for limiting saturated fat in the diet is bestconsidered from a whole-of-diet perspective, with additional reference to overall nutritional quality.Scientific evidence on the effect of dietary fat on health comes from studies that address dietary variables in anumber of ways. These include whole-of-diet studies examining the proportion of fat in the diet (relative to proteinand carbohydrate), the type of fat in the diet (relative to other types of fat), the effects of specific fatty acids inthe diet, and the effects of individual foods in which fat is a significant component. <strong>For</strong> example, studies couldexamine the effects of:• a low fat diet• a diet with a modified dietary fat ratio – for example, a high polyunsaturated:saturated fat ratio• a diet enriched with specific fatty acids (e.g. omega-3 fatty acids)• oils and fats (e.g. olive oil, spreads) in a defined dietary pattern.Methodological issues arise when considering the effects of fats and of dietary fat in the total diet. The difficultyin designing studies that address the effect of dietary fat on disease risk is reflected in several recent reviewson the topic. 94,667-670 It is important to note that inconsistency in results affects the strength of the evidencestatements below.Guideline 3Table 3.1: Evidence statements for ‘limit intake of foods high in saturated fat’Established evidenceSaturated fat is the strongest dietary determinant of plasma LDL concentration.Replacing saturated fat with polyunsaturated and monounsaturated fats is associated with improved blood lipids related tocardiovascular disease.Evidence statementHigher consumption of omega-3 LCPUFA fat (intake amount not specified) is associated with reduced risk of dementia.GradeCNotes: Grades – A: convincing association, B: probable association, C: suggestive associationIncludes evidence statements and gradings from the Evidence Report (literature from years 2002–2009). Does not include evidence fromother sources, such as the 2003 edition of the dietary guidelines (in which individual studies were classified according to their design aslevel I, II or III but overall grades for relationships were not derived), although these sources have been used to inform these <strong>Guidelines</strong>.Grade C evidence statements showing no association and all Grade D statements can be found in Appendix E.Limit intake of foods containing saturated fat, added salt, added sugars and alcoholNational <strong>Health</strong> and Medical Research Council69
Cardiovascular disease, type 2 diabetes and excess weight• Cardiovascular disease: Of the systematic reviews addressing the risk of cardiovascular disease andconsumption of fats and oils, 664,673-681 only one review 664 focused on the proportions of dietary fatty acids inthe overall diet rather than the effects of omega-3 fatty acids on markers of cardiovascular health. This reviewconfirmed that replacing SFAs with unsaturated fatty acids may reduce the risk of coronary heart disease,and that replacing trans fats with unsaturated fats improves blood cholesterol levels. From a whole-of-dietperspective, this review found that reducing the risk of cardiovascular disease by replacing SFAs withcarbohydrate (as is the case in some low fat diets) depends on the effects on body weight. 664The Joint FAO/WHO Expert consultation on fats and fatty acids in human nutrition 2010 682 reported convincingevidence that replacing SFAs with PUFAs decreases the risk of coronary heart disease. The <strong>Dietary</strong> <strong>Guidelines</strong>for Americans, 2010 drew similar conclusions, finding: 198––strong evidence that dietary SFAs are positively associated with increased serum cholesterol and LDLcholesterol, with increased risk of cardiovascular disease––an association between replacing dietary SFAs or trans fats with PUFAs with improved blood lipid profilesand reductions in levels of numerous markers of inflammation––strong evidence that replacing dietary SFAs with MUFAs and/or PUFAs is associated with improved bloodlipids related to cardiovascular disease––moderate evidence that 250 mg of omega-3 LCPUFAs delivered from two servings of seafood per weekis associated with reduced cardiac mortality from coronary heart disease and reduced risk of suddendeath from cardiovascular disease.• Hypertension: The evidence suggests that consumption of fat, irrespective of amount or type, is notassociated with hypertension in the short term (Grade C; Evidence Report, Section 12.4). 683-691Guideline 3• Type 2 diabetes: While overweight and obesity increase the risk of type 2 diabetes, 88 recent studies ofshort-term interventions are inconclusive and may not adequately reflect the nature of the effect of dietaryfat on type 2 diabetes. The evidence suggests that consuming omega-3 LCPUFAs (0.4 –6 g/day) and dietsof varying fat content are not associated with fasting plasma glucose or insulin concentrations (Grade C;Evidence Report, Section 12.3). 674,681,691-701In the longer term, the review conducted for the <strong>Dietary</strong> <strong>Guidelines</strong> for Americans 2010 found strong evidencethat dietary SFAs were positively associated with increased markers of insulin resistance and increased risk oftype 2 diabetes. In addition, it found that decreasing dietary SFAs and replacing them with PUFAs or MUFAsdecreases the risk of type 2 diabetes in healthy adults and improves insulin responsiveness in insulin resistant andtype 2 diabetes subjects. PUFA intake was associated with a significant decrease in the risk of type 2 diabetes. 198• Excess weight: <strong>Dietary</strong> fat provides a substantial amount of energy (kilojoules) per gram but total dietary energyis the variable that affects weight. Reducing the amount of dietary fat will not necessarily reduce dietaryenergy, but it is prudent to choose low fat and low energy-density foods in a total dietary pattern that seeks tocontrol overall energy intake. Because of this total energy effect, there are difficulties in appraising researchinto the effect of dietary fat alone on weight gain 672 (see Chapter 1).Cancer• All-cause: The evidence suggests there is no association between consumption of omega-3 LCPUFAs withtotal all-cause cancer incidence or mortality (Grade C; Evidence Report, Section 12.5). 677,702• Other cancers: Evidence of an association between total fat consumption across a range of intakes and breastor endometrial cancer is inconclusive (Evidence Report, Sections 12.6 and 12.7). However, the WCRF reportstates there is suggestive evidence that total fat consumption increases the risk of post-menopausal breastcancer (see Appendix F). 43Other conditions• Dementia: The evidence suggests that higher consumption of omega-3 LCPUFAs is associated with a reducedrisk of dementia (Grade C; Evidence Report, Section 12.8). 517,529,703-70670EAT FOR HEALTH – australian dietary guidelinesNational <strong>Health</strong> and Medical Research Council
3.1.3 How limiting intake of foods high in saturated fat may improve health outcomesFat is an energy-dense macronutrient, so consuming too much fat may lead to excess energy (kilojoule) intakeand weight gain; 672 however an individual’s genetic makeup, level of physical activity and other dietary factorsalso play a part. 707 Fat cells secrete compounds that influence appetite, inflammation and possibly also cancerdevelopment. 708-710 Insulin resistance, reflected in high insulin and glucose levels, is linked to obesity, and leadsto type 2 diabetes. Other cardiovascular disease risk factors such as high cholesterol levels and hypertensiontend to coexist with insulin resistance, a phenomenon often referred to as the metabolic syndrome. 711Fatty acids do not only contribute to body fat, different fatty acids influence disease risk factors. <strong>Dietary</strong> SFAsand TFAs have been associated with raised plasma LDL cholesterol, and dietary TFAs have been associated withreduced plasma high-density lipoprotein (HDL) cholesterol. 88 These changes in plasma cholesterol fractions areestablished risk factors for coronary heart disease that can be influenced by diet. Raised LDL cholesterol hasbeen found to be a significant risk factor in at least 50 prospective cohort studies involving more than 600,000subjects in 18 countries. 712 Several large cohort studies have also demonstrated that reduced HDL cholesterolis a significant risk factor for coronary heart disease. 713,714PUFA intake appears to reduce coronary heart disease risk, 94 but the balance between omega-6 and omega‐3 PUFAmay be important. 715 In addition to their effects on lipid metabolism, PUFA may exert a positive influence on insulinaction, appetite regulation, inflammatory responses, and muscle function. 716 Among the omega-3 LCPUFAs, EPA isthe precursor of the 3 series of prostaglandins and the 5 series of leukotrienes. 717 This suggests anti-inflammatoryand anticoagulant effects, which may explain the protective influences on cardiovascular disease. DHA is foundin high concentrations in the photoreceptors of the retina and the membranes of the brain, with implications forcognitive development and mental health. 718 Further information on fish sources of omega-3 LCPUFAs can be foundin publications from the Commonwealth Scientific and Industrial Research Organisation (CSIRO). 485,4863.1.4 Practical considerations: limit intake of foods high in saturated fatFats are found in many foods in the five food groups especially nuts and seeds, legumes/beans, avocado, oats,fish, meat (lean meats), poultry, eggs, milk and cheese. Omega-3 LCPUFA intake can be increased by eatingaccording to the Foundation Diets and Total Diets. When eating meals outside the home, lower-fat menu choicesare preferable.The most recent dietary data available in Australia show adults consume 73–101 g/day of fat, with higher intakesamong men and younger age groups. 45 Children consume 51–87 g/day of fat, with intake being higher in olderage groups. 12 The total fat intake of the population has not decreased in recent years, but now constitutes a lowerproportion of overall energy intake due to a relative increase in the consumption of carbohydrates, especiallyrefined carbohydrates. 152 Intake of total fat, in particular saturated fat, remains higher than recommended. 152However, the mean total population trans fat intake for Australia is estimated to be 0.5% of total dietary energy,which is below the WHO population goal of less than 1% of total dietary energy from TFAs. 671Guideline 3The <strong>Guidelines</strong> are realistic and practical, allowing a small amount of unsaturated oils and spreads to reflectculinary behaviour, while ensuring that the energy these foods provide are within the total energy constraintsof the diet. <strong>Dietary</strong> fat included in the Foundation Diets comes mainly from fish, lean meats, poultry and milk,yoghurt and cheese products, with a small allowance of unsaturated oils/fats/spreads. Where more energy isrequired in moving from Foundation to Total Diets, additional serves of these and/or other foods containing fatscan be included, such as additional nuts and seeds, unsaturated spreads and oils, and/or discretionary foods.However, where possible, the best choices are foods where unsaturated fats exist in greater quantities thansaturated fats. As well, people who are shorter, smaller or sedentary may have little or no scope within theirusual dietary patterns for any discretionary foods and drinks. The extra energy (kilojoules) provided by thesefoods and drinks is an additional reason to limit them. 9Foods containing predominantly saturated fat such as butter, cream, cooking margarine, coconut and palm oil,many biscuits, cakes, pastries, pies, desserts, confectionery, processed meats and some commercial burgers,pizza, fried foods, potato chips, crisps and other savoury snacks should be limited. Increasing the proportion ofunsaturated fats in the diet can be achieved by choosing vegetables, fruit, lean meats and low fat milk, yoghurtand cheese products, nuts and seeds and using small amounts of unsaturated spreads and oils. Sunflower andsafflower seed, soybean, cottonseed, sesame, corn and grape seed and the spreads and oils made from themas well as walnuts contain predominantly PUFAs. Canola seeds, nuts, peanuts, rice bran, avocados and olivesand the oils and spreads made from them, contain mainly MUFAs.Limit intake of foods containing saturated fat, added salt, added sugars and alcoholNational <strong>Health</strong> and Medical Research Council71
The foods included in the Australian Guide to <strong>Health</strong>y <strong>Eat</strong>ing generally contain low levels of saturated fat andinclude PUFAs and MUFAs in proportions that appear to be protective against heart disease risk and support themaintenance of cognitive function. 8The companion resources provide more detailed information on the recommended number of serves and servesizes of unsaturated spreads and oils required for different population groups (see Tables 3.2 and 3.3). Discussionof dietary patterns and the environment is included in Appendix G.Table 3.2: Recommended allowance for number of serves of unsaturated spreads and oils per dayAge (years)Number of serves*Boys 2–3 ½4–8 19–11 112–13 1 ½14–18 2Men 19–50 451–70 470+ 2Girls 2–3 ½Guideline 34–8 19–11 112–13 1 ½14–18 2Pregnant (up to 18 years) 2Breastfeeding (up to 18 years) 2Women 19–50 251–70 270+ 2Pregnant (19–50 years) 2Breastfeeding (19–50 years) 2Note: *Additional amounts of the five food groups or unsaturated spreads and oils or discretionary choices are needed only by peoplewho are taller or more active to meet additional energy requirements.Source: Food Modelling System. 9Table 3.3: Standard serve size equivalents of unsaturated spreads and oilsFood groupUnsaturated spreads and oilsServe sizes (250kJ)10g polyunsaturated spread10g monounsaturated spread7g monounsaturated or polyunsaturated oil, for example olive, canola or sunflower oil10g tree nuts or peanuts or nut pastes/buttersSource: Food Modelling System. 972EAT FOR HEALTH – australian dietary guidelinesNational <strong>Health</strong> and Medical Research Council
Infants<strong>For</strong> infants under the age of around 6 months, breast milk provides an ideal amount and type of fat. The guidelinerecommendation on fat intake for the adult population does not apply to young children, particularly thoseaged less than 2 years. The amounts and types of fat required for infants are related to physiological and healthoutcomes. 8 Even a small energy deficit during this period of rapid development may affect growth. 8 Neurologicaldevelopment is particularly rapid in the first 2 years of life and restriction of the fat intake during that time mayinterfere with optimal energy intake and reduce the supply of essential fatty acids, particularly omega-3 LCPUFAsneeded by developing nervous tissue, adversely affecting growth and development.Children and adolescentsReduced fat milk is recommended from the age of 2 years, when milk plays a less dominant role in the diet.A high-fat diet is likely to be energy-dense, contributing to excess energy intake and the development of obesity.Even at a young age, a diet high in saturated fats may predispose children and adolescents to the development ofcardiovascular disease later in life and the evidence supports this advice on fat intake for children from 2 years ofage. 35,719 Introducing healthy eating patterns in early childhood influences dietary patterns in later childhood. 720,721Older peopleLow fat diets are not suitable for convalescent older people and frail elderly people (to whom these <strong>Guidelines</strong>do not apply) because of the possible adverse effects of energy restriction in these groups. However, for thoseaged 65–75 who are well, the type and amount of fat in the diet deserves consideration. Although the increasedrelative risk of raised plasma cholesterol for coronary heart disease tends to be lower in older people than inyounger adults, lowering lipid levels can reduce risk of ischaemic heart disease regardless of age. 722Aboriginal and Torres Strait Islander peoplesLimiting intake of excess energy from any source, including foods high in fat, is particularly important giventhe higher prevalence of obesity in Aboriginal and Torres Strait Islander groups compared to non-IndigenousAustralians. 28,30 Limiting saturated fat and increasing unsaturated fats are important given the high prevalenceof coronary heart disease, and decreased saturated fat intake may also improve insulin sensitivity.Guideline 3People from culturally and linguistically diverse groupsThe profile of dietary fat will vary depending on traditional culinary use. Food product labels may assist people inlearning about the amounts and types of fats in unfamiliar or newly introduced manufactured foods.3.2 Limit intake of foods and drinks containing added salt3.2.1 Setting the scene<strong>Dietary</strong> guidelines have recognised the role of sodium in elevating blood pressure since the US Surgeon General’sreport released in 1979. 723 Initial advice to the public was framed to reduce consumption of discretionary salt, suchas salt added at the table or during cooking. However, sodium occurs naturally in food, and sodium-containingadditives are also added to manufactured and processed foods. It is now recognised that processed foods are themajor source of sodium in Western diets. In these <strong>Guidelines</strong>, ‘salt’ refers to sodium chloride and is never used asa synonym for the total amount of sodium in foods.Since the 2003 edition of the dietary guidelines, the evidence for a relationship between reducing sodium intakeand reducing blood pressure has strengthened, particularly in people classified as having normal blood pressure.In addition, there is now some evidence indicating that reducing sodium may result in a reduction in mortality,stroke and heart disease for those with hypertension, but not, as yet, for those with normal blood pressure.Limit intake of foods containing saturated fat, added salt, added sugars and alcoholNational <strong>Health</strong> and Medical Research Council73
3.2.2 The evidence for ‘limit intake of foods and drinks containing added salt’The evidence for the guideline recommendation focuses on dietary sodium intake, rather than salt intake, becausemost studies forming the body of evidence statements measured total sodium intake or urinary sodium excretion(which is a marker of sodium intake from all sources including salt, other additives containing sodium, andnaturally occurring sodium).Table 3.4: Evidence statements for ‘limit intake of foods and drinks containing added salt’Evidence statementDecreasing consumption of sodium decreases blood pressure in normotensive adults; a reduction of 1,800 mg reducessystolic blood pressure by about 2 mmHg and diastolic blood pressure by about 1 mmHg.Decreasing consumption of sodium decreases blood pressure in hypertensive adults; a reduction of 1,800 mg reducessystolic blood pressure by about 5 mmHg and diastolic blood pressure by about 3 mmHg.Consuming a diet low in sodium reduces blood pressure in children up to 18 years of age.Reducing sodium intake by about 1,000 mg/day is associated with reduced risk of cardiovascular events.GradeAABCNotes: Grades – A: convincing association, B: probable association, C: suggestive associationIncludes evidence statements and gradings from the Evidence Report (literature from years 2002–2009). Does not include evidence fromother sources, such as the 2003 edition of the dietary guidelines (in which individual studies were classified according to their design aslevel I, II or III but overall grades for relationships were not derived), although these sources have been used to inform these <strong>Guidelines</strong>.Grade C evidence statements showing no association and all Grade D statements can be found in Appendix E.Guideline 3Cardiovascular disease• Blood pressure: Reducing sodium intake reduces both systolic and diastolic blood pressure, and the effect isgreater in those with hypertension than in those with normal blood pressure: 724-727––in adults with normal blood pressure, a reduction of 1,800 mg per day reduces systolic blood pressure byabout 2 mmHg and diastolic blood pressure by about 1 mmHg (Grade A; Evidence Report, Section 13.1)––in adults with hypertension, a reduction of 1,800 mg per day reduces systolic blood pressure by about5 mmHg and diastolic blood pressure by about 3 mmHg (Grade A; Evidence Report, Section 13.1) 724-739––There is evidence of a probable association between a diet low in sodium and a reduction in blood pressurein children up to 18 years of age (Grade B; Evidence Report, Section 13.2). 726,739,740The <strong>Dietary</strong> <strong>Guidelines</strong> for Americans, 2010 drew similar conclusions regarding the relationship between sodiumand blood pressure. They state ‘a strong body of evidence has documented that in adults, as sodium intakedecreases, so does blood pressure. A moderate body of evidence has documented that as sodium intakedecreases, so does blood pressure in children, from birth to 18 years of age’. 198 They also note that people withhypertension, diabetes and chronic kidney disease are more sensitive to sodium than healthier younger people,and that sensitivity to sodium increases with age.• Cardiovascular disease: Despite extensive research on the relationship between sodium and blood pressure,few long-term studies have examined changes in sodium intake related to changes in cardiovascular morbidityand mortality. Past studies have mainly included subjects with hypertension. The evidence suggests thatreducing sodium intake by about 1,000 mg/day is associated with reduced risk of cardiovascular events(Grade C; Evidence Report, Section 13.4). 725,741-746 The results are consistent with drug trials showing thatreductions in hypertension also lead to decreases in adverse cardiovascular outcomes. 747,748CancerEvidence of a probable association between consumption of salt and salt-preserved foods with gastric cancer wasfound in the systematic review prepared as the background paper for the Joint WHO/FAO Expert Consultationon diet, nutrition and prevention of chronic diseases. 749 This association was described as convincing by theWCRF report (see Appendix F). 43 The WCRF report also reported convincing evidence of an association betweenprocessed meats (meat preserved by smoking, curing, salting or addition of chemical preservatives such asnitrites) and increased risk of colorectal cancer (see Appendix F) 43 but it is unclear whether the factor responsibleis the salt, other components such as nitrites, or a combination of these factors.74EAT FOR HEALTH – australian dietary guidelinesNational <strong>Health</strong> and Medical Research Council
Bone healthEvidence suggesting an association between a low sodium diet and markers of bone health in postmenopausalwomen is inconclusive (Evidence Report, Section 13.3).3.2.3 How limiting intake of foods and drinks containing added salt may improvehealth outcomesSodium and other electrolytes are needed to maintain extracellular volume and serum osmolality. There arevarious systems and hormones that influence sodium balance including the renin-angiotensin-aldosteronehormone system, the sympathetic nervous system, atrial natriuretic peptide, the kallikrein-kinin system,various intrarenal mechanisms, and other factors that regulate renal and medullary blood flow. 8Future data may lead to a refined understanding of the underlying mechanisms. <strong>For</strong> example, the ratio of sodium topotassium may influence blood pressure more strongly than the amount of sodium alone 742-744 and reducing sodiumintake may be particularly important for overweight people with certain conditions. 745 The <strong>Dietary</strong> <strong>Guidelines</strong> forAmericans, 2010 comment that the effects of higher sodium intake can be countered if potassium intake isalso higher and note that potassium intake in the US is lower than desirable. 1983.2.4 Practical considerations: Limit intake of foods and drinks containing added saltThere has been a shift in the language on this issue. The first edition of the dietary guidelines included therecommendation to ‘<strong>Eat</strong> less salt’. 750 The second edition revised this to ‘Choose low salt foods and use saltsparingly’. 751 The third edition advised Australians to ‘Choose foods low in salt’. 36 In these <strong>Guidelines</strong>, it isrecognised that any reduction in dietary sodium will reduce blood pressure in those with normal levels ofblood pressure, reduce risk of developing hypertension and also reduce blood pressure in those with elevatedblood pressure.The NRV Document recommends an intake of sodium in the range 460–920mg/day for adults to cover the essentialrequirement. Current advice in Australia is for dietary sodium intake to be preferably less than 1,600mg/day for adultsor no higher than the set Upper Level (UL) of 2,300mg/day. 8 Among those with high sodium intake, reduction insodium intake would reduce blood pressure even if specific targets were not achieved.Diets that are consistent with the <strong>Guidelines</strong> will help to limit sodium intake. Fresh, unprocessed or minimallyprocessed foods such as fresh vegetables (including legumes/beans) and fruit, frozen or tinned vegetables(including legumes/beans) and fruit with no added salt, meats, fish and milk are generally lower in sodium.Some breads and cereal products and cheeses have higher levels of salt and make a significant contribution tosodium intake, although there is considerable variation between products and brands. However, these foodsprovide other important health benefits outlined in relevant sections of the <strong>Guidelines</strong>. The public should not avoidthese foods, but should be encouraged to check food labels and select lower-sodium products in these categories.Some foods are labelled ‘low sodium/salt’ if the food contains no more than 120mg of sodium per 100g. 752Not all foods that meet this criterion carry a ‘low sodium’ claim.Guideline 3Because salt is 40% sodium, avoiding discretionary salt in cooking or at the dinner table will also reduce sodiumintake (the set UL of 2,300mg/day is approximately equal to 6g of table salt). In the 1995 National NutritionSurvey, 62% of the population aged 2 years and older reported always or usually adding salt at the table or duringcooking. 45 Since 1995, Asian-style cooking has become increasingly popular in Australia and many Asian-stylesauces such as soy, oyster and fish sauces are particularly high in sodium. Lower sodium options of these foodsshould be chosen, recognising that they may still have high sodium content. Salt substitutes or ‘lite’ salts thatreplace some sodium chloride with potassium chloride can provide a salt taste with lower levels of sodium.Herbs, spices, garlic, lemon juice and vinegars can also be used to season foods without adding salt.Iodine deficiency previously existed in Australia and has re-emerged in recent years. Iodised salt is one way toincrease iodine intake. Since 2009, it has been mandatory for any salt used in commercial bread baking to beiodised (organic bread is exempt from this requirement). 753 Milk and dairy foods are an important source ofiodine in Australia.Pregnant and breastfeeding womenAdvice to limit the intake of sodium for the general population is also applicable to pregnant and breastfeedingwomen. 754Limit intake of foods containing saturated fat, added salt, added sugars and alcoholNational <strong>Health</strong> and Medical Research Council75
InfantsFSANZ sets maximum limits for the sodium content of commercially prepared infant foods such as rusks, biscuitsand other ready-to-eat foods, and prohibits the addition of salt to fruit-based foods, fruit drinks and vegetablejuices. 755 These restrictions are needed because infants have a lower renal capacity than older children and adults.Parents and carers who are introducing infants to solid foods should be advised to minimise the infant’s sodiumintake. This means preparing homemade infant foods without salt or ingredients that are high in salt or sodium,and minimising infants’ intake of other processed foods that are high in sodium.Children<strong>For</strong> children with average energy needs, the dietary patterns in the Food Modelling System 9 contain up to 50%less sodium than the average sodium intakes reported in the 2007 Australian National Children’s Nutrition andPhysical Activity Survey. 12Older peopleTaste perception decreases with age and can be a factor in decreased food intake and malnutrition. <strong>For</strong> a chronicallyill older person who has hypertension, clinicians need to weigh up the benefit of adding salt to food to improveflavour (with improved intake and quality of life, and reduced risk of malnutrition) against the risks of hypertensionand its management. <strong>For</strong> chronically ill older people who do not have hypertension, salt intake can be determinedby personal preference and maintaining food intake is a priority.Guideline 33.3 Limit intake of foods and drinks containing added sugars3.3.1 Setting the sceneSugars are carbohydrates – examples include fructose, glucose, lactose and sucrose. When sugars occur naturallyin foods such as fruit, vegetables and dairy products, they are referred to as intrinsic sugars. However, the majorsource of sugar in the Australian diet is sucrose from sugar cane that is added to foods and is termed extrinsicsugar. Sucrose is widely used in processed foods and drinks as a sweetener and also plays a role as a flavourenhancer and preservative.Sugars provide a readily absorbed source of energy, but added sugars can increase the energy content of the dietwhile diluting its nutrient density. <strong>Dietary</strong> modelling illustrates that nutrient density may also be compromised bya high intake of added sugars and the Total Diet does not allow for excess amounts of foods or drinks with addedsugars. 9 At any given level of energy intake, as the proportion of added sugars in the diet increases, the nutrientdensity will fall. 756 This was quantified in a recent analysis of National <strong>Health</strong> and Nutrition Examination Survey(NHANES) data (2003–2006) which noted that intake of essential nutrients was less with each 5% increase inadded sugars above 5–10% of energy. 757Sugars are a factor in dental caries and diets high in added sugars are also associated with some adverse healthoutcomes. Sugar-sweetened drinks (sugar-sweetened soft drinks and cordials, fruit drinks, vitamin waters, energyand sports drinks) are the largest source of sugars in the Australian diet, with consumption highest in adolescentsand children. 45 New evidence emphasises the relevance of sugar-sweetened drinks to the development of excessweight (see Chapter 1).Dental caries are a significant public health problem in Australia. In 2007–08, $6.1 billion was spent on total dentalservices in Australia, representing 6.2% of all health expenditure. 758 In severe cases, dental caries can cause lossof teeth and pain that may reduce dietary intake and compromise nutritional status.Fructose and/or high fructose corn syrups are commonly used as a sweetener in the US. It should be noted thatthese are not commonly used in the Australian food supply.76EAT FOR HEALTH – australian dietary guidelinesNational <strong>Health</strong> and Medical Research Council
3.3.2 The evidence for ‘limit intake of foods and drinks containing added sugars’All previous Australian dietary guidelines have recommended restricting added sugars. There has been littlechange in the evidence linking added sugars with dental caries, but the targeted literature review foundstrengthened evidence for a relationship between sugar-sweetened drinks and excess weight gain.Table 3.5: Evidence statements for ‘limit intake of foods and drinks containing added sugars’Evidence statementConsumption of sugar-sweetened beverages is associated with increased risk of weight gain in adults and children.High or frequent consumption of added sugars, particularly for infants and young children, is associated with increased riskof dental caries.Consumption of soft drink is associated with increased risk of dental caries in children.Consumption of soft drinks is associated with increased risk of reduced bone strength.GradeBCCCNotes: Grades – A: convincing association, B: probable association, C: suggestive associationIncludes evidence statements and gradings from the Evidence Report (literature from years 2002–2009). Does not include evidence fromother sources, such as the 2003 edition of the dietary guidelines (in which individual studies were classified according to their design aslevel I, II or III but overall grades for relationships were not derived), although these sources have been used to inform these <strong>Guidelines</strong>.Grade C evidence statements showing no association and all Grade D statements can be found in Appendix E.Cardiovascular disease, type 2 diabetes and excess weight• Cardiovascular disease: There is no new evidence that sugars play a causal role in the development ormoderation of cardiovascular risk factors. Early studies suggested that reducing dietary sucrose could lowerelevated triglyceride levels, but it is likely that the effects were the result of a reduction in energy intake andbody weight. 759• Type 2 diabetes: Insufficient studies were identified to develop an evidence statement for intake of sugars andtype 2 diabetes. 760,761 However, more recent studies indicate that sugar-sweetened drinks may increase the riskof developing type 2 diabetes. 762 A recent meta-analysis also supports an increased risk of type 2 diabetes andthe metabolic syndrome from consumption of sugar-sweetened drinks. 763Guideline 3• Excess weight: Recent studies show evidence of a probable association between sugar-sweetened drinks andweight gain in adults and children (Grade B; Evidence Report, Section 15.1). 185-196 A more recent longitudinalstudy also strengthens the evidence associating sugar-sweetened drinks with weight gain. 764• There is insufficient consistent evidence available to form an evidence statement about fruit juices and weightgain. Some studies found no association in children, 193,217,218,585 while two studies in children 186,765 and one inadults 766 did find an association. Children drinking less fruit juice 206 and those consuming more fruit 194 had lowerBMI Z-scores, and children at risk of becoming overweight had a higher risk of gaining fat if they consumedfruit juice. 186• No large studies have measured the long-term development of overweight and obesity specifically related toconsumption of sugars, although one retrospective cohort study reported that adults who consumed fewersugar-sweetened foods had less increase in skinfold fat and waist circumference over a 5-year period(Evidence Report, Section 14.3). 206CancerThere is evidence suggesting that consumption of sucrose is not associated with risk of cancer (Grade C;Evidence Report, Section 14.1). 767-771 The WCRF report found no convincing or probable evidence of increasedrisk of all cancers with the intake of sugars, but some limited evidence of an association between a high intakeof sugars and increased risk of colorectal cancer (see Appendix F). 43 The most recent WCRF statements urgecaution with energy-dense foods and sugar-sweetened drinks because of their association with obesity and itslink with some cancers (see Appendix F). 43Limit intake of foods containing saturated fat, added salt, added sugars and alcoholNational <strong>Health</strong> and Medical Research Council77
Other conditions• Dental caries: The relationship between sucrose and dental caries was first documented more than a centuryago 772 and has been confirmed in numerous studies since then. 773 Historically, the prevalence of dental carieshas increased when dietary patterns have changed to include more added sugars and foods containing refinedstarches. New evidence supports past findings and suggests that high or frequent consumption of added sugars,particularly for infants and young children, is associated with increased risk of dental caries (Grade C; EvidenceReport, Section 14.2). 774-778 The evidence also suggests that dental caries are related to sugar-sweetened drinks(Grade C; Evidence Report, Section 15.4). 774,776• Caries are associated with national per capita yearly sucrose consumption, with very few caries in childrenconsuming 10kg/year (about 30g/day) or less. A steep increase may occur from 15kg/year upwards. 88• The sugars contained in the cellular structure of foods, such as the intrinsic sugars of fresh fruit and vegetables,have been found to have little cariogenic potential, whereas foods high in added sugars are most damagingto teeth. 779• Bone strength: Evidence suggests an association between consumption of soft drinks and increased riskof reduced bone strength (Grade C; Evidence Report, Section 15.3). 650-653 Cola drinks (sugar-sweetened anddiet varieties), but not other carbonated drinks, are associated with significantly lower bone mineral density inwomen, but not in men. 653 In young men, significant adverse changes in indices of bone remodelling and boneresorption markers occurred when cola drinks were added to a low-calcium diet, compared with adding milk. 650A systematic review reported an inverse relationship between soft drink consumption and milk intake. 195Guideline 3• It appears that soft drink consumption is associated with some problems related to bone health, but, with theexception of some limited evidence related to cola drinks, it remains unclear whether soft drinks exert a directeffect or reflect an inverse relationship with milk consumption.• Attention deficit hyperactivity disorder (ADHD): There is no evidence that added sugars are involved in theaetiology of ADHD. 7803.3.3 How limiting intake of foods and drinks containing added sugars may improvehealth outcomesDental caries: Important factors for development of caries include the bacterium Streptococcus mutans, dietarysugars and a susceptible tooth surface. Fermentable carbohydrates (both sugars and starches) are a substratefor bacteria such as S. mutans and S. sobrinus, which increase the acid-producing potential of dental plaque. 781<strong>Dietary</strong> sugars other than sucrose (e.g. glucose and lactose) can also induce caries, although these sugars areless cariogenic than sucrose because, in addition to being converted to acid metabolites, sucrose is uniquelyused for extracellular polysaccharide synthesis.Oral hygiene, dental care, fluoridated water supplies, the type of food and salivary function are also important.The more frequently foods containing added sugars are consumed, the greater the risk of caries, since frequentconsumption does not allow remineralisation of the teeth. 782 The duration of exposure depends on how longsugary foods stay in the mouth and the number of eating occasions. On the basis of the scientific evidence,advice on sugar intake for preventing dental caries should include frequency of intake as well as the amount.The acidity of sweetened drinks is also relevant to dental erosion, a major factor in dental decay. 657 This appliesequally to sugar-sweetened or diet soft drinks, since their acidity is comparable.Excess weight: Many foods containing added sugars (e.g. soft drinks, confectionery, cakes and biscuits) areenergy-dense but nutrient-poor. The association between sugar-sweetened drinks and weight gain appears tobe related to the reduced effect on satiety of sugars in a liquid medium. Past studies found that compensationfor energy from sugar-sweetened drinks is less complete than that for energy in solid form. 783 Newer evidencesupports this failure to compensate by reducing energy intake from other foods or drinks. 762 Sugar-sweeteneddrinks therefore add to total energy intake. 78478EAT FOR HEALTH – australian dietary guidelinesNational <strong>Health</strong> and Medical Research Council
3.3.4 Practical considerations: limit intake of foods and drinks containingadded sugarsIn light of the current prevalence of overweight and obesity (see Chapter 1), the dietary guidelines of manycountries recommend significant reductions in foods that contribute to energy while providing few, if any,nutrients. 198 Many foods and drinks containing some fats, added sugars (simple carbohydrates) and somestarches (complex carbohydrates), and alcohol fit into this category. Sugars provide approximately a quarter ofchildren’s energy intake, with 4.6–7.6% of energy coming from sugar-sweetened drinks other than milk. 12There is insufficient evidence to recommend an exact intake of added sugars suitable for the whole population.From a nutritional perspective, good health can be achieved without the addition of sugars in any form tothe diet. <strong>For</strong> those who are not overweight and are already consuming an adequate diet (a minority of thepopulation), added sugars relate mainly to the problem of dental caries. <strong>For</strong> the majority of the population,however, overweight and obesity are major problems and require a reduction in energy intake. Limiting addedsugars, particularly from sugar-sweetened drinks, is one strategy for adults and children. The World <strong>Health</strong>Organization recommends that no more than 10% of energy should come from added sugars. 88 Recent datafrom the US suggests a level of 5–10% of energy from added sugars may be appropriate. 757 This is much lessthan current Australian consumption, reinforcing the continued need for this Guideline.InfantsBaby-bottle caries is a recognised problem in infants who are pacified by sucking on a bottle for long periods.Babies who fall asleep while continuing to feed from a bottle containing infant formula, fruit juice or othersugar-containing liquid can develop a severe form of tooth decay. 785 Infants do not need added sugars andFSANZ stipulates that ready-prepared infant foods with more than 4g of added sugars per 100g must belabelled as ‘sweetened’. 755 <strong>For</strong> further information, see the Infant Feeding <strong>Guidelines</strong>. 351Children and adolescentsMilk and water are the recommended drinks for children. Children and adolescents should limit intake ofsugar-sweetened drinks. Common sugar-sweetened drinks include soft drink, ‘sports drinks’, ‘vitamin waters’,cordials, fruit drinks and energy drinks. Energy drinks may also be high in caffeine and are not suitable forchildren. Sweetened flavoured milk provides nutrients but can be energy dense; plain milk is preferable.Guideline 3Older peopleIncluding a moderate amount of added sugars as a flavour enhancer can increase variety and palatability forolder people and may not compromise nutrient intake if added to nutritious foods. Sugars are also a readilyabsorbed source of energy for frail elderly people.Aboriginal and Torres Strait Islander peoplesIn remote Aboriginal communities, apparent consumption of sugars is much higher than the Australian averagewhile consumption of fruit and vegetables is well below the Australian average. 352 In remote communitieswhere apparent consumption was measured, added sugars contributed approximately 30% of total energyintake, with 60% of the sugars in the form of white sugar added to foods and drinks. No data are available forurban Aboriginal and Torres Strait Islander communities. Historically, Aboriginal Australians had substantiallyfewer dental caries than non-Indigenous people, but this trend has been reversed with the oral health ofnon-Indigenous children improving and that of Aboriginal children deteriorating. 786 Aboriginal children andchildren from lower socioeconomic groups have not had the improvement in dental health seen in other children.Limit intake of foods containing saturated fat, added salt, added sugars and alcoholNational <strong>Health</strong> and Medical Research Council79
3.4 Limit intake of alcohol3.4.1 Setting the scene<strong>For</strong> many people, an alcoholic drink is a regular and enjoyable part of meals. In terms of nutrition, alcohol isuniquely the only substance that is both a food providing energy and a drug affecting brain function. <strong>For</strong> thesereasons, advice on alcohol is included in these <strong>Guidelines</strong>.Drinking alcohol has health, social and economic costs and benefits for both individuals and populations. There issome evidence that people who drink small quantities of alcohol may have better health outcomes than thosewho do not drink, 787 but such findings have been challenged. 788,789 Heavy drinking has no health benefits andstudies consistently report that abstainers have better health outcomes than heavy drinkers.In the Australian population, alcohol is responsible for 3.3% of the total disease burden and prevents 1% of the totaldisease burden. This equates to a net effect of 2.3%, equivalent to 61,091 disability-adjusted life years (DALYs) and0.8% (1,084) of all deaths. 10 Among Aboriginal and Torres Strait Islander peoples, alcohol is responsible for a net 5.4%of the total disease burden and 6.7% of all deaths. 790 Alcohol is second only to tobacco as a preventable cause ofdrug-related death and hospitalisation. 791The total social costs of alcohol were $15.3 billion in 2004–05, the majority (71%) being for tangible costs suchas reduction of the workforce, absenteeism, health care, law enforcement, alcohol education campaigns andresearch. 792,793The NHMRC 2009 Australian guidelines to reduce health risks from drinking alcohol (NHMRC Alcohol<strong>Guidelines</strong>) 794 provide guidance for Australians on reducing their risk of harm from drinking alcohol.Guideline 3The NHMRC Alcohol <strong>Guidelines</strong> are as follows.Guideline 1Guideline 2Guideline 3<strong>For</strong> healthy men and women, drinking no more than two standard drinks on any one dayreduces the lifetime risk of harm from alcohol-related disease or injury.<strong>For</strong> healthy men and women, drinking no more than four standard drinks on a single occasionreduces the risk of alcohol-related injury arising from that occasion.<strong>For</strong> children and young people under 18 years of age, not drinking alcohol is the safest option.a. Parents and carers should be advised that children under 15 years of age are at thegreatest risk of harm from drinking and that for this age group, not drinking alcohol isespecially important.b. <strong>For</strong> young people aged 15–17 years, the safest option is to delay the initiation of drinkingfor as long as possible.Guideline 4Maternal alcohol consumption can harm the developing foetus or breastfeeding baby.a. <strong>For</strong> women who are pregnant or planning a pregnancy, not drinking is the safest option.b. <strong>For</strong> women who are breastfeeding, not drinking is the safest option.Most recommendations on alcohol consumption are made on the basis of ‘standard’ drinks consumed. A standarddrink in Australia contains 10g of alcohol (equivalent to 12.5ml of alcohol). 794 The alcohol concentration of drinksis printed on the label in terms of percentage by volume. However in social situations serve sizes are greaterthan standard drinks – for example a typical glass of wine in Australia is 170ml 795 which, depending on the alcoholcontent of the wine, is more than one ‘standard’ drink and likely to be closer to two ‘standard’ drinks.<strong>For</strong> some groups, the contribution of alcohol to energy intake is significant. Median percentages of contribution ofalcohol to energy intake for age and sex groups and the energy content of common alcoholic drinks is included inAppendix K. <strong>For</strong> example, if a man with average energy intake consumed four standard drinks of beer, this wouldaccount for 13–15% of his energy intake. The proportion of energy obtained from alcohol for those who consumeit peaks at age 19–24 for women and 25–44 for men, and declines thereafter.If the consumption of other foods or drinks is reduced to adjust for the extra energy intake from alcohol, over timethis could lead to a deficiency of key nutrients. In view of the increasing prevalence of overweight and obesity,limiting alcohol intake is an important strategy for achieving energy balance.80EAT FOR HEALTH – australian dietary guidelinesNational <strong>Health</strong> and Medical Research Council
3.4.2 The evidence for ‘limit intake of alcohol’The evidence underpinning the guideline recommendation utilises the NHMRC Alcohol <strong>Guidelines</strong> and additionalevidence sourced from the Evidence Report.Table 3.6: Evidence statements for ‘limit intake of alcohol’Evidence statementConsuming alcohol regularly at an intake of one standard drink per day for women and one and a half to two per day for menis associated with a reduced risk of cardiovascular disease morbidity and mortality.Consuming alcohol regularly at an intake of one standard drink per day for women and one and a half to two per day for menincreases HDL cholesterol.Consumption of alcohol, even at low levels (10–15g/day), is associated with increased risk of breast cancer.Consumption of alcohol is associated with increased risk of cancer of the oesophagus.Consumption of alcohol, even at low levels (10g/day), is associated with an increased risk of colon cancer and rectal cancer.Consumption of alcohol, even at low levels (10g/day), is associated with increased risk of liver cancer in some populations.Consumption of alcohol is associated with an increased risk of cancer of the oral cavity, pharynx and larynx.Consumption of alcohol at the level of one standard drink per day for women and one and a half to two per day for men, witha maximum intake of four standard drinks per day, is associated with reduced risk of dementia in older adults.GradeBBBBCCCCNotes: Grades – A: convincing association, B: probable association, C: suggestive associationIncludes evidence statements and gradings from the Evidence Report (literature from years 2002–2009). Does not include evidence fromother sources, such as the 2003 edition of the dietary guidelines (in which individual studies were classified according to their design aslevel I, II or III but overall grades for relationships were not derived), although these sources have been used to inform these <strong>Guidelines</strong>.Grade C evidence statements showing no association and all Grade D statements can be found in Appendix E.Cardiovascular disease and type 2 diabetesGuideline 3• Cardiovascular disease: There is evidence of a probable association between consumption of one standarddrink per day for women and one and a half to two per day for men with a reduced risk of cardiovasculardisease morbidity and mortality (Grade B; Evidence Report, Section 16.1). 796-798 A meta-analysis evaluating therelationship between alcohol intake and cardiovascular mortality in patients with a history of cardiovasculardisease showed a J-shaped dose effect curve, with an alcohol intake of approximately 26 g/day having maximalprotection. The authors concluded that light to moderate alcohol consumption, defined as 5–25g/day, issignificantly associated with a lower incidence of cardiovascular and total mortality. 799 However the evidenceis not yet conclusive, particularly for Asian populations. 787,788,800,801• There is evidence of a probable association between consumption of one standard drink per day for womenand one and a half to two standard drinks per day for men with an increase in HDL cholesterol (Grade B;Evidence Report, Section 16.1). 802-809 Recent reviews of population-based studies 799,810,811 support these findings.• Although an insufficient number of studies were identified to formulate an evidence statement, excess alcoholconsumption has been found to increase the risk of hypertension. 812,813 A more recent review supports thesefindings, suggesting a synergistic effect between alcohol, hypertension and cerebrovascular events. 814• Canadian and Australian guidelines on the management of hypertension include moderation of alcohol intake asan important intervention. 815 Hypertension is a major risk factor for both ischaemic and haemorrhagic stroke. 816• Type 2 diabetes: Evidence regarding an association between alcohol intake and risk of type 2 diabetes isinconclusive (Evidence Report, Section 16.2).Limit intake of foods containing saturated fat, added salt, added sugars and alcoholNational <strong>Health</strong> and Medical Research Council81
CancerThere is increasing evidence of an association between alcohol consumption and heightened risk of specific cancers.In general, the evidence suggests that different types of alcoholic drink have similar effects. 43 The WCRF reportconcludes that the number of cancers for which alcohol is a known risk factor is increasing (see Appendix F). 43It appears unlikely that there is a threshold of alcohol intake below which there is no effect on cancer risk.• Breast cancer: There is evidence of a probable association between consumption of alcohol, even at low levels(10 g/day), and an increased risk of breast cancer (Grade B; Evidence Report, Section 16.4). 817-823 The WCRF reportfound a convincing association between consumption of alcohol and risk of breast cancer (see Appendix F). 43• Oesophageal cancer: There is evidence of a probable association between consumption of alcohol and anincreased risk of cancer of the oesophagus (Grade B; Evidence Report, Section 16.6). 43,817 The WCRF reportfound a convincing association between consumption of alcohol and risk of cancer of the oesophagus(see Appendix F). 43• Colon and rectal cancer: The evidence suggests that consumption of alcohol, even at low levels (10 g/day),is associated with an increased risk of colon cancer and rectal cancer (Grade C; Evidence Report,Section 16.5). 43,817,824,825• Liver cancer: The evidence suggests that consumption of alcohol, even at low levels (10 g/day), is associated withincreased risk of liver cancer in some populations (Grade C; Evidence Report, Section 16.9). 43,817 The WCRF reportfound a probable association between the consumption of alcohol and risk of liver cancer (see Appendix F) 43 .• Oral cavity, pharynx and larynx: The evidence suggests that consumption of alcohol is associated with anincreased risk of cancer of the oral cavity, pharynx and larynx (Grade C; Evidence Report, Section 16.7). 43,817,826Guideline 3• Non-Hodgkin lymphoma: Evidence that the consumption of alcohol is associated with non-Hodgkinlymphoma is inconclusive (Evidence Report, Section 16.11).• Other cancers: The evidence that consumption of alcohol is associated with renal, pancreatic and ovariancancer is inconclusive (Evidence Report, Sections 16.8, 16.10 and 16.12).Other conditions• Alcohol-related liver disease: As discussed in the 2003 edition of the dietary guidelines, there is continuingevidence that excess alcohol consumption is associated with an increased risk of alcohol-related liver disease(fatty liver, cirrhosis of the liver, alcoholic hepatitis). 827 The same level of average consumption is related to ahigher risk of liver cirrhosis in women than in men. 828• Dementia: The evidence suggests an association between the consumption of one standard drink per day forwomen and one and a half to two standard drinks per day for men, with a maximum intake of four standarddrinks per day, and a reduced risk of dementia in older adults (Grade C; Evidence Report, Section 16.3). 829-835• Mental health: Alcohol use is associated with an increased risk of a number of mental health and social problemsin young adults. 836 The existence of psychiatric comorbidities in young people who drink heavily is common,especially for conditions such as depression, anxiety, bipolar disorder, conduct disorder and attention-deficit/hyperactivity disorder. 836-840• Nutrition-related conditions: Alcohol consumption is linked to malnutrition, Wernicke-Korsakoff syndrome,folate deficiency, vitamin A depletion and pellagra. 841 Excessive consumption of alcohol (severe alcoholism)leads to malnutrition if normal diet is neglected. The financial resources of the patient can be diverted awayfrom purchase of food to acquiring and consuming alcohol. In Australia the fortification of bread with thiaminehas contributed to a 40% reduction in the incidence of Wernicke-Korsakoff syndrome. 842,843Other conditions associated with harmful levels of alcohol consumption include: 794• dependence and addiction• endocrine conditions (e.g. hypercortisonism and sexual dysfunction)• alcohol-related brain damage including alcoholic dementia• gastritis and gastric ulcers• aspiration pneumonia• cardiomyopathy• interactions with pharmaceuticals and illegal recreational drugs.82EAT FOR HEALTH – australian dietary guidelinesNational <strong>Health</strong> and Medical Research Council
3.4.3 How limiting intake of alcohol may improve health outcomesAlcohol begins to affect the brain within 5 minutes of consumption, with blood alcohol concentration peaking after30–45 minutes. It takes approximately 1 hour for the liver to clear the alcohol from one standard drink from thebody, although this time varies depending upon liver size, lean body mass, individual alcohol tolerance and genescontrolling the expression of alcohol-metabolising enzymes in the liver. 844-846 Because the rate of metabolism isfixed, rapid consumption of multiple drinks results in a higher blood alcohol concentration. 794Young adults who drink heavily tend to have smaller prefrontal cortices and white matter, structural abnormalitiesof white matter and reduced hippocampal volumes. 847,848 These structural changes lead to a diminished ability toretrieve verbal and non-verbal material and poorer performance in attention-based tests. 836The loss of brain tissue that occurs in people with chronic alcoholism seems to occur independently of Wernicke’sencephalopathy and may be related to ethanol toxicity and poor nutrition.• Cardiovascular effects: The effect of alcohol on the cardiovascular system is complex. Alcohol can raise bloodpressure and increase the risk of arrhythmias, shortness of breath, some types of cardiac failure, haemorrhagicstroke and other circulatory problems. However, low levels of alcohol raise HDL cholesterol and reduceaccumulation of plaque in arteries. 810,849 Alcohol can also have a mild anticoagulant effect.• Diabetes: Alcohol affects the management of type 1 and type 2 diabetes through its effects on diet andcontrol of blood glucose levels. Alcohol interferes with the action of insulin, insulin secretagogues andglucagon, thereby increasing the risk of hypoglycaemia in people with type I or 2 diabetes who take thesemedications. 850,851• Dementia: The suggested protective relationship between alcohol and dementia may relate to the effect ofalcohol on blood lipids as one of the causal factors of dementia is microvascular changes within the brain. 852,8533.4.4 Practical considerations: limit intake of alcoholOf Australians aged over 14 years, 83% reported having consumed alcohol at least once in the 12 monthspreceding the 2007 National Drug Strategy Household Survey, with 8% drinking alcohol on a daily basis andabout 47% consuming alcohol at least weekly. 854 The majority of Australians who reported consuming alcoholalso reported moderating their intake, primarily to reduce the risk to their health. Methods included countingand limiting the number of drinks, eating food while consuming alcohol, alternating between alcoholic andnon-alcoholic drinks and drinking low-alcohol drinks. 854Guideline 3Nearly all alcohol is consumed as drinks, principally beers, wines, spirits and ciders. Alcoholic drinks contain fewother nutrients except for the bioactive flavonoids found in wine (mainly red wine). Alcoholic drinks are usuallyconsumed with foods, either as part of a meal or accompanied by snack foods, increasing the associated energyintake. Some alcoholic drinks are mixed with additives including stimulants, sugars and other flavours.The apparent average consumption of alcohol is estimated at 10.08 L per person over 15 years old per year, 855and declines with age. 856 Consumption is 45% higher in the Northern Territory than in the rest of Australia.The average consumption equates to an additional 650 kJ/day for every person over 15 years of age from alcohol.Alcoholic drinks that contain added sugar have even more energy. If alcohol is consumed in addition to the normaldiet, leading to excess energy intake compared to requirements, weight will increase.A full stomach reduces the rate of absorption of alcohol into the bloodstream. Drinking alcohol in combinationwith eating therefore reduces the rate at which blood alcohol content increases. Drinking coffee, having a coldshower, vomiting or exercising do not reduce blood alcohol content. 794Pregnant and breastfeeding womenAlcohol consumption by pregnant women may harm the unborn baby. Heavy daily drinking or heavy episodes ofdrinking have the most risk, and the risk from low-level drinking (one or two drinks per week) is likely to be small.However there is no lower limit that can be guaranteed to be completely safe, so avoiding alcohol while pregnantis the safest option. 794There is limited evidence from human research on the effects of maternal alcohol consumption during lactationand infant development. In Australia, it is suggested that mothers who do consume alcohol are more likely tostop breastfeeding before six months compared to mothers who do not drink. 857,858 Animal and observationalLimit intake of foods containing saturated fat, added salt, added sugars and alcoholNational <strong>Health</strong> and Medical Research Council83
studies show that consuming two standard drinks or more per day during lactation is associated with deficits ininfant psychomotor development and disrupted infant sleep-wake behavioural patterns. 857 Although the extentis unknown, a baby’s intake of alcohol from breast milk is not harmless. 857 Alcohol levels in breast milk parallelblood alcohol levels and therefore the longer the time between drinking alcohol and breastfeeding, the safer forthe baby. The safest option for women who are breastfeeding is to abstain from alcohol. 794 <strong>For</strong> those who drink,expressing milk before consuming alcohol is the next best option. 794Children and adolescentsAlcohol use by younger people is associated with harmful effects on brain development. NHMRC recommendsthat parents and carers should be advised that children under 15 years of age are at the greatest risk of harm fromdrinking. <strong>For</strong> this age group, not drinking alcohol is especially important. <strong>For</strong> people aged 15−17 years, the safestoption is to delay drinking for as long as possible. 794Older peopleOlder people are more susceptible than others to the toxic effects of alcohol due to changes in their bodycomposition, decreased metabolic capacity, the presence of co-morbid conditions and medications that regulatethese conditions. 859Many older people take medications that may interact with alcohol. A combination of alcohol and medicationincreases the risk of falls and injury. 860-862Guideline 3The NHMRC Alcohol <strong>Guidelines</strong> state that ‘cumulative alcohol-related harm is more evident among older people.<strong>For</strong> some older adults, drinking alcohol increases the risk of falls and injuries, as well as some chronic conditions.Older people are advised to consult their health professionals about the most appropriate level of drinking fortheir health’. 794Aboriginal and Torres Strait Islander peoplesAboriginal or Torres Strait Islander peoples are more likely than other Australians to abstain from drinking alcohol(23% compared to about 15%). However, those who do consume alcohol are more likely to do so at risky orhigh-risk levels for short-term harm. 854 In response to severe problems related to excess alcohol consumptionin many Indigenous communities, including foetal alcohol syndrome 863,864 initiatives have been introduced toencourage non-harmful alcohol use, limit access to alcohol, and establish ‘dry’ areas and communities. As withthe general population, Aboriginal and Torres Strait Islander peoples should follow the alcohol guidelinesdescribed above. 794People from culturally and linguistically diverse groupsPeople from culturally and linguistically diverse groups are more likely than the general adult population in Australiato abstain from alcohol (43% compared to 15%). 854 The possible protective health effect of moderate drinkinghas not been demonstrated in Asian groups. Alcohol drinking customs vary in different cultures and typicallyimmigrant groups bring their drinking patterns from their country of origin.People with diabetesAs alcohol and hypoglycaemia have independent but additive effects on cognitive function and behaviour, it isrecommended that people with type 1 or type 2 diabetes abstain from alcohol if they plan to drive. 865 Alcoholworsens medical conditions associated with diabetes, such as liver disease, hypertension and advancedneuropathy. 850,866 People with type 1 or type 2 diabetes may need to take special precautions when drinkingand should discuss alcohol use with a health professional.Interaction of alcohol with caffeine and other stimulantsA new category of alcoholic drinks is now available in Australia that have added caffeine and/or other stimulants.There is concern that consuming stimulants such as caffeine, a central nervous system stimulant, and alcohol, adepressant, at the same time will reduce subjective perceptions of alcohol-induced impairment in comparisonto alcohol alone. 867-870In the absence of any long-term research to quantify safe levels of concurrent consumption of alcohol and addedstimulants, this combination should be used with caution.84EAT FOR HEALTH – australian dietary guidelinesNational <strong>Health</strong> and Medical Research Council
3.5 Practice guide for Guideline 3Table 3.7: Considerations in advising people from specific groups to limit intake of foods containing saturated fat,added salt, added sugars and alcoholPopulation groupConsiderationsPregnant andbreastfeeding women• Additional energy requirements should be met through extra foods from the fivefood groups rather than energy-dense discretionary foods• Not drinking alcohol while pregnant is the safest option – there is no lower limitthat can be guaranteed to be completely safe for the foetus• Abstaining from alcohol is the safest option for women who are breastfeeding –for those who drink, expressing milk before consuming alcohol is the nextbest optionInfants• Babies who fall asleep while continuing to feed from a bottle containing infantformula, fruit juice or other sugar-containing liquid can develop a severe form oftooth decay• When solid foods are introduced, salt and sugar should not be added to preparedfood and the salt and sugar content of ready made foods should be checkedChildren andadolescents• Introducing healthy eating patterns in early childhood influences dietary patternsin later years, however reduced fat milk, yoghurt and cheese products are notrecommended for children under 2 years• Water and plain milk are recommended drinks – consumption of soft drink,‘sports drinks’, ‘vitamin waters’, cordials, fruit drinks and energy drinks shouldbe limited• Not drinking alcohol is especially important in children under 15 years of age,who are at the greatest risk of harm from drinking• <strong>For</strong> adolescents aged 15−17 years, the safest option is to delay drinking for aslong as possibleGuideline 3Older people• Older people with complex health issues or frail elderly people often have dietaryrequirements that are different to those of healthy, free-living older people wheremaintaining energy intake is a priority and discretionary foods may assist inpreventing malnutrition• Older people are more susceptible than others to the toxic effects of alcohol andfor some older adults, drinking alcohol increases the risk of falls and injuries• Older people are advised to consult their health professionals about the mostappropriate level of drinking for their healthWhere to next?The next chapter provides information on why breastfeeding is beneficial to the health of the infant and themother, and practical considerations for encouraging and supporting breastfeeding.Limit intake of foods containing saturated fat, added salt, added sugars and alcoholNational <strong>Health</strong> and Medical Research Council85
GUIDELINE 4Encourage, support and promote breastfeedingGuideline 4Encourage, support and promote breastfeeding.Summary• The World <strong>Health</strong> Organization states that ‘breastfeeding is an unequalled way ofproviding ideal food for the healthy growth and development of infants’. 871• Breast milk contains many unique compounds, including live cells, which provide allthe nutritional requirements to support growth and development of infants to around6 months of age.• Breastfeeding provides health benefits to infants including reduced risk of infection,asthma and atopic disease and sudden infant death syndrome. It contributes toimproved cognitive development and protects against obesity, hypertension and somechronic diseases in later life.• Benefits to mothers from breastfeeding include improved bonding with their infant,accelerated recovery from childbirth and progress towards a healthy body weight.Breastfeeding is also associated with reduced risk of some cancers.• Infants should be exclusively breastfed until around 6 months of age when solid foodsare introduced. Breastfeeding should be continued while solid foods are introduced until12 months of age and beyond, for as long as the mother and child desire.• Breastfeeding outcomes (including initiation rates and duration) are improved where themother has support and encouragement from the infant’s father, other family members,health workers, the hospital and the community.This chapter provides information on why breastfeeding is beneficial to the health ofthe infant and the mother, plus practical considerations for encouraging, supporting andpromoting breastfeeding.Guideline 4Encourage, support and promote breastfeedingNational <strong>Health</strong> and Medical Research Council87
4.1 Setting the sceneThe World <strong>Health</strong> Organization (WHO) states that ‘breastfeeding is an unequalled way of providing ideal foodfor the healthy growth and development of infants’. 871 Breastfeeding has short-term and long-term health andother benefits for infants and mothers. Maximising the benefits of breastfeeding to the infant and motherrequires the support of the other family members and a supportive community environment.Australia has a long history of promoting and supporting breastfeeding in its public health policy. In 1981Australia became a signatory to the WHO International code of marketing of breast-milk substitutes(WHO Code), 872 the main aim of which was to protect and promote breastfeeding. The importance ofbreastfeeding led to its inclusion in the first edition of the dietary guidelines endorsed by the NHMRCin 1982. 750In Australia, the WHO code is implemented through the Marketing in Australia of Infant <strong>For</strong>mulas (MAIF)Agreement, a voluntary agreement by infant formula manufacturers and importers. The Infant Feeding<strong>Guidelines</strong> 351 provide more information on the WHO Code, the MAIF Agreement and the obligations of allhealth workers. They also provide detailed information on the benefits of breastfeeding for the infant andmother, and recommendations on appropriate foods for infants from birth to about 2 years of age. OtherGovernment initiatives and policies are outlined in the Australian national breastfeeding strategy 2010–2015which aims to promote, protect, support and monitor breastfeeding. 873Breast milk is a living tissue that contains many unique compounds, including antibodies and immune cells.In the first few days after giving birth a mother’s breasts produce colostrum, which provides all the nutrientsand water required by her newborn infant. Colostrum contains higher levels of protein, vitamin A and vitamin B 12and less fat than breast milk. It also contains lactoferrin, immunoglobulin A, enzymes, maternal antibodies,living cells (leukocytes, neutrophils and macrophages) and prebiotics, which limit the growth of pathogenicbacteria and viruses, stimulate the growth of an appropriate human microbiome and protect against illness. 657,874,875Colostrum feeding is important for the infant and also stimulates the mother’s breast milk production. Skin-to-skincontact and colostrum feeding should begin as soon as possible after birth, preferably within 30 to 60 minutes.The composition of colostrum gradually changes as lactation is established and milk production begins48–72 hours after birth.The nutrient composition of mature human milk varies between individuals and across the stages of lactation.The energy content varies between 270 and 315 kilojoules per 100ml, largely due to variation in the fatcontent. 876,877 Fat content typically increases through each breastfeed. It provides energy and omega-3 andomega-6 LCPUFAs, plus the fat-soluble vitamins A, D, E and K, as well as prostaglandins. The fat in breast milkis typically better absorbed by an infant’s gastrointestinal tract than the fat in cow’s milk. Mature milk continuesto provide the infant with immune factors and enzymes. 35,878Guideline 4Breast milk provides all the vitamins, major minerals and trace elements known to be essential for healthyfull-term infants for around the first 6 months of life. 143,879 These nutrients are more bioavailable than thosefound in infant formula. Because the composition of breast milk constantly changes throughout lactation andduring a single breastfeed, no infant formula can exactly mimic the composition of breast milk. Breast milk isa convenient, hygienic and inexpensive food source with no environmental costs. 880Breast milk continues to be an important source of vitamins, minerals and trace elements when other foodsare introduced at around 6 months (complementary feeding).Consuming a variety of nutritious foods is particularly important for breastfeeding women.88EAT FOR HEALTH – australian dietary guidelinesNational <strong>Health</strong> and Medical Research Council
4.2 The evidence for ‘encourage, support and promote breastfeeding’There is considerable evidence to justify the recommendation to encourage, support and promote breastfeeding,including:• the many benefits of breastfeeding for both infants – in babyhood and later life – and mothers• the effectiveness of antenatal and postnatal support in increasing the duration of breastfeeding.Table 4.1: Evidence statements for ‘encouraging, supporting and promoting breastfeeding’Evidence statementCompared to infants who are formula fed, being breastfed is associated with reduced risk of becoming obese in childhood,adolescence, and early adulthood.Prenatal and perinatal support for breastfeeding can increase the proportion of women breastfeeding (both exclusive andnon-exclusive) up to age 6 months.Being breastfed in infancy is associated with lower systolic and diastolic blood pressure up to adolescence.Infants who are exclusively breastfed for 6 months experience less morbidity from gastrointestinal infection than thosewho are mixed breastfed as of 3 or 4 months.Infants, from either developing or developed countries, who are exclusively breastfed for 6 months or longer do not havedeficits in growth compared to those who are not exclusively breastfed.There are no apparent risks in a general recommendation for exclusive breastfeeding for the first 6 months of life, in bothdeveloping and developed countries. However, infants should still be managed individually in order to achieve sufficientgrowth and minimise adverse outcomes.Exclusive breastfeeding for 6 months or more prolongs lactational amenorrhea for mothers.Breastfeeding support (any type) increases duration of both exclusive and non-exclusive breastfeeding both in theimmediate postnatal period and at 6 months of age.Being breastfed initially, particularly exclusively breastfed, is associated with lower total and LDL cholesterolconcentrations in adult life.Breastfeeding is associated with a reduced risk of asthma and atopic disease.GradeAABBBBBBCCNot breastfeeding is associated with an increased risk of sudden infant death syndrome.Maternal perceived insufficient milk supply is associated with increased risk of early cessation of lactation.Notes: Grades – A: convincing association, B: probable association, C: suggestive associationIncludes evidence statements and gradings from the Evidence Report (literature from years 2002–2009). Does not include evidence fromother sources, such as the 2003 edition of the dietary guidelines (in which individual studies were classified according to their design aslevel I, II or III but overall grades for relationships were not derived), although these sources have been used to inform these <strong>Guidelines</strong>.Grade C evidence statements showing no association and all Grade D statements can be found in Appendix E.CCGuideline 4Encourage, support and promote breastfeedingNational <strong>Health</strong> and Medical Research Council89
4.2.1 Breastfeeding incidence and durationExclusive breastfeedingSystematic reviews from developed and developing countries provide evidence of a probable association thatexclusive breastfeeding for around 6 months of life 2 is the best method of feeding for full-term infants (Grade B;Evidence Report, Section 23.2). Breastfeeding can then continue while appropriate solid foods are introduced.The WHO and almost all national and international paediatric and public health organisations make similarrecommendations. The Infant Feeding <strong>Guidelines</strong> 351 recommend that exclusive breastfeeding be encouraged,supported and promoted to around 6 months of age. <strong>For</strong> further information about the evidence, refer to theliterature review for the Infant Feeding <strong>Guidelines</strong>. 881-884No apparent risks have been reported in recommending exclusive breastfeeding for around the first 6 monthsof life, in both developing and developed countries (Grade B; Evidence Report, Section 23.2). It is important,however, that health professionals manage all infants on an individual basis, no matter how they are fed, so thatany faltering growth or other adverse outcomes do not go unnoticed. 351Adding other foodsThe introduction of complementary feeding (adding solid foods and liquids other than breast milk or infant formula)at around 6 months is consistent with introduction of solid foods during the probable ‘window of tolerance’between 4 and 7 months. 885 The majority of Australian infants have solids introduced during this period. 886,887Early cessation of lactationRecent evidence suggests an association between maternal perceived insufficient milk supply and an increasedrisk of early cessation of lactation (Grade C; Evidence Report, Section 25.3). Despite this perception, there is littleevidence that there is an inability to produce adequate milk, except in rare circumstances related to maternalillness. The advice and support of family and health professionals can be very helpful.Supportive environmentsThere is convincing evidence that antenatal and perinatal support for breastfeeding can increase the proportion ofwomen breastfeeding (both exclusive and non-exclusive) up to age 6 months (Grade A; Evidence Report, Section 25.3).Recent evidence also suggests a probable association between breastfeeding support (any type) and anincreased duration of both exclusive and non-exclusive breastfeeding, both in the immediate postnatal periodand when the infant is 6 months of age (Grade B; Evidence Report, Section 25.3).Guideline 42 In Australia, ‘around 6 months’ for exclusive breastfeeding is used to acknowledge that different infants develop atdifferent rates.90EAT FOR HEALTH – australian dietary guidelinesNational <strong>Health</strong> and Medical Research Council
Table 4.2: Factors associated with duration of exclusive breastfeedingAssociation with longer durationof exclusive breastfeedingConsistently positiveConsistently negativeEffect varies in different culturesFactor• Higher level of maternal education• Support of midwives and community health professionals• Father’s preference for breastfeeding• Doctors’ support of breastfeeding• Pleasant birth experience (minimal complications)• Greater breastfeeding knowledge• Rural environment• Time decision to breastfeed is made (preferably before pregnancyor early in pregnancy)• Lower socioeconomic background• <strong>For</strong>mula supplementation in maternity ward• Mother’s intention to use supplementation• Previous breastfeeding experience short-term (
4.2.3 Cardiovascular disease and excess weight• Blood pressure: There is probable evidence that infants who are breastfed exclusively in the first few monthsof life have a lower adult systolic and diastolic blood pressure (approximately 1.5/0.5 mmHg) compared withthose who are formula-fed (Grade B; Evidence Report, Section 23.1).• Total and LDL cholesterol: Recent evidence suggests that being breastfed initially, and particularly exclusivelybreastfed, is associated with lower total and LDL concentrations in adult life when compared with beingformula-fed (Grade C; Evidence Report, Section 23.1).• Excess weight: There is convincing evidence that compared with being formula-fed, being breastfed is associatedwith reduced risk of infants becoming obese in childhood, adolescence and early adulthood (Grade A; EvidenceReport, Section 17.2). The protection offered by breastfeeding appears to increase with duration of breastfeedingand plateaus at 9 months. 900,901Evidence of an association between the age of introduction of solid foods and risk of overweight in childrenyounger than age 7 years is inconclusive (Evidence Report, Section 19.1).4.2.4 Other benefits• Sudden infant death syndrome (SIDS): There is evidence to suggest that breastfeeding reduces the riskof SIDS (Grade C; Evidence Report, Section 23.4).• Gastrointestinal infection: There is probable evidence that infants who are exclusively breastfed for6 months experience less morbidity from gastrointestinal infection than those who are mixed breastfed asof age 3–4 months (Grade B; Evidence Report, Section 23.2). Factors in breast milk such as secretory IgA,oligosaccharides and lactoferrin may protect the infant from various infections through passive immunity. 657• Asthma: Recent evidence suggests an association between breastfeeding and lower incidence of asthma(Grade C; Evidence Report, Section 23.3). Data from the Longitudinal Study of Australian Children suggest astrong and significant protective effect of breastfeeding on wheezing and asthma in infancy, which increaseswith increasing breastfeeding duration.• Atopic disease: Recent evidence also suggests an association between breastfeeding and protection againstatopic disease (Grade C; Evidence Report, Section 23.3).• Lactational amenorrhea: There is probable evidence that women who exclusively breastfeed for 6 monthsexperience more prolonged lactational amenorrhea, with a delay in the return of fertility (Grade B; EvidenceReport, Section 23.2), which may be a benefit for some women. Lactational amenorrhoea is a commonlyused form of contraception. 902-904• Allergy: The evidence for an association between a delay in introduction of solid foods until after the age of6 months and risk of developing allergic syndromes is inconclusive (Evidence Report, Section 19.2).Guideline 4• Other benefits for infants: Additional benefits for infants who are breastfed compared with those who areformula-fed, in both developed and developing countries, 874,905 may include:––protection against respiratory infection and reduced prevalence of asthma 906––reduced occurrence and recurrence of otitis media 905––protection against neonatal necrotising enterocolitits, bacteraemia-meningitis and urinary tractinfection 874,907––reduced risk of autoimmune diseases, such as type 1 diabetes 905––lower rates of coeliac disease, Crohn’s disease and ulcerative colitis 908––improved visual acuity, psychomotor development and cognitive development 880,909––reduced malocclusion as a result of better jaw shape and development 910––improved mother and infant bonding and attachment. 91192EAT FOR HEALTH – australian dietary guidelinesNational <strong>Health</strong> and Medical Research Council
• Other benefits for mothers: Additional maternal benefits may include:––promotion of maternal recovery from childbirth through accelerated uterine involution and reduced riskof haemorrhage (thus reducing maternal mortality) 912––accelerated weight loss and return to pre-pregnancy body weight 879,896––reduced risk of pre-menopausal breast cancer 905––reduced risk of ovarian cancer 905––improved bone mineralisation and thereby decreased risk of post-menopausal hip fracture. 913,9144.3 Practical considerations: encourage, support andpromote breastfeedingInformation relevant to infants and pregnant and breastfeeding women can be found in other chapters of these<strong>Guidelines</strong> under the ‘Practical considerations’ sub-headings. Further information can also be found in the InfantFeeding <strong>Guidelines</strong>. 3514.3.1 Breastfeeding initiation and durationIt is estimated that in Australia, 96% of mothers initiate breastfeeding and approximately 50% continue to offersome breast milk at 6 months. 887,915,916 Few infants are exclusively breastfed until 6 months. 33 However, reliablenational data on breastfeeding duration rates are difficult to obtain for several reasons, including inconsistentuse of definitions of breastfeeding and different methods in studies. 877,917Early interactionMothers should have skin-to-skin contact with their babies soon after birth and for as long as they wish, wherepossible. 888 Most mothers remain close to their infants and ‘rooming-in’ 24 hours a day is the usual practicein most Australian hospitals to facilitate frequent mother and child contact. 918 Additional infant feeds are rarelyneeded and may interfere with establishment of breastfeeding.Young mothersBreastfeeding initiation and duration rates are below recommended levels among adolescent mothers. 33 Specificbreastfeeding education programs in the US, United Kingdom (UK) and Australia have been somewhat effective inincreasing breastfeeding initiation in adolescent mothers. 919,920 Adolescent mothers identify emotional and networksupport as well as self-esteem as being crucial to breastfeeding success. 919Women and paid workThe workplace and parental leave environment has an important impact on breastfeeding rates. The relationshipbetween returning to work and breastfeeding for mothers in Australia is complex, with other interplaying factors,such as maternal and family characteristics, having an impact on the decision to breastfeed. 873 There is probableevidence that intention to work or return to paid employment is negatively associated with both the initiationand duration of breastfeeding. 921,922 Women who are not employed full-time, 922 are self-employed or have flexibleworking hours are more likely to breastfeed for 6 months. Using only parental childcare has a positive associationwith continuation of breastfeeding. 921 Where mothers are separated from their infants, they may continuebreastfeeding whenever they are together. Continuation of any breastfeeding is of benefit to mother and infant.Guideline 4Encourage, support and promote breastfeedingNational <strong>Health</strong> and Medical Research Council93
Lower socioeconomic status mothersWomen from the lowest socioeconomic quintile in Australia have lower breastfeeding rates than those from themost affluent quintile. 873,923-925Mothers from culturally and linguistically diverse groupsLimited available data suggest that, in general, the rates of breastfeeding among women from culturally andlinguistically diverse groups in Australia reflect trends in their countries of origin. 926-930Aboriginal and Torres Strait Islander mothersBreastfeeding status varies by remoteness. In non-remote areas, non-Indigenous infants are likely to breastfeedfor longer than Aboriginal and Torres Strait Islander infants. However, in remote areas Aboriginal and Torres StraitIslander infants breastfeed for longer than non-Indigenous infants. 28,873 In the Perth Aboriginal Breastfeeding Study,Aboriginal mothers had higher breastfeeding rates than non-Aboriginal mothers. 931Mothers who use illicit drugsWHO recommends that mothers who use illicit drugs while breastfeeding should be evaluated on an individualbasis. Breastfeeding may need to be discontinued, 932 but each case requires detailed medical assessment. 9224.3.2 Supporting and promoting breastfeedingPromoting breastfeeding in prospective parentsOverall, reviews of interventions to support breastfeeding have found that education before birth and continuingsupport after birth for breastfeeding mothers were effective in breastfeeding continuation.The US Preventive Services Task <strong>For</strong>ce found that primary care breastfeeding interventions significantly increasedrates of exclusive breastfeeding in the short and long term. 889Effective education programs include information about the benefits of breastfeeding, principles of lactation, myths,common problems and solutions, and skills training. 933 Peer support was particularly useful for socioeconomicallydisadvantaged women, and peer counsellors were most effective if they were of similar cultural and social statusto the women they were counselling. The optimal mix of interventions to improve breastfeeding practices includeseducation of mothers, peer support, hospital practices such as rooming-in and early skin-to-skin contact, staff training,development and implementation of hospital policies, media campaigns, and paid maternity leave. 890A more recent Cochrane review shows a protective effect of providing support on increasing duration ofbreastfeeding. 888Guideline 4Promoting breastfeeding in hospitalsThe UNICEF and WHO Baby Friendly Hospital Initiative (BFHI) has been shown to increase breastfeeding rates inaccredited hospitals. 934 The steps in BFHI include the following:1. Have a written breastfeeding policy that is routinely communicated to all health care staff.2. Train all health care staff in skills necessary to implement this policy.3. Inform all pregnant women about the benefits and management of breastfeeding.4. Help mothers initiate breastfeeding within one hour of birth.5. Show mothers how to breastfeed and how to maintain lactation even if they should be separated fromtheir infants.6. Give newborn infants no food or drink other than breast milk, unless medically indicated.7. Practice rooming-in (allow mothers and infants to remain together) 24 hours a day.8. Encourage breastfeeding on demand.9. Give no artificial teats or pacifiers (also called dummies or soothers) to breastfeeding infants.10. Foster the establishment of breastfeeding support and refer mothers to them on discharge from thehospital or clinic.94EAT FOR HEALTH – australian dietary guidelinesNational <strong>Health</strong> and Medical Research Council
Note: In the Australian version of the BFHI step 4 is phrased: ‘Place babies in skin-to-skin contact with theirmothers immediately following birth for at least an hour and encourage mothers to recognise when their babiesare ready to breastfeed, offering help if needed’. These <strong>Guidelines</strong> refer to the original BFHI, as this version hasbeen extensively evaluated. 897,935-937Early contact improves breastfeeding outcomes. 33 Interventions aimed at either delaying or speeding up thelength of the first feed should be avoided. Hospital practices at the time of birth can be the first line of support fora new mother. Difficulties encountered can be quickly resolved by staff with appropriate experience, and hospitalscan encourage rooming-in to facilitate frequent mother and child contact. 918 The use of prelacteal feeds or otherliquids while in hospital interferes with the establishment of lactation and is contrary to BFHI principles.Community supportSuccessfully managing breastfeeding problems in the first weeks after birth has a major impact on breastfeedingduration. 938 Sources of support for mothers in the first few weeks include family members, community healthnurses, voluntary organisations and GPs. Preparation and education before birth are very important in achievingsuccessful breastfeeding. Efforts to improve community acceptance of breastfeeding are also critical.The legislative environment plays an important role in reducing discrimination against breastfeeding mothers. It islegal to breastfeed in public in every state and territory of Australia. Most jurisdictions also have specific legislationmaking it unlawful to discriminate against breastfeeding mothers. 8734.3.3 Expressing breast milkMany mothers find it convenient to express breast milk so that others can feed their baby if required. Appropriatehygiene is essential for the expression and storage of breast milk. <strong>For</strong> details of methods of expression and thesafe storage of breast milk see the Infant Feeding <strong>Guidelines</strong>. 351The use of a breast pump to express and measure breast milk production is not recommended as a way to assessthe adequacy of breastfeeding, because expression from the breast may not be as effective as an infant suckling.Serial measurements of infant growth are the best way to assess nutritional adequacy.4.3.4 Alcohol and breastfeedingAlcohol is best avoided during breastfeeding. <strong>For</strong> more details, see Section 3.4 and the Infant Feeding<strong>Guidelines</strong>. 3514.3.5 When an infant is not receiving breast milkWhen an infant is not breastfed or is partially breastfed, commercial infant formulas should be used as analternative to breast milk until 12 months of age. All formulas available in Australia are regulated by the AustraliaNew Zealand Food Standards Code and contain adequate nutrients for infants. A mother’s decision not tobreastfeed should be respected and support should be provided where needed. Cow’s milk should not be givento infants under 12 months of age as a main drink. Complete details on the use of infant formula and theintroduction of solid foods are provided in the Infant Feeding <strong>Guidelines</strong>. 351Guideline 4Encourage, support and promote breastfeedingNational <strong>Health</strong> and Medical Research Council95
4.4 Practice guide for Guideline 4Table 4.3: Considerations in encouraging, supporting and promoting breastfeedingStrategyConsiderationsIncreased duration ofbreastfeeding• Encourage exclusive breastfeeding until around 6 months of age when solidfoods are introduced• Encourage the continuation of breastfeeding while solid foods are introduceduntil 12 months of age and beyond, for as long as the mother and child desireAntenatal education• Information should include the benefits of breastfeeding and the risks of notbreastfeeding to mothers, fathers and primary carers, as well as principlesof lactation, myths, common problems and their solutionsHospital support ofbreastfeeding• Promote the principles of the Baby Friendly Hospital Initiative including:––Measures to encourage initiation of breastfeeding include earlyskin-to-skin contact, rooming-in and breastfeeding on demand––Staff should be trained in skills to support initiation of breastfeedingand resolution of any early problems––Discourage interventions that interfere with establishing lactatione.g. the use of artificial teats or pacifiersCommunity support ofbreastfeeding• Seek to address breastfeeding problems in the first few weeks. Encouragemothers to seek support from community health nurses, voluntaryorganisations (such as Australian Breastfeeding Association helpline) and GPs• Community acceptance and support of breastfeeding should be encouragedWhere to next?Everyone should prepare and store food safely; however particular care should be taken when handling foodintended for consumption by those at increased risk of foodborne illness, such as pregnant women, infants,older people and people with certain medical conditions. The next chapter discusses how incorrect handlingor storage of food can contribute to food poisoning and poor health outcomes.Guideline 496EAT FOR HEALTH – australian dietary guidelinesNational <strong>Health</strong> and Medical Research Council
GUIDELINE 5Food safetyGuideline 5• Care for your food; prepare and store it safely.Summary• More than five million cases of foodborne illness are estimated to occur every yearin Australia.• Bacterial and viral food poisoning is a result of pathogenic organisms reaching harmfullevels or the production of pathogenic toxins.• Incorrect handling of food and storing food at inappropriate temperatures are majorcauses of food poisoning. Particular care should be taken when handling food to beconsumed by people who have an increased risk of foodborne illness, such as pregnantwomen, infants, older people and people with certain medical conditions.This chapter provides information on preventing foodborne illness and why it is importantto store and prepare food safely.Guideline 5Food safetyNational <strong>Health</strong> and Medical Research Council97
5.1 Setting the sceneFoodborne illness is caused by contaminated foods. Contaminants include pathogens, environmentalcontaminants and adulterants. 939 These <strong>Guidelines</strong> focus on bacterial and viral contaminants.Food poisoning generally occurs when pathogenic micro-organisms multiply to harmful levels as a result ofincorrect handling of food, particularly when temperature control is inadequate. Some foodborne pathogenscan cause illness even when present in low numbers (e.g. hepatitis A virus, norovirus, some strains of E. coli,Campylobacter jejuni and Shigella spp.). Other pathogens produce toxins when allowed to multiply to high levelsin food (e.g. Clostridium botulinum, Staphylococcus aureus, Bacillus cereus and Shigella spp). 940Prevention of contamination is the key to avoiding foodborne illness. Once pathogens contaminate food they canmultiply and/or produce toxins if not handled correctly. 941 Heat can kill many bacteria and viruses and is the basisfor many food safety strategies. However, even reheating food to high temperatures will not destroy all toxins.The increasing age of many populations, migration, mass production of food due to population growth andchanged food habits are threats to food safety. 942 Lack of access to quality food, as well as lack of refrigerationand suitable storage, pose threats to vulnerable groups. Isolated and poorer communities can be at higher riskas a result of inadequate storage facilities or limited access to regular food supplies.Dramatic scientific and technological improvements in detecting pathogens have contributed to the identificationof increasing numbers of cases of foodborne disease. Foodborne illness appears to be increasing in incidencein Australia and worldwide, and is a significant public health problem. 943,944 In 2000, the Australian GovernmentDepartment of <strong>Health</strong> and Ageing established OzFoodNet, an enhanced foodborne disease surveillance systemdesigned to improve national surveillance of gastrointestinal and foodborne illness. 945 The most recent estimatesindicate there are 5.4 million cases of foodborne illness in Australia every year, leading to 1.2 million visitsto medical practitioners and 2.1 million days of work lost. 946 Multiple episodes increase the risk of long-termconsequences such as reactive arthritis, irritable bowel syndrome and, rarely, Guillain-Barre Syndrome. 9455.2 The evidence for ‘care for your food; prepare and store it safely’The true incidence of foodborne illness is consistently underestimated because cases are under-reported,most cases are sporadic and full diagnostic testing is usually only done in more severe cases or when thereare extensive common-source outbreaks. 947-949 The majority of reported episodes are caused by foods preparedoutside the home, regardless of where they are consumed. Foods prepared in the home account for 20–40%of foodborne illness in Australia. 948 Fresh fruit and vegetables can also be contaminated, depending on soils andfarming practices. The main causes of foodborne illness in Australia are:• inadequate cooking 947,950• improper holding temperatures 947,950• contaminated equipment (such as knives, cutting boards and dishcloths) 950• contaminated food storage and preparation areas• unsafe raw food 950• allowing raw foods to make direct contact with ready-to-eat foods 947• poor personal hygiene of food handlers (such as not washing hands adequately, particularly after handlingraw food or immediately after using the toilet). 9505.2.1 Foods that may cause problems if not handled correctlyGuideline 5The following are examples of foods that are normally considered higher risk because pathogenic bacteria canbe present and grow if not stored and prepared safely: 951• raw and cooked meat or foods containing raw or cooked meat• dairy products and foods containing dairy products• seafood and foods containing seafood• cooked rice and pasta98EAT FOR HEALTH – australian dietary guidelinesNational <strong>Health</strong> and Medical Research Council
• processed fruit and vegetables such as salads• processed foods containing eggs or other protein-rich food• foods that contain any of the foods above (e.g. sandwiches).The foods most commonly implicated in outbreaks of foodborne illness in Australia are meat, seafood and eggs. 945,947Contamination of any ready-to-eat food with a pathogen such as a virus or enterohaemorrhagic strain of E. coli canresult in foodborne illness.5.3 Why it is important to prepare and store food safelyFoodborne illness results from consuming contaminated food or drink. Correct handling of food during all stagesof its preparation and storage is essential in reducing the risk of contamination and foodborne illness.The ability of bacteria to grow in a food depends on external factors (such as temperature) as well ascharacteristics of the food itself, such as protein content, 952,953 water content and pH. <strong>For</strong> example, bacteria areleast active in very acidic foods (pH less than 4.5).Most bacteria can multiply at temperatures between 5°C and 60°C but a few pathogenic bacteria multiply attemperatures at or below 5ºC. 951 Exposure to high temperatures destroys the vegetative cells of most bacteria,although some have heat-resistant spores or produce histamines and toxins that survive the cooking process. 951Some bacteria multiply within 2 hours and can reach an infective dose in 4–6 hours. 952-954 Refrigeration at or below5°C slows the growth of bacteria and the rate of chemical change in food. 951The method chosen for thawing food should minimise the time the food is at room temperature, where microorganismscan multiply. Ready-to-eat frozen foods should be thawed in the refrigerator or under cold water in anairtight plastic wrapper or bag, with the water changed every 30 minutes. 955Many foods should be cooked to at least 75°C. A thermometer should be used to check food is properly cooked toa minimum safe temperature (roasts and meats 62°C; mince, eggs, soups 71°C; whole poultry 82°C). 956,957Not all meats need to be cooked thoroughly: steaks, whole fillet, chops and whole pieces of roast meat can beeaten rare. In contrast, rolled and/or stuffed meats, poultry, pork, sausages and mince should always be cooked allthe way through, until the juices run clear when the meat is pierced. 952Cooking does not guarantee safety because some bacterial spores can survive several hours of cooking and stillgrow later in the food if there is poor temperature control. Foods such as stews and other meat and poultry dishesthat will be eaten later should be cooled as quickly as possible to prevent spores from germinating and bacteriafrom multiplying. Foods that have just been cooked and are still very hot can be cooled at room temperature untilthe temperature of the food drops to 60°C. The food should then be cooled to 5°C as quickly as possible. 952,9585.4 Practical considerations: care for your food; prepare andstore it safelyThe use of date marking provides a guide on the shelf life of a food item in terms of quality and safety. The term‘best before’ indicates the length of time a food should keep before it begins to deteriorate while ‘use by’ indicateshow long a food can be expected to remain safe provided it has been stored according to any stated storageconditions and the package is unopened. 9415.4.1 Pregnant and breastfeeding womenAs the immune system in pregnancy is suppressed, pregnant women are more susceptible to foodborne illness.Pregnant women have a higher risk of listeriosis, caused by the bacterium Listeria monocytogenes. Listeriosiscan be transmitted to the unborn child and possibly cause a miscarriage, premature birth or stillbirth. 959 As aprecaution, pregnant women are advised to avoid specific foods that are more likely to contain Listeria bacteria(for further information see Sections 2.4.4 and 2.5.4 and the FSANZ website 349 ). Pregnant women are also advisedto be careful with foods more likely to contain mercury (such as fish). 567Guideline 5Food safetyNational <strong>Health</strong> and Medical Research Council99
5.4.2 InfantsThe immune system of infants is not fully developed, making them more susceptible to foodborne illness.Particular care should therefore be taken when preparing infant formula (if this is being used), including thesterilisation of bottles and other equipment used to prepare formula. 950 Further information is included in theInfant Feeding <strong>Guidelines</strong>. 351 Pacifiers (dummies) should also be sterilised. Prepared foods should not bereheated more than once, and any foods served but not eaten should be discarded.5.4.3 Adults with illnessAdults with conditions that reduce immune function such as human immunodeficiency virus (HIV)/acquiredimmunodeficiency syndrome (AIDS), cancer, type 1 or type 2 diabetes, kidney or liver disease, haemochromatosis,stomach problems (including previous stomach surgery) and low stomach acid (e.g. from antacid use) are moresusceptible to foodborne illness. Also at risk are people taking immunosuppressants, undergoing bone marrowor stem cell transplantation, or who have a history of long-term steroid use. Prepared foods should be handledwith care.5.4.4 Older peopleOlder adults, especially those who are frail, are at higher risk of foodborne illness than other adults due to theirweakened immune systems, decreased intestinal motility, decreased acid in the stomach, loss of sense of smelland taste, and increased risk of dementia and malnutrition. 956,957 High-risk foods should be cooked, dairy productsshould be pasteurised, and specific foods at risk of Listeria contamination avoided. Information on Listeria bacteriais available from FSANZ. 349People of any age, but especially older people receiving pre-prepared meals, need to ensure that they are safelystored if not consumed immediately.5.5 Practice guide for Guideline 5Table 5.1: Considerations in providing advice on food safety to people from specific groupsPopulation groupConsiderationsPregnant and breastfeeding womenInfants• Foods associated with a risk of Listeria bacteria should be avoided• Care should be taken with foods more likely to contain mercury(e.g certain types of fish)• If formula-fed, care should be taken when preparing formula,including sterilising bottles and other equipment• Pacifiers (dummies) should be sterilised• Foods should not be reheated more than once, and any foodsserved but not consumed should be discardedAdults with illness • Impaired immune function increases the risk of foodborne illness –prepared foods should be handled with particular careGuideline 5Older people• High-risk foods should be cooked, dairy products pasteurised, andspecific foods associated with a risk of Listeria bacteria avoided• Pre-prepared meals should be safely stored if not consumedimmediately100EAT FOR HEALTH – australian dietary guidelinesNational <strong>Health</strong> and Medical Research Council
AppendicesAppendix AEquity and the social determinants of health andnutrition statusThe World Declaration on Nutrition (1992) states that ‘access to nutritionally adequate and safe food is a basicindividual right’. 960 Australia is fortunate to have an abundant and safe food supply. Life expectancy and healthstatus are relatively high. 11,24,45 Australians are generally literate and have good access to health and nutritioninformation and sufficient education to make informed food choices. 961However, there are differences in health and wellbeing between groups of Australians. People in lowersocioeconomic groups have shorter life spans and poorer health. They have higher rates of death and disease,are more likely to be hospitalised and are less likely to use specialist and preventive health services. 962 As inother countries, there is a socioeconomic gradient whereby health status generally improves the higher aperson is up the socioeconomic ladder. 24The determinants of health inequities are largely outside the health system and reflect the distribution of social,economic and cultural resources and opportunities. 25,26,960,962 Employment, income, education, cultural influences,lifestyle, language, sex and other genetic differences, geographic, social or cultural isolation, age and disability,the security and standard of accommodation, and the availability of facilities and services, all influence diet,health and nutritional status. 25,26The relationship between these factors and health status is complex and it is often difficult to determine thenature and direction of causal relationships. 25,26 <strong>For</strong> example, those on higher incomes tend to have greateropportunity to attain higher levels of education and afford housing in higher socioeconomic areas with betteraccess to goods and services (e.g. health services, transport, shops including food outlets) that supporthealthy lifestyles. Lower levels of education and/or an individual’s poor health status can limit opportunities foremployment and therefore income and access to other goods and services, including nutritious food. 25,26While higher education can improve health literacy, just because a person can understand healthy lifestyle andnutrition information does not mean they can or will act on it. <strong>For</strong> example, one Australian study of people16 years and older found that, although 80% and 35% of people knew the recommended daily intake of fruitand vegetables respectively, only 56% and under 10% met these respective recommendations. 24The economic, social and cultural factors that influence health inequities also influence the ability of an individualto choose nutritious foods consistent with dietary guidelines. 33 The ability of parents and carers to make nutritiousfood choices is likely to affect their family’s nutrition status too.Factors associated with complying with dietary guidelines include being female, older age, higher socioeconomicstatus, with higher education and having nutrition knowledge. 44,314,316,963-979Conversely, lower socioeconomic status and lower educational attainment are barriers to complying with dietaryguidelines, and lower socioeconomic groups perceive cost as a barrier to healthy food purchase. 44,314,316,963-979In a Melbourne study it was found that areas of greater socioeconomic advantage had closer access tosupermarkets, whereas areas of less socioeconomic advantage had closer access to fast food outlets. 355A greater understanding of the barriers to consuming a nutritious diet will help ensure that appropriate messages,education and public health strategies are developed for groups who experience a greater burden of diet-relateddisease. It was essential that the social determinants of health and nutrition status were considered in the<strong>Guidelines</strong> to reduce the risk of adding to health inequities, for example by promoting consumption of expensiveor hard to access foods.AppendicesNational <strong>Health</strong> and Medical Research Council101
A1Social distribution of diet-related health outcomesIn 2002–06 the death rate for people between 15 and 64 years was 70% higher in the lowest socioeconomicgroup than the highest socioeconomic group. 24 These rates reflect the higher prevalence of type 2 diabetes andcardiovascular disease among people living in the lowest socioeconomic group. 11,24Gradients in risk factor prevalence are also apparent across quintiles of social disadvantage as defined bysocioeconomic indexes for areas (SEIFA). The SEIFA assesses the relative social disadvantage of respondents bythe economic resources, education and occupation patterns of their area of residence. 24 Overweight and obesityrates are also highest among the lower socioeconomic areas, although there was not a clear gradation acrossSEIFA quintiles. 24 Some of the factors that contribute to the development of overweight are also related to equity,particularly the social, cultural and economic barriers and enablers to healthy food choices (see Chapter 1). There isalso a social gradient in physical activity levels; self-reported ‘sedentary’ behaviour rises from 25% of people inthe highest socioeconomic areas to 44% in the lowest socioeconomic areas. 24A2Social distribution of food intake and nutrition statusSocioeconomic factors have a large impact on food and nutrient intakes and food purchasing decisions andpatterns, 314 and there is clear evidence of a social gradient for the distribution of diet-related chronic disease.Yet evidence for a social gradient related to specific foods – rather than overall dietary patterns – is less clear.Two recent systematic reviews assessed the impact of dietary interventions relative to social disadvantage 980and determinants of healthy eating for those with low income. 981 They found that economic and cultural influencesaffect consumption of specific foods or food groups. Nutrition interventions can have greater impact in highersocioeconomic areas and non-ethnic groups. 980,981Those with the least disposable income are at the greatest risk of poor nutrition as households vulnerable topoverty spend less per person on food but a greater proportion of their total expenditure on food. 982 Analysis ofAustralian household food expenditure data suggests that a substantial proportion of the population is severelyrestricted in its capacity to make nutritious food choices and to achieve a healthy diet. 983Economics of food choiceThere is a growing body of research indicating that food groups with more favourable nutrient profiles are moreexpensive. The ‘economics of food choice’ theory states that people’s dietary decisions, when made withinthe context of sustained budgetary constraints, are driven by maximising energy value for money (dollars permegajoule [$/MJ]), resulting in energy-dense, nutrient-poor diets. 142,264 <strong>For</strong> example, meat, fruit and vegetablesfood groups have the highest nutritional quality however are usually associated with highest costs, while sweetsand salted snacks have the lowest nutritional quality but are an inexpensive source of dietary energy. 142,264,315,984Although high-quality nutrition is known to protect against chronic diseases, energy-dense, nutrient-poor foodscost considerably less than nutrient-rich foods. 140The costs of healthy (low energy density, high nutrient density) foods are reported to be increasing in Australiain comparison with higher energy density, lower nutrient density food. Between 2000 and 2006 the ConsumerPrice Index for food in Brisbane increased by 32.5% while the cost of a standard basket of healthy food increasedapproximately 50% across Queensland. 317A diet consistent with the <strong>Guidelines</strong> is expensive for welfare-dependent families. An Australian study found itcost around 40% of their disposable income compared with 20% for families on the average income. 316Food securityFood security refers to the ability to access safe nutritious, affordable foods and the capacity to obtain them. At anindividual or family level, food insecurity can be characterised by running out of food and being unable to afford tobuy more. About 5% of the Australian population suffer food insecurity in a year. 985-987 It is more common among:• people who are unemployed 987• Aboriginal and Torres Strait Islander peoples 988• people living in single parent households 987• people in the second lowest income quintile 987102EAT FOR HEALTH – australian dietary guidelinesNational <strong>Health</strong> and Medical Research Council
• people living in rental households 987• younger people than older people 987• women than men (in some surveys but not others). 985,986Issues of food security in the face of rising food costs are of concern in Australia. 317 <strong>For</strong> example, nationalConsumer Price Index data for the March 2011 quarter indicates that the cost of food had increased by 2.9% andthat, primarily due to effects of flooding in Queensland and Victoria and Cyclone Yasi in Queensland, the costof fruit increased by 14.5% and the cost of vegetables increased by 16.2%. 989There is an urgent need to nationally monitor and sustainably address the factors affecting the price of nutritiousfoods, particularly for vulnerable groups who suffer a disproportionate burden of poor health. 317Social distribution of intake of foods and nutrientsThe 1995 National Nutrition Survey 36 showed few systematic differences in food and nutrient intake acrossquintiles of social disadvantage, as defined by SEIFA based on the 1991 census. Table A1 shows the intake ofvarious food groups across SEIFA quintiles from the Survey.Table A1: Mean daily intakes (g/day) of various food groups, people aged 19 years and over, by SEIFA quintileGrams per dayFood groupFirst quintile(most disadvantaged)SecondquintileThirdquintileFourthquintileFifth quintile(least disadvantaged)Cereal and cereal products 196 222 203 217 232Cereal-based products and dishes 113 115 130 135 136Fruit products and dishes 126 147 141 143 156Vegetable products and dishes 264 258 260 262 251Legumes and pulses 9.8 7.9 10.8 9.5 10.7Milk products and dishes 281 284 285 292 301Meat, poultry, game 149 163 164 155 158Fish and seafood 22 24.5 26.3 25.8 28.8Egg products and dishes 16 15 16 13 19Snack foods 3.2 3.0 4.2 3.3 3.9Sugar products and dishes 20 21 20 18 17Confectionery 7.8 9.2 8.3 9.3 9.1Seeds and nuts 3.6 4.1 5.2 4.0 4.8Fats and oils 12 13 13 12 11Soup 53 62 55 48 57Savoury sauces and condiments 30 30 28 30 29Non-alcoholic beverages 2001 2005 1978 2007 1938Alcoholic beverages 239 254 273 270 234The key findings were as follows: 990• Consumption of fruit and fruit products was lower (10–20%) in the most disadvantaged group compared withthe other four groups, but vegetable and legume consumption showed no consistent trend across the groups.This may be difficult to interpret as potato chips were included within this category.AppendicesNational <strong>Health</strong> and Medical Research Council103
• Consumption of milk and milk products increased slightly with social advantage – about a 10% increase acrossthe groups.• Consumption of meat, poultry and game was slightly higher in the middle quintiles.• Fish and seafood consumption increased with social advantage – this was thought to be due to better accessto seafood in coastal areas where cities are located, and the higher price of seafood products compared toother foods 36 ).• Consumption of sugar products and dishes tended to decrease with social advantage.• Consumption of cereals and cereal-based foods (e.g. rice, pasta and breads) was lower in the mostdisadvantaged group and the middle group compared with all other groups. Consumption of cereal-basedproducts and dishes (e.g. cakes and biscuits) was about 20% lower in the two most disadvantaged groupscompared with the other three.In other more recent studies, higher occupation level is associated with consumption of cheese and skim milk andhigher education level is associated with consumption of cheese. There is also a significant positive relationshipbetween skim milk consumption and occupation level based on four individual studies. 991NutrientsAn assessment of energy and nutrient intakes across the SEIFA quintiles showed that energy intake increasedwith social advantage, as did intakes of most nutrients. 990 However, when correcting for energy differencesacross groups, few differences were apparent in dietary quality, defined as nutrient intake per unit energy.Social advantage as indicated by SEIFA was positively associated with higher nutrient densities for iron, zinc,magnesium and potassium and with intake of intrinsic sugars but inversely associated with energy from fat. 36It is unclear from the published data whether other factors, such as the age profile, differed across the quintilesof disadvantage and how much variation in factors such as age (which are known to influence total food intake)might account for the differences that were apparent (e.g. in total energy intake). Physical activity may also varyacross quintiles.Neither is it clear whether these relatively small differences in nutrient profiles could explain a significantproportion of the variation in the health profiles across the groups. In interpreting the data set, however, it shouldbe borne in mind that a relatively crude, area-based measure of social disadvantage was used. It is also possiblethat many of the most disadvantaged individuals in the community did not take part in the survey.Table A2: Mean daily intakes of energy and nutrient densities, adults aged 19 years and over, by SEIFA quintileFood groupFirst quintile(mostdisadvantaged)SecondquintileThirdquintileFourthquintileFifth quintile(leastdisadvantaged)Energy (MJ) 8.82 9.18 9.37 9.31 9.45Nutrient density (per 10 MJ energy)Protein (g) 98.2 98.4 98.5 98.6 99.4Fat (g) 89.8 90.7 91.1 88.9 88.8Saturated (g) 35.7 35.5 36.0 35.2 35.0Monounsaturated (g) 32.5 32.8 33.4 32.4 32.3Polyunsaturated (g) 13.5 13.5 13.9 13.4 13.4Cholesterol (mg) 332 331 332 319 305Total carbohydrate (g) 276 277 272 276 277Sugars (g) 128 125 123 124 123Starch (g) 147 150 148 151 152Fibre (g) 24.4 24.4 24.9 25.2 25.6104EAT FOR HEALTH – australian dietary guidelinesNational <strong>Health</strong> and Medical Research Council
Food groupFirst quintile(mostdisadvantaged)SecondquintileThirdquintileFourthquintileFifth quintile(leastdisadvantaged)Alcohol (g) 13.4 13.3 14.3 14.6 13.8Vitamin A (µg) 1280 1299 1236 1218 1329Thiamin (mg) 1.81 1.74 1.81 1.83 1.80Riboflavin (mg) 2.27 2.18 2.24 2.25 2.22Niacin (mg) 45.8 45.9 45.6 45.5 45.9Folate (μg) 289 286 299 272 292Vitamin C (mg) 132 131 130 135 142Calcium (mg) 907 888 900 926 945Phosphorus (mg) 1626 1631 1630 1654 1673Magnesium (mg) 353 356 354 361 366Iron (mg) 15.1 15.0 15.3 15.4 15.6Zinc (mg) 12.9 13.07 12.8 13.0 13.3Potassium (mg) 3541 3495 3507 3528 3551Because inadequate nutritional status is part of the ‘vicious cycle’ of malnutrition and infection, higher prevalenceof undernutrition in lower socioeconomic groups further contributes to the incidence, severity and case fatality ofchildhood illnesses 884 and incidence of chronic disease in later life.A3Aboriginal and Torres Strait Islander peoplesDiet-related health outcomesAboriginal and Torres Strait Islander people in Australia suffer significant health inequities compared with thebroader community. Aboriginal and Torres Strait Islander people typically die at much younger ages and are morelikely to experience ill health, disability and reduced quality of life. 988 Poor nutrition is a major risk factor for many ofthe diseases with higher prevalence among Aboriginal and Torres Strait Islander groups and it has been estimatedthat 19% of the national Indigenous burden of disease is attributable to poor diet. 992Socioeconomic disadvantage underlies many of these health statistics. 993 Compared with non-IndigenousAustralians, Aboriginal and Torres Strait Islander peoples report lower incomes, higher rates of unemployment,lower educational attainment, more overcrowded and inadequate housing, 994 higher rates of incarceration andlimited access to transport. 24 Disrupted family and community cohesion, social marginalisation, stress, lack ofcontrol over circumstances, and discrimination and racism are also apparent. 28,993Overweight and obesity are common. 28,311 Measured anthropometric data for Aboriginal and Torres Strait Islanderpeoples are unavailable, however less reliable self-reported data indicated that more than half of Aboriginal andTorres Strait Islander people aged 15 years and over were overweight or obese. 995Undernutrition among young children and relatively poor growth from around 6 months of age persists in someparts of Australia. 996-999Foetal alcohol syndrome is also still present in some Aboriginal and Torres Strait Islander communities. 863,864Vitamin and mineral status has been measured infrequently in Aboriginal and Torres Strait Islander populations. 28Multiple deficiencies have frequently been described in the same subject, suggesting the generally poor nutritionalstatus of such individuals, rather than a specific micronutrient problem. In particular, vitamin status (in relationto folate, ascorbic acid and beta-carotene) consistent with low intakes of fruit and vegetables has often beendescribed. 7,352 More recently iodine deficiency in an Aboriginal birth cohort in the Northern Territory 1000 and lowvitamin D status in a South Australian Aboriginal population 1001 have been found.AppendicesNational <strong>Health</strong> and Medical Research Council105
Food intake, diet and nutritional statusThe available evidence suggests that, traditionally, Aboriginal and Torres Strait Islander peoples were fit andhealthy. The traditional diet appears to have been low in energy density but high in nutrient density – high inprotein, low in sugars, high in complex carbohydrate, and high in micronutrients. Energy expenditure appearsto have been high. 28,1002-1006With the transition from a traditional hunter-gatherer lifestyle to a settled Westernised existence, the diet ofAboriginal and Torres Strait Islander people has generally changed to an energy-dense diet that is high in fat andadded sugars. 311,1005,1006 The diet is also poor in fibre and certain nutrients including folate, retinol, vitamin E andother vitamins. 352In 2004–2005, 24% of Aboriginal and Torres Strait Islander people aged 15 years and over reported they ran outof food in the last 12 months, compared to 5% of non-Indigenous Australians. 988 While Aboriginal and Torres StraitIslander people living in remote areas were more likely to report having run out of food in the last 12 months(36%), this figure was also high for those in non-remote areas (20%) and ranged from 18% in New South Walesto 45% in the Northern Territory. 988 Women are at extra risk, partly because there is a cultural predispositionfor women to feed men and children before themselves. 961 Psychological suffering due to food insecurity canexacerbate feelings of exclusion, social disruption to family life and in some cases, anxiety about possible lossof custody of children. 1007There is very little recent dietary and nutrition data available for Aboriginal and Torres Strait Islander communities.Self-reported intakes of fruit and vegetables described in the 2004–05 NATSIHS are much higher than would beexpected from more reliable, objective data. 7,352,353,440Aboriginal people living in remote communities<strong>Dietary</strong> intakes in remote Aboriginal communities have been consistently measured to be high in refinedcarbohydrates and low in fresh fruit and vegetables. 352,353,440 Foods with high energy density were associatedwith lower costs, contributing disproportionately to energy availability and limiting the capacity of people livingin these communities to attain a healthy diet. 353,1008 Food supply is an ongoing issue 1008 with people in rural andremote areas paying at least 30% more for basic nutritious foods than people living in urban and metropolitanareas. 317,1009-1014 Basic food items are less available in the more remote stores, as are fresh vegetables and fruitsand better nutritional choices. 317 The quality of dietary intake has been shown to vary in close association withthe income cycle in remote Aboriginal communities. 1015,1016In some communities purchased food intake is supplemented by procurement of traditional foods. In the 1994National Aboriginal and Torres Strait Islander Survey – the last time these questions were asked – 10% ofrespondents aged over 14 years reported spending more than 1 hour a week hunting or foraging for traditionalfoods and, of these, more than half reported spending more than 5 hours a week doing so. 983 Even thoughthe actual intake of traditional foods may be low in some areas, traditional foods are still popular and culturallyimportant for Aboriginal and Torres Strait Islander peoples. 7,1009,1017-1019Aboriginal and Torres Strait Islander people living in urban areasOnly limited dietary data are available for Aboriginal and Torres Strait Islander groups in urban areas. High foodcosts, poor access to nutritious foods, convenience of take-away foods, budgeting issues, overcrowding, andpoor knowledge and skills have been identified as barriers to healthy eating in these areas and can lead to foodinsecurity and overconsumption of energy-dense nutrient-poor foods and drinks. 1007,1020-1022Recommendations specific to Aboriginal and Torres Strait Islander peoplesThe general Australian dietary guidelines are relevant to Aboriginal and Torres Strait Islander peoples. 353,440,1023-1026In particular, increased consumption of vegetables and fruits could be expected to improve the health andnutritional status of Aboriginal and Torres Strait Islander people.Lactose intolerance after the age of 3–5 years may, however, be problematic in some areas or for someindividuals. 610,611 Alternative calcium sources such as chewing meat and fish bones, and consumption of small,soft fish bones (e.g. in tinned salmon), and low-lactose dairy foods (such as matured cheese and yoghurt) arerecommended in these cases.Consumption of traditional bush foods should be supported wherever possible, although intake of some highsaturated fat marine animal foods, such as dugong, should be limited, as was the case traditionally. 1027 In addition,there may be a problem with high levels of heavy metals in the organ meat of turtle and dugong. 1028106EAT FOR HEALTH – australian dietary guidelinesNational <strong>Health</strong> and Medical Research Council
As with other population groups, it is important to encourage and support breastfeeding, to ensure that childrenand adolescents receive sufficient nutritious food to grow and develop normally, and to ensure that the growth ofyoung children is checked regularly.Aboriginal and Torres Strait Islander people would benefit from:• enjoying traditional foods whenever possible• when choosing store foods, choosing those most like traditional bush foods, such as fresh plant foods,wholegrain (cereal) foods, seafoods, and lean meats and poultry.A4WomenWomen are particularly vulnerable to poverty, illiteracy, food insecurity and poor health. 25,26,884 Single parentfamilies, of which 87% are headed by women in Australia, face higher risk of poverty and food security. 1029,1030Women are particularly subject to anaemia between puberty and menopause because of folate or iron deficiency,and after menopause to osteoporosis and breast cancer. Pregnancy and lactation have an associated nutritionrisk due to increased nutrient requirements. Maternal nutritional status is a major determinant of foetal and infantnutritional status.A5Infants and childrenChildren, particularly those under 5 years of age, are particularly susceptible to socioeconomic inequalitiesthat lead to marked differentials in health and nutrition. There is a clear association between the wealth of theenvironment the child grows up in, including socioeconomic indicators such as maternal education, and familyincome. 884 According to the 2005–06 New South Wales Population <strong>Health</strong> Survey, exclusive breastfeeding ofchildren at 6 months of age was significantly lower for infants with: 877• mothers without tertiary qualifications (13%) compared with for those with tertiary qualifications (25%)• mothers living in the lowest socioeconomic status areas (11%) compared with those in the highestsocioeconomic status areas (26%)• mothers aged younger than 25 years (9%) compared with mothers aged 25 years and over (17%).Further information is available in the Infant Feeding <strong>Guidelines</strong>. 351A6Older peopleLiving alone, as many older adults do, has been associated with a poorer, less varied diet. Older people often relyon pensions and have increasing difficulty with transport and communication, access to facilities, and preparationof food. Ill health and poor dentition can also compromise nutritional status. As the population continues to age,the demand for residential, respite and day-care services for older people has increased.The <strong>Dietary</strong> <strong>Guidelines</strong> are not applicable to frail elderly people as reducing food components such as fat, salt andsugar – which may make food more palatable — is not always appropriate in this group.A7People born overseasMany migrants enjoy health that is as good as, if not better than, that of the Australian-born population. 24 Thiscould be partly because migrants are selected for their health status, or because, in some cases, they are lesslikely to be exposed to risk factors for non-communicable disease before they arrive in Australia. However thereis a small proportion of the migrant population, such as refugees, who experience poorer health than otherAustralians due to socioeconomic and political factors. 24Mortality rates for people born overseas are generally lower than for people born in Australia, but the causesof mortality differ depending on country of birth, with some migrants experiencing higher mortality rates forparticular conditions than Australian-born people. The prevalence of diet-related diseases also varies in differentmigrant groups. <strong>For</strong> example, diabetes is more prevalent among those born in Germany, Greece, India, Italy,Lebanon and Poland, and coronary heart disease is more prevalent among those born in Poland. 24AppendicesNational <strong>Health</strong> and Medical Research Council107
The prevalence of health risk factors also varies depending on country of birth. People from South-East Asia areless likely than Australian-born people to smoke, drink alcohol at risky or high-risk levels and be overweight orobese. In contrast, people from Oceania, the United Kingdom and southern and eastern Europe are more likely tobe overweight or obese than those born in Australia. 24The health of migrants approaches the health of the local population over time, as migrants’ habits and lifestylesmove towards those of the wider Australian community. Food habits may change out of choice, because of thelimited availability of traditional and familiar foods, or because of change in economic circumstances in Australia.Similarly, financial and language difficulties may affect access to education and employment opportunities whichthen affects income, health and nutrition literacy, and access to nutritious foods. Some migrants experiencedisadvantages such as social isolation and poor housing, which can affect access to safe food and safe preparationof food, and are generally in a relatively vulnerable position in their new environments, regardless of the typeof migration. 884A8Rural and remote AustraliansMortality rates increase as remoteness increases. 24 People living outside major cities are more likely to havehypertension, high cholesterol and report drinking at risky or high-risk levels. They were also more likely to beclassified as overweight or obese. However rates of some cancers decrease slightly with remoteness. 24Underlying factors contributing to increased health risk include the lower levels of education, income andemployment of many rural communities, occupation risks from farm or mining work, greater levels of smokingand risky alcohol use, less access to health services and staff, and the hazards of driving long distances.Among specific dietary factors, people living outside major cities were less likely to eat too few vegetablesbut more likely to have insufficient fruit intake. 24In Australia, the cost of a basket of nutritious foods has been consistently found to be at least 30% higherin remote areas compared to capital cities. 317,999,1009,1011-1014 Among the most remote communities, costs arehighest in those areas greater than 2,000 km from capital cities, suggesting prices are influenced markedlyby transport costs. 317 The availability of nutritious foods is limited in regional and remote areas in northernAustralia. 317,999,1009,1011-1014 But even in south-west Victoria, people living in more remote towns without a majorsupermarket faced limited availability of healthy food basket items. 987 In New South Wales, the variety of fruitand vegetables available also decreases with remoteness and also with decreasing socioeconomic status ofthe community. 1031108EAT FOR HEALTH – australian dietary guidelinesNational <strong>Health</strong> and Medical Research Council
Appendix BProcess reportIn 2003, the NHMRC issued the <strong>Dietary</strong> <strong>Guidelines</strong> for Australian Adults and <strong>Dietary</strong> <strong>Guidelines</strong> for Children andAdolescents in Australia, having already issued <strong>Dietary</strong> <strong>Guidelines</strong> for Older Australians in 1999. With a policy ofreviewing guidelines every 5 years, the NHMRC in collaboration with the <strong>Health</strong>y Living Branch of the Departmentof <strong>Health</strong> and Ageing (DoHA) commenced a review of the suite of <strong>Dietary</strong> <strong>Guidelines</strong> in 2008. The above threereports have now been combined into a single document.The Australian <strong>Dietary</strong> <strong>Guidelines</strong> (the <strong>Guidelines</strong>) provide a resource that promotes the benefits of healthy eatingto improve community health and wellbeing and to reduce the risk of diet-related disease. The <strong>Guidelines</strong> areintended for healthy members of the general population of any age, including people with common diet-relatedrisk factors such as being overweight. They are not intended for people with medical conditions who requirespecialised dietary advice, or for frail elderly people who are at risk of malnutrition. The target audience of the<strong>Guidelines</strong> includes health professionals (including dietitians, nutritionists, GPs and nurses/lactation consultants),educators, government policy makers, the food industry and other interested parties. Other resources are beingdeveloped from the <strong>Guidelines</strong> for other target audiences.B1ContributorsThe <strong>Guidelines</strong> were developed utilising a collaborative approach, combining the content expertise of the <strong>Dietary</strong><strong>Guidelines</strong> Working Committee with the assistance of expert methodologists. The NHMRC managed the processand representatives from DoHA participated as observers throughout the process. DoHA provided a significantproportion of the funding for developing these <strong>Guidelines</strong>.<strong>Dietary</strong> <strong>Guidelines</strong> Working CommitteeAn expert working committee (the Working Committee), chaired by Dr Amanda Lee and deputy-chaired byProfessor Colin Binns, was appointed in April 2008 to guide and advise the redevelopment of the Australian<strong>Dietary</strong> <strong>Guidelines</strong>. Representatives from DoHA attended working committee meetings as observers.The Working Committee developed the guidelines in accordance with NHMRC procedures and in keeping with thefollowing terms of reference established by the NHMRC.Table B1: Terms of reference of the <strong>Dietary</strong> <strong>Guidelines</strong> Working CommitteeThe <strong>Dietary</strong> <strong>Guidelines</strong> Working Committee (the Working Committee) will oversee and provide expertise onthe revision of The Core Food Groups (1994), the <strong>Dietary</strong> <strong>Guidelines</strong> for Older Australians (1999), the <strong>Dietary</strong><strong>Guidelines</strong> for Children and Adolescents incorporating the Infant Feeding <strong>Guidelines</strong> for <strong>Health</strong> Workers (2003),the <strong>Dietary</strong> <strong>Guidelines</strong> for Australian Adults (2003). This will include:1. Input to the development and conduct of necessary literature reviews2. Advice on development of a consultation strategy3. Input to the development of appropriate documents including guidelines which will take into account:• the best available scientific evidence• comments provided by the broader community through public consultation• the needs of health service providers• any other relevant matter.AppendicesNational <strong>Health</strong> and Medical Research Council109
Table B2: Members of the Working CommitteeProfessor Amanda Lee (Chair)School of Public <strong>Health</strong> and Social Work and School of Exercise and Nutrition Sciences,Queensland University of TechnologyProfessor Colin Binns (Deputy Chair)School of Public <strong>Health</strong>, Curtin UniversityDr Geoffrey Annison (from August 2010)Australian Food and Grocery CouncilProfessor Sandra Capra, AMSchool of Human Movement Studies, University of QueenslandProfessor Peter DaviesSchool of Medicine, University of QueenslandChildren’s Nutrition Research CentreProfessor Sharon FrielNational Centre for Epidemiology and Population <strong>Health</strong>, Australian National UniversityMs Clare HughesCancer Council NSWAssociate Professor Mark LawrenceSchool of Exercise and Nutrition Sciences, Deakin UniversityProfessor Dorothy MackerrasFood Standards Australia New ZealandDr Rosemary Stanton, OAMVisiting Fellow, School of Medical Sciences, University of New South WalesProfessor Linda TapsellSchool of <strong>Health</strong> Sciences, University of WollongongDr David Roberts (until May 2010)Food and Nutrition ConsultantDr Karen Webb (until June 2009)School of Public <strong>Health</strong>, University of SydneyNHMRC project team• Ms Cathy Connor• Ms Emma Breen• Ms Tess Winslade• Ms Bronwyn BattissonDepartment of <strong>Health</strong> and Ageing Project Team• Ms Jacinta McDonald• Ms Erica Nixon• Ms Marina Dron• Ms Rosalind Knox• Ms Fiona Styles110EAT FOR HEALTH – australian dietary guidelinesNational <strong>Health</strong> and Medical Research Council
Contractors• Ms Skye Newton, Adelaide <strong>Health</strong> Technology• Ms Philippa Middleton, Methodologist, University of Adelaide• Dr Katrine Baghurst, Australian Guide to <strong>Health</strong>y <strong>Eat</strong>ing• RaggAhmed, Technical writers (until public consultation)• Mr Simon Grose, Editor (public consultation draft)• Ampersand <strong>Health</strong> Science Writing, Editor (final version)• Quantum Market Research, Focus Group Testing• Folk Pty Ltd, Graphic Design for Australian Guide to <strong>Health</strong>y <strong>Eat</strong>ingDeclarations of interest processDeclarations of interest were made by all Working Committee members during the review process in accordance withthe requirements of the National <strong>Health</strong> and Medical Research Council Act 1992. A record of interests was managedby NHMRC and relevant information was made publicly available on the NHMRC website to ensure transparency.During meetings where committee members were identified as having a significant real or perceived conflict ofinterest, the Working Party Chair could request they leave the room or not participate in discussions on matterswhere they were conflicted. Working Committee members were required to update their information as soonas they became aware of any changes to their interests and there was a standing agenda item at each meetingwhere declarations of interest were called for and these were recorded in the meeting minutes.B2Literature reviewIn the past, Australian dietary guidelines have provided recommendations based on evidence including that ofnutrients and associations with health outcomes. However, as people eat foods rather than isolated nutrients,the Working Committee determined that the literature review should primarily seek evidence on the relationshipbetween foods, dietary patterns and health outcomes. The Working Committee determined that the revisedguidelines would be an evolution from the previous versions and build upon their evidence and science base.In 2009, the Dietitians Association of Australia (DAA) was commissioned through an open Request for Tenderprocess to systematically review the literature.The Working Committee, with the assistance of a NHMRC Guideline Assessment Register Panel Consultant,Ms Skye Newton of Adelaide <strong>Health</strong> Technology Assessment, developed 27 complex search questions for theliterature review in areas emerging in the literature and areas included in the 2003 edition of the dietary guidelineswhere the evidence base may have changed. A number of established food, diet and health relationships coveredin the 2003 edition, where the evidence base was unlikely to have changed substantially, were identified as notneeding specific search questions to be asked. <strong>For</strong> example, the relationship between diets high in saturated fatand increased risk of high serum cholesterol.The 27 search questions for the literature review were prioritised to 12 complex questions in consideration of timeand financial constraints. These formed the basis of questions for three types of review:• systematic literature review (systematic review of the primary literature)• umbrella review (systematic review of systematic reviews)• narrative reviews (comprehensive review of the literature to answer more qualitative questions e.g. nature andscope of international food guides and practices promoting food safety).The final questions for systematic and umbrella reviews were transcribed into PICO format. Detailed definitions andsearch terms were developed for each component of the final complex search questions and a number of specificsearch questions for each variable arising from various permutations were formulated for each complex question. 38Standardised processes were used to review the literature. 32,40-42 Databases searched included CINAHL, MEDLINE,DARE, Cochrane, ScienceDirect, PsychLit and ERIC. <strong>For</strong> each specific search question, the identified articles wereretrieved and reviewed for relevance by a team of reviewers. Papers published before 2002 were excluded. Duplicates,papers not within the scope of the search questions and papers that were already included in meta-analyses, describedcross-sectional studies or were not research studies (e.g. letters and editorials) were also excluded.AppendicesNational <strong>Health</strong> and Medical Research Council111
The evidence was assessed according to NHMRC levels and grades for recommendations for developers ofguidelines, 42 which allowed each article to be critically appraised and assigned a level of evidence based on ahierarchy according to the type of research question. As this review looked at causality and intervention researchquestions the following hierarchy was used.Table B3: Levels of evidence in the literature reviewLevel ILevel IILevel III-1Level III-2Level III-3Level IVA systematic review of level II studiesA randomised controlled trialA pseudorandomised controlled trialA comparative study with concurrent controls:• Non-randomised experimental trial• Cohort study• Case-control study• Interrupted time series with a control groupA comparative study without concurrent controls:• Historical control study• Two or more single arm study• Interrupted time series without a parallel control groupCase series with either post-test or pre-test/post-test outcomesData was extracted from included studies and assessed for strength of evidence, size of effect and relevance ofevidence according to standardised NHMRC processes. 32,40-42 The components of the body of evidence; evidencebase (quantity, level and quality of evidence); consistency of the study results; clinical impact; generalisability; andapplicability to the Australian context) – were rated as excellent, good, satisfactory or poor according to standardNHMRC protocols. 38,42 The reviewers then translated the evidence into a draft body of evidence statement. The draftevidence statements were graded A to D according to standard NHMRC protocols: 42• Grade A indicates that the body of evidence can be trusted to guide practice• Grade B indicates that the body of evidence can be trusted to guide practice in most situations• Grade C indicates that the body of evidence provides some support for the recommendations but care shouldbe taken in its application• Grade D indicates that the body of evidence is weak and any recommendation must be applied with caution.In order to reduce potential risks associated with advice being based on findings of single or only a few studies,the Working Committee and DAA contractors advised that a minimum of five quality studies were required beforea graded draft evidence statement could be made. The individual studies included in meta-analysis studies wereconsidered as separate studies.Once the evidence statements had been drafted and graded, the NHMRC commissioned a methodologistthrough the NHMRC methodologist panel, Ms Philippa Middleton from the University of Adelaide, to assist theWorking Committee to ensure that the review activities had been undertaken in a transparent, accurate andunbiased manner. The methodologist and the Working Committee scrutinised each step of the review processby accessing the original papers and reviewing the rating of evidence components, and the wording and gradingof each draft evidence statement. As a result, some evidence statements and grades were amended using aWorking Committee consensus approach, and the final evidence statements and grades were agreed.As nutrition is a continuously evolving area and research studies are published on a regular basis, the WorkingCommittee also considered results from high quality studies (primarily systematic reviews) published after theliterature review, and where deemed warranted, included the findings and references in the relevant evidencesections in each chapter. However, only the evidence statements from systematic review of the literature until2009 were graded.112EAT FOR HEALTH – australian dietary guidelinesNational <strong>Health</strong> and Medical Research Council
The results of this literature review, including the questions that were asked, are included in the report of thecommissioned literature review: A Review of the evidence to address targeted questions to inform the revisionof the Australian <strong>Dietary</strong> <strong>Guidelines</strong> (Evidence Report). 33The original literature search did not locate a sufficient number of food-based studies – rather than nutrient-basedstudies – to be able to draft evidence statements regarding food intake and dietary patterns for pregnant andbreastfeeding women and health outcomes of infants and/or mothers. Therefore, a team from the Universityof Adelaide and the Women’s and Children’s <strong>Health</strong> Research Institute was commissioned through a Requestfor Quote process from the NHMRC multi-use panel to conduct a more extensive search of the literature tolocate and summarise studies meeting specified eligibility criteria. This team, led by Ms Philippa Middleton andcomprising Professor Maria Makrides, Dr Carmel Collins, Dr Alice Rumbold, Dr Jo Zhou, Professor CarolineCrowther and Associate Professor Vicki Flenady reviewed the literature for health outcomes for infants andmothers from food-based studies on pregnant and breastfeeding women. Parts of this review were used to informthe ‘practical considerations’ for pregnant and breastfeeding women that have been included in these guidelines.The Working Committee also determined that there was an evolving and increasing body of literature on theenvironmental impacts of the production and consumption of food and vice-versa. Therefore, in addition to theoriginal narrative review, a review of the relevant literature, particularly that pertaining to Australia, was conductedby Professor Friel and a team at the Australian National University. On the basis of this work, NHMRC recognisedthat the inter-relationship between diet and the environment is a cross-sectoral matter and should be consideredas such.B3Food Modelling SystemIn 2008, the DAA was commissioned through an open Request for Tender process to undertake an extensivereview of The Core Food Groups (1994). This revised document, A modelling system to inform the revision ofthe Australian Guide to <strong>Health</strong>y <strong>Eat</strong>ing (Food Modelling System), was released for public consultation from27 March 2010 to 10 May 2010. The finalised Food Modelling System was released in 2011. 9,1032The Food Modelling System determined a range of combinations of the amounts and types of foods that couldbe consumed to meet the nutritional needs within the least amount of energy for the smallest and least activepeople within an age and sex group. These are called Foundation Diets. <strong>For</strong> those that are more physically activeor taller (and older, in the case of infants, children and adolescents) within each age/sex group, the models provideadditional food options to meet additional energy needs. These are called Total Diets. (Note that the Total Diet forthe smallest, least active people in each age/sex groups is equivalent to the Foundation Diet.)The number of serves and serve sizes modelled in the Food Modelling System were considered together withother sources of evidence to determine the recommendations in these <strong>Guidelines</strong> (see Sections B2, B4 and B5).<strong>For</strong> further information or to download the Food Modelling System visit www.eatforhealth.gov.au.B4Development of the Australian Guide to <strong>Health</strong>y <strong>Eat</strong>ingThe development of the Australian Guide to <strong>Health</strong>y <strong>Eat</strong>ing was undertaken in conjunction with an update of the<strong>Dietary</strong> <strong>Guidelines</strong> for Australian Adults, the <strong>Dietary</strong> <strong>Guidelines</strong> for Children and Adolescents in Australia and the<strong>Dietary</strong> <strong>Guidelines</strong> for Older Australians.It was informed by the Food Modelling System and under the guidance of the Working Committee, ProfessorKatrine Baghurst was directly sourced to develop the revised the Australian Guide to <strong>Health</strong>y <strong>Eat</strong>ing given herextensive knowledge of the Food Modelling System.While the modelling was undertaken to inform the revision of the Australian Guide to <strong>Health</strong>y <strong>Eat</strong>ing, some ofthe complexities of the modelling were simplified for the final presentation of the guide. <strong>For</strong> example, severaldifferent subgroups of vegetables were modelled but the final recommendation in terms of serves per day is forthe Vegetable group as a whole, with additional advice to choose across the various subgroups.AppendicesNational <strong>Health</strong> and Medical Research Council113
As part of the consultation process, Quantum Market Research was commissioned through an open Request forTender process to conduct focused discussion in October 2010 and November 2011 to determine the preferredgraphics and the messages for the Australian Guide to <strong>Health</strong>y <strong>Eat</strong>ing. Discussion was undertaken with:• eight groups consisting of members of the community• four groups consisting of professionals including health, teaching, child care and community health• two groups consisting of Aboriginal and Torres Strait Islander populations and professionals.The groups from the general public (all adults) were divided into two age groups with a good representationacross the population.Results were also available from a survey of 40 dietitians attending a workshop at the DAA meeting in 2007.This survey was concerned with attitudes to the current Australian Guide to <strong>Health</strong>y <strong>Eat</strong>ing including:• use of the guide and what changes would make it more usable• which other food guides were used and the advantages/disadvantages of these guides• suitability of food groupings• changes that might be needed and preferred presentation formats.A web-based survey was also undertaken by NHMRC in 2007 before commencing the reviews of the AustralianGuide to <strong>Health</strong>y <strong>Eat</strong>ing and the <strong>Guidelines</strong>.Under the direction of the NHMRC Project Team and NHMRC Publications Team, Folk Pty Ltd were engaged fromthe Australian Government Department of Human Services Creative and Design Panel to complete the graphicdesign work for the Australian Guide to <strong>Health</strong>y <strong>Eat</strong>ing.B5Development of the Australian <strong>Dietary</strong> <strong>Guidelines</strong>In translating the evidence to formulate the dietary guideline recommendations, the Working Committeeconsidered the following sources of evidence:• the commissioned literature review (Evidence Report) 33• the Food Modelling System 9• the NRV Document 8• key authoritative government reports and documents provided by the Working Committee and the NHMRC,including evidence in material provided by stakeholders during consultation processes and findings of relevantlarge, quality, peer-reviewed studies published after 2009, and• the previous dietary guidelines for Australians series and their supporting documentation. 34-36The information in the previous guidelines was used as the basis. New evidence was assessed to determinewhether associations between food, dietary patterns and health outcomes had strengthened, weakened, orstayed the same since the last review of the evidence.The final wording of the guideline recommendations was developed by a Working Committee consensus approachand was focus tested by Quantum Market Research. <strong>Guidelines</strong> recommendations were further refined followingthe public consultation process.RaggAhmed was commissioned in October 2010 by NHMRC through a Request for Quote process through theNHMRC Technical Writers and Editors Panel to edit the draft chapters and collate them into one succinct reportincluding all referencing. This report underwent further editing by Mr Simon Grose from the NHMRC TechnicalWriters and Editors Panel before release for public consultation.Following public consultation and expert review, with the advice of the Working Committee, the NHMRC projectteam finalised the technical writing of the <strong>Guidelines</strong>. Ampersand <strong>Health</strong> and Science Writing was selectedthrough a Request for Quote process from the NHMRC Technical Writers and Editors Panel to complete thefinal editing.The NHMRC and DoHA project teams also developed the companion resources including an interactivewebsite, guideline summaries, posters and brochures relating to the general population, infants, children andpregnant women.114EAT FOR HEALTH – australian dietary guidelinesNational <strong>Health</strong> and Medical Research Council
Public consultationOn 2 November 2011the Council of NHMRC agreed to recommend the Chief Executive Officer (CEO) of NHMRCrelease the <strong>Guidelines</strong> for public consultation.Public consultation on the draft <strong>Guidelines</strong> was undertaken from 13 December 2011to 29 February 2012. This processwas conducted in accordance with Section 13 of the National <strong>Health</strong> and Medical Research Council Act 1992.The public consultation was advertised in major Australian newspapers and on the NHMRC website. Invitations werealso sent to a large number of key stakeholders and those with a known interest in nutrition. Over 200 submissionswere received from a variety of stakeholders including individuals, professionals and industry.The Working Committee met on 17 and 18 April 2012 and again on 22 May 2012 to consider the submissions.More information and/or consideration were requested for:• the impact of food choices and the environment (practical recommendations required for environmentallysustainable food choices)• changed recommendation wording from ‘enjoy’ to ‘eat’• the approach to vegetarian and vegan diets• content around ‘red meat’• the placement of fats and oils ‘outside’ of the five major food groups• lack of information on glycaemic index• the recommendation on added sugars• the recommendation on foods to limit with consideration for ‘food-based’ approach• the recommendation for mostly ‘reduced fat’ dairy• increased information on the concept of ‘energy density’• the beneficial properties of fibre• practical issues relating to reducing fat and types of fats• legumes appearing in two food groups, and• difficulties interpreting the Australian Guide to <strong>Health</strong>y <strong>Eat</strong>ing and companion information (including commentson cultural diversity and relative sizes of foods).A second public consultation on Appendix G to the <strong>Guidelines</strong> was undertaken from 3 October 2012 to 2November 2012. This process was conducted in accordance with Section 13 of the National <strong>Health</strong> and MedicalResearch Council Act (1992). The public consultation was advertised in major Australian newspapers and onthe NHMRC website. Invitations were also sent to a large number of key stakeholders and those with a knowninterest in nutrition and sustainability. Over 70 submissions were received from a variety of stakeholders includingindividuals, professionals, government and industry.These submissions were considered by the Office of NHMRC. More information and/or consideration wererequested for:• focus on improving health but allowing for considerations of the environmental impact of dietary patterns,specifically overconsumption and waste management.• greater acknowledgment of the complexities of the food system, including the concept of ‘triple bottom line’sustainability, and the difficulties in assessing commodities individually and/or in isolation from the wholefood system.• clarification of Figure G1 to better represent a system (cyclic) rather than linear process, including recognitionof potential ‘drivers’ such as consumer and industry interest, and government policy.• acknowledgement of initiatives to improve sustainability at both government and non-government levels.• further information for health professionals (with references) with more comprehensive and practical suggestions.AppendicesNational <strong>Health</strong> and Medical Research Council115
Expert reviewThe <strong>Guidelines</strong> underwent independent expert review to gain advice, primarily on the evidence base used.The expert reviewers were required to declare any conflicts of interest as per the process outlined in Section B1.Table B4: Expert review participantsProfessor Louise BaurUniversity of Sydney, AustraliaProfessor Johanna DwyerTufts Medical Centre, Tufts University, United States of AmericaProfessor Caryl NowsonSchool of Exercise and Nutrition Sciences, Deakin University, AustraliaProfessor Murray SkeaffDepartment of Human Nutrition, University of Otago, New ZealandProfessor Boyd SwinburnSchool of <strong>Health</strong> and Social Development, Deakin University, AustraliaSchool of Population <strong>Health</strong>, University of AucklandCouncil of NHMRC EndorsementThe <strong>Guidelines</strong> were considered by the Council on 30 November 2012 for recommendation to the CEO for issuing.The CEO was pleased to accept the Council’s advice and agreed to issue to guidelines under Section 7(1a) of theNational <strong>Health</strong> and Medical Research Council Act 1992.ReviewIn line with NHMRC policy, Council will look at the current <strong>Guidelines</strong> after 5 years and recommend to NHMRCCEO if they need to be reviewed.116EAT FOR HEALTH – australian dietary guidelinesNational <strong>Health</strong> and Medical Research Council
Appendix CHistory and timeline of Australian nutrition documentsThe Commonwealth Advisory Council on Nutrition was formed in 1936 and became the Nutrition Committeeof the NHMRC in 1939, at the same time as a Nutrition Unit was established in the then CommonwealthDepartment of <strong>Health</strong>. Soon after, state and territory health departments set up similar nutrition committeesand have since had a role in providing nutrition information and education programs in Australia.From the 1940s through to the 1970s the Commonwealth and the states and territories published pamphlets andbooklets to guide food selection and provide education tools, including the Five Food Group plan, which listed thefood groups ‘bread and other cereals’, ‘vegetables and fruit’, ‘meat and meat alternatives’, ‘milk and milk products’,and ‘butter/table margarine’.1938 – Tables of composition of Australian foodsFirst set of tables of composition of Australian foods, including data from both local and overseas sources for over1,100 foods. It was revised and reprinted many times over the next decades.1979–83 – <strong>Dietary</strong> guidelines for AustraliansIn response to an increase in nutritional problems related to overconsumption of food, in 1979 the Department of<strong>Health</strong> developed eight <strong>Dietary</strong> Goals for Australians. These were modified to provide direct advice to members ofthe community as <strong>Dietary</strong> guidelines for Australians, which were endorsed by the NHMRC in 1982. 750 It was notedthat these guidelines should be reviewed as further data became available on the nutritional status of Australianand the relationships between diet and disease. 10331989 – Nutrient data table (NUTTAB)The first electronic food composition data release (on diskette), as the first edition of the Nutrient Data Table foruse in Australia (NUTTAB), containing a combination of Australian and British data. 10341989–95 – Composition of foods, Australia (COFA)The Composition of foods, Australia (COFA) series was released in seven volumes, containing the first compilationof new Australian-sourced data for Australian foods from the analytical work of Greenfield and colleagues.1991 – Recommended dietary intakes for use in AustraliaThe development of the recommended dietary intakes (RDIs) began in 1980 and the report was publishedin 1991. 1035 The RDIs are derived from estimates of requirements for each age/sex category and incorporategenerous factors to accommodate variations in absorption and metabolism. They therefore apply to groupneeds. RDIs exceed the actual nutrient requirements of practically all healthy persons and are not synonymouswith requirements.1992 – Food and nutrition policyThe Australian Food and nutrition policy, endorsed in 1992, 31 aimed to improve the health of Australians andreduce the burden of preventable diet-related death, illness and disability. The policy strategies were developed inalignment with dietary guidelines and based on principles of good nutrition, ecological sustainability and equity.1992 – <strong>Dietary</strong> guidelines for AustraliansAn expert panel was set up in 1989 by the Public <strong>Health</strong> Committee to review the existing dietary guidelines. In 1992,the <strong>Dietary</strong> <strong>Guidelines</strong> for Australians were published by the NHMRC for use by healthy adults. They representedthe best consensus of scientific knowledge and public health advice available. A guideline to encourage and supportbreastfeeding was included, as were specific guidelines on calcium and iron.AppendicesNational <strong>Health</strong> and Medical Research Council117
1995 – The Core Food GroupsThe Core Food Groups 1032 was the modelling document that underpinned the development of The Australian Guideto <strong>Health</strong>y <strong>Eat</strong>ing (see below). The purpose of The Core Food Groups was to discuss the basis for a core foodgroup system that reflected advances in nutrition knowledge and to complement existing nutrition referencesat the time (e.g. <strong>Dietary</strong> guidelines for Australians, 1992). The need for a core food group system arose becauseexisting food selection guides in Australia at the time differed in the advice offered. The Core Food Groupsdocument was developed to provide an approach that was objective, scientifically rigorous and could be updatedas new evidence on nutrition became available. It provided advice on core food quantities consistent with nationalnutrition recommendations and targets, creating a platform for the interpretation of food and nutrition researchinto recommendations regarding food choices.1998 – The Australian Guide to <strong>Health</strong>y <strong>Eat</strong>ingThe Australian Guide to <strong>Health</strong>y <strong>Eat</strong>ing 46 was a food guide for Australia that reflected the multicultural nature of thepopulation. Based on the modelling of The Core Food Groups, it was designed for all sectors of the food systemto use as a nutrition education and information tool.1999 – <strong>Dietary</strong> <strong>Guidelines</strong> for Older AustraliansThe <strong>Dietary</strong> <strong>Guidelines</strong> for Older Australians 34 were based on the <strong>Dietary</strong> <strong>Guidelines</strong> for Australians (1992) 751 andwere designed to take account of the changes in nutritional needs that occur with ageing. The <strong>Guidelines</strong> wereaimed at healthy, independent Australians aged 65 and over, but additional advice was provided on how the<strong>Guidelines</strong> applied to older Australians who receive assistance with meals or live in residential aged care facilities.The <strong>Guidelines</strong> were also useful for health professionals who wished to develop suitable diets for older people ina range of health circumstances.1999 – Australian Food and Nutrient Database (AUSNUT)The first AUSNUT (Australian Food and Nutrient Database) was an electronic file of nutrient data based on thetechnical support file for the 1995 National Nutrition Survey. The AUSNUT series of databases are derived fromthe NUTTAB series for the purpose of coding the food intake data collected in national nutrition surveys. 1036A second edition, used to code the 2007 Australian Children’s Nutrition and Physical Activity Survey, 12 wasreleased in 2008. 1037 The third edition, developed to code the 2011–13 Australian <strong>Health</strong> Survey data, is plannedfor release in 2013.2000 – Nutrition in Aboriginal and Torres Strait Islander peoples: An informationpaperThis information paper, endorsed by NHMRC, presented information about nutrition and nutrition-related diseasein Aboriginal and Torres Strait Islander peoples. This information was specifically targeted to health professionalsworking to improve the nutritional health of Aboriginal and Torres Strait Islander peoples, and provided a referencematerial for practice and teaching.2001 – <strong>Eat</strong> well Australia: An agenda for action in public health nutrition and theNational Aboriginal and Torres Strait Islander Nutrition Strategy andAction Plan<strong>Eat</strong> well Australia: An agenda for action in public health 2 was designed to provide government and other sectors witha strategic framework and an agenda for action on public health nutrition for the first decade of the 21st century.This document provides the detailed <strong>Eat</strong> well Australia Agenda for Action, as outlined in the summary <strong>Eat</strong> wellAustralia Strategic Framework document. <strong>Eat</strong> well Australia is a coherent national approach to the underlying causesof the preventable burden of diet-related disease and early death, providing a set of interlinked initiatives for theprevention and management of these diseases.118EAT FOR HEALTH – australian dietary guidelinesNational <strong>Health</strong> and Medical Research Council
The National Aboriginal and Torres Strait Islander Nutrition Strategy and Action Plan (NATSINSAP) 1038 set out aframework for action to improve Aboriginal and Torres Strait Islander nutritional health under seven priority areas:• food supply in rural and remote communities• food security and socioeconomic status• family-focused nutrition promotion• nutrition issues in urban areas• the environment and household infrastructure• the Aboriginal and Torres Strait Islander nutrition workforce• national food and nutrition information systems.An evaluation of the NATSINSAP was completed in 2010, and is expected to contribute to informing futurenational policy development aimed at improving nutrition in Aboriginal and Torres Strait Islander peoples.2003 – <strong>Dietary</strong> <strong>Guidelines</strong> for Adults <strong>Dietary</strong> <strong>Guidelines</strong> for Children and AdolescentsThe <strong>Dietary</strong> <strong>Guidelines</strong> for Australian Adults 36 and <strong>Dietary</strong> <strong>Guidelines</strong> for Children and Adolescents in Australia 35(incorporating the Infant Feeding <strong>Guidelines</strong> for <strong>Health</strong> Workers), were based on the best available scientificevidence and provided information for health professionals and the general population about healthy foodchoices. The use of the guidelines was intended to encourage healthy eating and lifestyle to minimise the riskof developing diet-related diseases in the Australian population.The guidelines highlighted the groups of foods and lifestyle patterns that promote good nutrition and health.As with all previous dietary guidelines, recommendations were presented as an integral whole and no specificguideline was considered more important than any another.2006 – Nutrient Reference Values for Australia and New Zealand includingRecommended <strong>Dietary</strong> Intakes (NRV Document)In 2002, the NHMRC was commissioned by DoHA in collaboration with the New Zealand Ministry of <strong>Health</strong> tomanage the revision process for the Recommended dietary intakes document. This resulted in the publicationof the NRV Document, 8 which identified a number of reference values that address nutrient needs and excessintake for various age/sex groups.2006 – NUTTAB OnlineThe first online release of nutrient data, with the 6 th edition of NUTTAB released by FSANZ. The 7 th edition ofNUTTAB was released in 2011. 1039 Most of the NUTTAB data is now Australian analytical data and covers morethan 2,500 foods available in Australia and up to 45 nutrients per food.2011 – A review of the evidence to address targeted questions to inform the revisionof the Australian <strong>Dietary</strong> <strong>Guidelines</strong> (Evidence Report)The primary aim of the Evidence Report 33 was to undertake a series of targeted systematic reviews of theliterature published since 2002 on the interrelationship between food, diet, health and disease for differentpopulation subgroups. New and emerging evidence was prioritised in this review.2011 – A modelling system to inform the revision of the Australian Guide to <strong>Health</strong>y<strong>Eat</strong>ing (Food Modelling System)In 2009 and 2010, the nutrient recommendations from the 2006 Nutrient Reference Values document weretranslated (informed by A review of the evidence to address targeted questions to inform the revision of theAustralian <strong>Dietary</strong> <strong>Guidelines</strong>) into recommended amounts and types of foods that constitute healthy dietarypatterns that prevent nutrient deficiency, reduce risk of chronic disease, and are culturally acceptable, sociallyequitable and environmentally sustainable. This document updates The Core Food Groups (1995).The Food Modelling System 9 also informed the development of these <strong>Guidelines</strong>, which is an update of thepreviously separate reports: the <strong>Dietary</strong> <strong>Guidelines</strong> for Adults (2003), <strong>Dietary</strong> <strong>Guidelines</strong> for Older Australians(1999) and <strong>Dietary</strong> <strong>Guidelines</strong> for Children and Adolescents (2003).AppendicesNational <strong>Health</strong> and Medical Research Council119
Appendix DQuestions for the literature review to underpin the revisionof the dietary guidelinesSystematic literature review questions1. Does the evidence suggest a particular maximum and/or minimum level of consumption of specificfoods including:• fruit• vegetables• meat• dairy (cheese, milks and yoghurt)• cereals/grains• legumes• nuts and seeds• fish• poultry• eggs• fat/oil• salt/sodium• sugars• beverages (including water)• alcoholis beneficial/detrimental in respect to:• chronic diseases including:––obesity––cardiovascular disease––stroke––diabetes––cancer––hypertension––eye-health––bone health––dental health––mental health• environmental impacts• social equity• health and well being (DALY/QALYs)?Note: Need to consider serve sizes for different age/sex groups in current guidelines (infants,children, adolescents, adults, older Australians) and pregnant and breastfeeding women.2. Which dietary patterns, foods, drinks and food components are associated with minimal green housegas emissions, minimal water use and maximum biodiversity?3. What factors lead to children adopting appropriate life course food consumption and dietary patterns?<strong>For</strong> example body image and family meals.4. What are the economic, physical and psychosocial barriers and the enablers to different populationgroups achieving diets consistent with the dietary guidelines?120EAT FOR HEALTH – australian dietary guidelinesNational <strong>Health</strong> and Medical Research Council
5. What is the most appropriate age to introduce solid foods to infants (e.g. 4 months vs 6 months)?Does the introduction of solid foods at different ages change the risk of developing allergic syndromes(e.g. eczema, wheezing, GIT symptoms)?• Which solids?• How many different foods?• Method of introduction – one at a time, length of time for one food, before another introduced,mixed products?• Method of preparation of solids (e.g. cooked, mixed with breastmilk, formula or cow’s milk)Does the earlier introduction of solids result in:• decreased breastmilk production?• increased risk of overweight and/or obesity?• increased morbidity and mortality, short term and long term?6. Is there a dose response between consuming red meat (not including processed meat as red meat)and an increased risk of cancer?7. Is there a dose response of sucrose or other refined sugars in foods or beverages on body weightindices over the long term (1 year +)?8. What is the effect of sugar-containing beverages on total energy intake and dental health in the diet?Is there a difference between fruit juice, flavoured milk and other beverages?9. What are the health benefits of grain-based foods (such as bread, breakfast cereals, oats, pasta and rice)in both refined and wholegrain forms? (comparison of refined vs wholegrain forms)10. Is there an association between specific fruits and vegetables or subgroups of these, for exampleBrassica vegetables, tomatoes, cruciferous and citrus etc, and:• obesity• cardiovascular disease• stroke• diabetes• cancer• hypertension• eye-health• bone health• dental health• mental health?11. How does greenhouse gas emissions, water scarcity and loss of biodiversity change capacity to accessa balanced, varied and sufficient diet?12. Is there a dose response between the glycaemic index and glycaemic load of the diet and developmentof obesity and insulin resistance?13. Do children with iron deficiency have higher incidence of cognitive deficits?14. Is there a safe sun exposure which will improve vitamin D status in the general population, the elderlyand children?15. What are the most appropriate indices and references to be used for the assessment of body weight,growth rates and obesity in children in Australia?16. What is the dose response between different types of milk intake and weight change in adults?AppendicesNational <strong>Health</strong> and Medical Research Council121
Umbrella review questions1. What dietary patterns, food groups including:• fruit• vegetables• meat• dairy (cheese, milks and yoghurt)• cereals/grains• legumes• nuts and seeds• fish• poultry• eggs• fat/oil• salt/sodium• sugars• beverages (including water)––alcoholwhole foods and food components are associated with:• health• longevity• reduced risk of chronic diseases including:––obesity––cardiovascular disease––stroke––diabetes––cancer––hypertension––eye health––bone health––dental health––mental healthin the general population and vulnerable groups including low socioeconomic status, Aboriginal andTorres Strait Islander peoples and culturally and linguistically diverse groups, and those living in ruraland remote areas, without serious disease?2. What is the inter-relationship between dietary patterns, foods, drinks and food components andenvironmental sustainability?3. What are the most recent data on dietary patterns and intakes of foods and food components (includingnutrients) in Australia, and how does the data vary across age/sex groups in the general population andvulnerable groups including low socio economic status, Aboriginal and Torres Strait Islander peoples andculturally and linguistically diverse groups, and those living in rural and remote areas?4. Is there a significant health advantage in balancing food intake and physical activity to maintain a healthyweight, to maintain muscle strength and a healthy body weight in older Australians, and in children tosupport normal growth and healthy development?5. What are the benefits of breastfeeding and the risks of not breastfeeding (any and exclusive), to infantsand mothers, both in the short term and long term?6. What nutritional factors are important in optimising pregnancy outcomes?122EAT FOR HEALTH – australian dietary guidelinesNational <strong>Health</strong> and Medical Research Council
7. What nutritional factors are important in optimising breastfeeding outcomes?8. How does the processing and preparation of food, including:• frozen/ canned/ dried/ juice; and• cooking methods, for example boiling, stir frying, roasting, microwaving, steaming etc;change bioavailability/nutritional value, food safety and environmental impact?Narrative review questions1. What current and past national food selection guides are used/have been used in Australia?2. What are the major national food selection guides currently used internationally?3. What methods have been used to develop national food selection guides?AppendicesNational <strong>Health</strong> and Medical Research Council123
Appendix ESummary of evidence statements of negative associationsand those of Grade DA number of relationships between food consumption and disease outcomes have not been considered orpresented in these <strong>Guidelines</strong>, even though these relationships were investigated as part of the systematicliterature review process. However, these relationships and the reviewed evidence can still be found in theEvidence Report. A summary of the relationships that have been omitted, with reasoning, is provided below.E1Grade C evidence statements: Food consumption with no associationwith a health outcomeTo avoid unnecessary confusion for the reader, Grade C evidence statements suggesting no association betweena food and specific health outcome were not included in the evidence summary tables at the beginning of eachsection within the document. These evidence statements are included in Table E1.Please note that these evidence statements are discussed in further detail within the body of the document.Table E1: Grade C ‘no association’ relationships that informed the Australian <strong>Dietary</strong> <strong>Guidelines</strong>Evidence statementGradeVegetablesConsumption of vegetables is not associated with reduced risk of type 2 diabetes.Consumption of vegetables is not associated with reduced risk of oesophageal cancer.Consumption of vegetables is not associated with reduced risk of ovarian cancer.Consumption of vegetables is not associated with reduced risk of endometrial cancer.Consumption of cruciferous vegetables, carrots, potatoes and beans and lentils is not associated with risk ofcolorectal cancer.CCCCCFruitConsumption of fruit is not associated with risk of type 2 diabetes.Consumption of fruit is not associated with risk of breast cancer.Consumption of fruit is not associated with risk of ovarian cancer.Consumption of fruit is not associated with risk of endometrial cancer.Consumption of fruit is not associated with risk of colorectal cancer.CCCCCLean meats and poultry, fish, eggs, tofu, nuts and seeds and legumes/beansConsumption of red meat one to six times per week (or an intake range of 14–70 g/ 1,000 calories/d) is notassociated with risk of bladder cancer.Consumption of red meat, irrespective of frequency or serve size, is not associated with risk of prostate cancerConsumption of 30–200g of red meat per day is not associated with risk of pancreatic cancer.Consumption of at least one serve of fish a week is not associated with reduced risk of depression.Consumption of eggs daily is not associated with increased risk of coronary heart disease.Consumption of nuts (65–110g / day) does not lead to weight gain in the short-term.CCCCCC124EAT FOR HEALTH – australian dietary guidelinesNational <strong>Health</strong> and Medical Research Council
Evidence statementGradeMilk, yoghurt, cheese and/or alternativesConsuming dairy food is not associated with risk of endometrial cancer.Consumption of dairy foods is not associated with weight change or risk of obesity.Consumption of milk is not associated with BMI or BMI change in childhood.Mean consumption of one serve of dairy food per day is not associated with the risk of breast cancer.Consumption of less than one serve of milk per day during adult life is not associated with risk of osteoporoticor hip fracture.CCCCCWaterConsumption of black tea is not associated with risk of cardiovascular disease.Consumption of coffee is not associated with risk of coronary heart disease.Consumption of coffee is not associated with risk of breast cancer.Consumption of coffee is not associated with risk of colorectal cancer.Consumption of coffee is not associated with risk of ovarian cancer.Consumption of green or black tea is not associated with risk of ovarian cancer.Consumption of green or black tea is not associated with risk of colorectal cancer.CCCCCCCE2Grade D evidence statements that did not inform these <strong>Guidelines</strong>In the systematic literature review (Evidence Report), a number of food, diet, and health relationships wereexamined for which the evidence of an association was Grade D. This was because the evidence was limited,inconclusive or contradictory. These Grade D relationships were not used to inform the development of theAustralian <strong>Dietary</strong> <strong>Guidelines</strong>. Table E2 provides a list of the evidence statements for these relationships.Grade D evidence can inform health professionals about the strength of evidence from recent research, particularlyin emerging areas, and help identify areas where further research on dietary patterns and health outcomes maybe required. Grade D evidence can also assist health professionals correct diet related misconceptions among thegeneral population. <strong>For</strong> example, members of the general population may be inclined to alter their dietary patternswhen the results of a new study are widely publicised in the media.This evidence, while useful as mentioned above, was not used in the development of Guideline statements.Table E2: Evidence statements (Grade D) that did not inform the Australian <strong>Dietary</strong> <strong>Guidelines</strong>Evidence statementGradeVegetablesThe effect of total vegetable consumption on gastric (stomach) cancer is inconclusive (Evidence Report, Section 2.5).The effect of total vegetable consumption on the risk of breast cancer is inconclusive (Evidence Report, Section 2.6).The effect of total vegetable consumption on the risk of colorectal cancer is inconclusive (Evidence Report,Section 2.8).The effect of total vegetable consumption on the risk of lung cancer is inconclusive (Evidence Report, Section 2.7).DDDDAppendicesNational <strong>Health</strong> and Medical Research Council125
Evidence statementGradeFruitThe effect of fruit consumption on the risk of oesophageal cancer is inconclusive (Evidence Report, Section 1.9).The effect of fruit consumption on the risk of gastric cancer is inconclusive (Evidence Report, Section 1.5).There is limited evidence that fruit consumption reduces the risk of lung cancer (Evidence Report, Section 1.7).The effect of citrus fruit consumption on the risk of pancreatic cancer is inconclusive (Evidence Report, Section 1.13).DDDDGrain (cereal) foodsThe effect of grain (cereal) consumption on the risk of cancer is inconclusive (Evidence Report, Section 6.1).DLean meats and poultry, fish, eggs, tofu, nuts and seeds and legumes/beansThe consumption of unprocessed red meat is associated with an increased risk of lung cancer (Evidence Report,Section 4.5).There is limited evidence showing no association between the consumption of red meat and the risk of breast cancer(Evidence Report, Section 4.4).The effect of consuming poultry at least once a week on the risk of breast cancer is inconclusive (Evidence Report,Section 10.1).The effect of consuming poultry at least once a week on the risk of colorectal cancer is inconclusive (EvidenceReport, Section 10.2).The effect of fish consumption on the risk of breast cancer is inconclusive (Evidence Report, Section 9.6).The effect of fish consumption on the risk of colorectal cancer is inconclusive (Evidence Report, Section 9.7).The effect of fish consumption on the risk of prostate cancer is inconclusive (Evidence Report, Section 9.8).The effect of fish consumption on the risk of renal cell cancer is inconclusive (Evidence Report, Section 9.9).The effect of egg consumption on the risk of cancer is inconclusive (Evidence Report, Section 11.2).Consumption of legumes (especially soy foods) is associated with a reduced risk of breast cancer (Evidence Report,Section 7.1).There is unlikely to be a significant protective effect against prostate cancer from consuming soy foods (EvidenceReport, Section 7.2).DDDDDDDDDDDMilk, yoghurt, cheese and/or alternativesThe effect of milk consumption on the risk of prostate cancer is inconclusive (Evidence Report, Section 5.14).DWaterThe effect of coffee consumption on the risk of increased systolic blood pressure is inconclusive (Evidence Report,Section 15.14).The effect of consuming four cups of coffee a day on the risk of gastric cancer is inconclusive (Evidence Report,Section 15.5).Green and black tea consumption is not associated with an increased risk of breast cancer (Evidence Report, Sections15.16, 15.17 and 15.22).Consumption of coffee is associated with increased risk of bladder cancer (Evidence Report, Section 15.10).Consumption of coffee is associated with increased risk of lung cancer (Evidence Report, Section 15.12).DDDDD126EAT FOR HEALTH – australian dietary guidelinesNational <strong>Health</strong> and Medical Research Council
Appendix FEvidence gradings used in the World Cancer ResearchFund reportBelow are excerpts on the evidence presented in the WCRF report; Food, nutrition, physical activity and theprevention of cancer: A global perspective.43 Further information is available at www.dietandcancerreport.org/.THE WCRF criteria for grading evidence are as follows.ConvincingThese criteria are for evidence strong enough to support a judgement of a convincing causal relationship,which justifies goals and recommendations designed to reduce the incidence of cancer.A convincing relationship should be robust enough to be highly unlikely to be modified in the foreseeable futureas new evidence accumulates. All of the following were generally required.• Evidence from more than one study type.• Evidence from at least two independent cohort studies.• No substantial unexplained heterogeneity within or between study types or in different populations relatingto the presence or absence of an association, or direction of effect.• Good quality studies to exclude with confidence the possibility that the observed association results fromrandom or systematic error, including confounding, measurement error, and selection bias.• Presence of a plausible biological gradient (‘dose response’) in the association. Such a gradient need notbe linear or even in the same direction across the different levels of exposure, so long as this can beexplained plausibly.• Strong and plausible experimental evidence, either from human studies or relevant animal models, thattypical human exposures can lead to relevant cancer outcomes.ProbableThese criteria are for evidence strong enough to support a judgement of a probable causal relationship, whichwould generally justify goals and recommendations designed to reduce the incidence of cancer.All the following were generally required.• Evidence from at least two independent cohort studies, or at least five case control studies.• No substantial unexplained heterogeneity between or within study types in the presence or absence of anassociation, or direction of effect.• Good quality studies to exclude with confidence the possibility that the observed association results fromrandom or systematic error, including confounding, measurement error, and selection bias.• Evidence for biological plausibility.Limited – suggestiveThese criteria are for evidence that is too limited to permit a probable or convincing causal judgement, but wherethere is evidence suggestive of a direction of effect. The evidence may have methodological flaws, or be limited inamount, but shows a generally consistent direction of effect. This almost always does not justify recommendationsdesigned to reduce the incidence of cancer. Any exceptions to this require special explicit justification.All the following were generally required.• Evidence from at least two independent cohort studies or at least five case control studies.• The direction of effect is generally consistent though some unexplained heterogeneity may be present.• Evidence for biological plausibility.AppendicesNational <strong>Health</strong> and Medical Research Council127
Limited – no conclusionEvidence is so limited that no firm conclusion can be made. This category represents an entry level, and isintended to allow any exposure for which there are sufficient data to warrant Panel consideration, but whereinsufficient evidence exists to permit a more definitive grading. This does not necessarily mean a limited quantityof evidence. A body of evidence for a particular exposure might be graded ‘limited – no conclusion’ for a numberof reasons. The evidence might be limited by the amount of evidence in terms of the number of studies available,by inconsistency of direction of effect, by poor quality of studies (e.g. lack of adjustment for known confounders),or by any combination of these factors.When an exposure is graded ‘limited – no conclusion’, this does not necessarily indicate that the Panel has judgedthat there is evidence of no relationship. With further good quality research, any exposure graded in this waymight in the future be shown to increase or decrease the risk of cancer. Where there is sufficient evidence to giveconfidence that an exposure is unlikely to have an effect on cancer risk, this exposure will be judged ‘substantialeffect on risk unlikely’.There are also many exposures for which there is such limited evidence that no judgement is possible. In thesecases, evidence is recorded in the full systematic literature review reports contained on the CD included with thisReport. However, such evidence is usually not included in the summaries and is not included in the matrices inthis printed Report.Substantial effect on risk unlikelyEvidence is strong enough to support a judgement that a particular food, nutrition, or physical activity exposureis unlikely to have a substantial causal relation to a cancer outcome. The evidence should be robust enough to beunlikely to be modified in the foreseeable future as new evidence accumulates.All of the following were generally required.• Evidence from more than one study type.• Evidence from at least two independent cohort studies.• Summary estimate of effect close to 1.0 for comparison of high versus low exposure categories.• No substantial unexplained heterogeneity within or between study types or in different populations.• Good quality studies to exclude, with confidence, the possibility that the absence of an observed associationresults from random or systematic error, including inadequate power, imprecision or error in exposuremeasurement, inadequate range of exposure, confounding, and selection bias.• Absence of a demonstrable biological gradient (‘dose response’).• Absence of strong and plausible experimental evidence, either from human studies or relevant animal models,that typical human exposures lead to relevant cancer outcomes.• Factors that might misleadingly imply an absence of effect include imprecision of the exposure assessment,an insufficient range of exposure in the study population, and inadequate statistical power. Defects in theseand other study design attributes might lead to a false conclusion of no effect.• The presence of a plausible, relevant biological mechanism does not necessarily rule out a judgement of‘substantial effect on risk unlikely’. But the presence of robust evidence from appropriate animal models orin humans that a specific mechanism exists, or that typical exposures can lead to cancer outcomes, arguesagainst such a judgement.• Because of the uncertainty inherent in concluding that an exposure has no effect on risk, the criteria usedto judge an exposure ‘substantial effect on risk unlikely’ are roughly equivalent to the criteria used with atleast a ‘probable’ level of confidence. Conclusions of ‘substantial effect on risk unlikely’ with a loweronfidence than this would not be helpful, and could overlap with judgements of ‘limited – suggestive’ or‘limited – no conclusion’.128EAT FOR HEALTH – australian dietary guidelinesNational <strong>Health</strong> and Medical Research Council
Special upgrading factorsThese are factors that form part of the assessment of the evidence that, when present, can upgrade the judgementreached. So an exposure that might be deemed a ‘limited – suggestive’ causal factor in the absence, say, of abiological gradient, might be upgraded to ‘probable’ in its presence. The application of these factors (listed below)requires judgement, and the way in which these judgements affect the final conclusion in the matrix are stated.• Presence of a plausible biological gradient (‘dose response’) in the association. Such a gradient need not be linearor even in the same direction across the different levels of exposure, so long as this can be explained plausibly.• A particularly large summary effect size (an odds ratio or relative risk of 2.0 or more, depending on the unit ofexposure) after appropriate control for confounders.• Evidence from randomised trials in humans.• Evidence from appropriately controlled experiments demonstrating one or more plausible and specificmechanisms actually operating in humans.• Robust and reproducible evidence from experimental studies in appropriate animal models showing thattypical human exposures can lead to relevant cancer outcomes.AppendicesNational <strong>Health</strong> and Medical Research Council129
Appendix GFood, nutrition and environmental sustainabilityG1Key messagesOverconsumption is unsustainable• Avoid overconsumption—Overconsumption of foods and drinks involves greater use of natural resources andputs more pressure on the environment, including increased disposal of waste food and packaging. 1040-1043• Maintain a healthy weight—It is estimated that an overweight population has a greater environmental impactthan a normal weight population because they have a higher food (energy) intake – 19% more food energy isrequired for a population with an obesity prevalence of 40% than for a population with an obesity prevalenceof 3%. 1044• Choose foods for health and sustainability—<strong>Dietary</strong> patterns in line with the recommendations in these<strong>Guidelines</strong> – eating nutrient-dense foods and limiting consumption of discretionary foods high in saturated fat,added sugars and added salt – provide health benefits and reduce the environmental impact associated withfoods. 153,1045,1046• Plan meals and shopping—Planning meals and food purchases and moderating the size of food portions canassist with avoiding overconsumption. Pre-shop planning, including checking cupboards, refrigerators andfreezers before shopping 1047 is economical and reduces food waste from spoilage. 1040,1046• Conserve water and energy—If individuals seek further advice on sustainable food preparation, healthprofessionals may encourage conserving water and the appropriate use and maintenance of energy-efficientappliances, and provide practical tips on reducing the use of natural resources when preparing foods (e.g. onlyusing the oven when more than one item requires this cooking method). 1047-1049Food wastage and food safetyStore foods appropriately—Decreasing food waste can substantially reduce the environmental impact of foodand has financial benefits for households. 1050,1051 Food wastage (not including packaging) accounts for about 10%of food purchased. 1052 The appropriate storage of foods avoids the unnecessary use and degradation of naturalresources. 1047Dispose of food waste appropriately—Most household food waste that enters landfills can be composted ormulched. The use of composting bins, worm farms or chicken runs promotes the recycling of nutrients backinto the home garden. 1040Keep food safely—Correct handling of food during all stages of its preparation and storage, including temperaturecontrol, is critical in ensuring food safety and preventing wastage. 1047 Most bacteria can multiply at temperaturesbetween 5°C and 60°C but a few pathogenic bacteria multiply at temperatures at or below 5ºC. 953 Date markingprovides a guide on the shelf life of food in terms of quality and safety: 943• use-by date indicates how long a food can be expected to remain safe, provided it has been stored accordingto any stated storage conditions and the package is unopened• best-before date indicates the length of time a food should keep before perceptible changes in quality occur.Select foods with appropriate packaging and recycle—Appropriate packaging protects food products throughtransit and storage, thereby reducing food waste. Packaging that is more than is required to preserve food andensure food safety places higher demands on natural resources. 1042,1047 Drinking tap water rather than bottledwater decreases production and disposal of plastic bottles. Choosing biodegradable or recyclable packagingreduces the amount of waste entering landfill.<strong>Eat</strong>ing seasonally<strong>Eat</strong> fruit and vegetables that are currently growing in the given climate—This can assist with lessening pressureon the food supply by potentially reducing processing, distribution and storage. 1040 However, consumers mayrequire advice from health professionals as to which fruits or vegetables are in season and also the challengesassociated with avoiding ‘year-round’ produce. 1053Focus on nutritional value—Some fruit and vegetables may look imperfect but are still nutritionally valuable. 1054130EAT FOR HEALTH – australian dietary guidelinesNational <strong>Health</strong> and Medical Research Council
G2BackgroundThese <strong>Guidelines</strong> have a firm evidence base and a primary focus on meeting population nutritional requirements,this appendix may assist health professionals to discuss the complex issue of food, nutrition and environmentalsustainability with interested individuals. The aim would be to encourage people to review their dietary patternswith a primary focus on improving their health, while allowing them to consider ways to reduce environmentalconsequences.The production and consumption of food has a range of environmental consequences. The food system includesinterdependent components that provide food for local consumption or export. 1040 It is a subset of the naturalenvironment, and depends on and impacts on biodiversity – in Australia and globally. 1051,1055 The food systemencompasses numerous environmental inputs such as land, water and energy during the many stages from‘paddock to plate’. The resultant outputs may include greenhouse gases, waste water, land deterioration,packaging and food waste. Figure G1 gives examples of environmental consequences within the food system.The concept of food consumption habits with lower environmental impact is not new but it is complex. 1056 In 2003,the joint Expert Panel of the World <strong>Health</strong> Organisation and the Food and Agricultural Organisation outlinedbasic recommendations for dietary patterns that are ‘not only healthier but more favourable to the environmentand sustainable development’. 1046 This integration of environment and health was also noted in the 2003 editionof the <strong>Dietary</strong> <strong>Guidelines</strong> for Australian Adults. 36 Since then, the body of evidence relating to the multifacetedrelationship between food systems, sustainability and health has increased but there are still many gaps in ourunderstanding of what this means within the Australian context.In Australia, the Prime Minister’s Science, Engineering and Innovation Council’s 2010 report into food securityemphasised the need to balance the imperative of feeding a growing population with maintaining environmentalintegrity. 1057 However, in easing the pressure on the food system, it is also important to balance nutritionalrequirements for health and the prevention of chronic disease. 97 This highlights the complex challenge faced byhealth professionals, where recommended dietary patterns that meet nutritional needs must also be sustainable— that is, equitable, affordable and considerate of environmental factors. 1042,1056,1058Fostering a sustainable, globally competitive, resilient food supply that supports access to nutritious and affordablefood is the primary aim of the National Food Plan. 1059 Appropriately, health should be considered in sustainablefood systems, where the nutritional requirements of the population can be met without placing pressure onnatural resources. 97,1040,1042,1056 A range of concurrent approaches are required to achieve this, relating primarily tofood production and food consumption.AppendicesNational <strong>Health</strong> and Medical Research Council131
Figure G1: Examples of environmental consequences within the food systemPRIMARY PRODUCTION(agriculture and aquaculture)soil loss; polluted runoff; greenhousegases; waste water; organic wastes;habitat lossIMPACTWASTEMANAGEMENTlandfi ll; biofi ll;greenhouse gases;waste water;habitat loss;air emissionsIMPACTTRANSPORTATION land use; soil;water; animal feed;hormones;pesticides;INPUTTRANSPORTATION herbicides; energyINPUTland; soil; waste;water; packaging;organic wasteFoodSystemTRANSPORTATION water; energy;cleaning chemicals;preservative;additives;refrigerants; paper;cardboard; plastics;glass; metalINPUTIMPACTTRANSPORTATION PROCESSINGANDPACKAGINGwaste water; foodresidues; solidwastes; greenhousegases; air emissionswater; refrigerants;energy; packagingCONSUMPTIONwaste water;greenhouse gases;air emission;solid wastesIMPACTINPUTTRANSPORTATION INPUTwater; refrigerants;energy; packagingTRANSPORTATION INPUTenergy;refrigerants;packagingIMPACTRETAIL ANDDISTRIBUTIONgreenhouse gases;air emissions;solid wastesIMPACTCATERING AND FOOD SERVICESwaste water; greenhouse gases;air emissions; solid wastes• Public health• Food policy• Trade policyDrivers• Consumer attitudes• Urbanisation• Socioeconomic status• Technology• Market liberalisation• Cultural trends132EAT FOR HEALTH – australian dietary guidelinesNational <strong>Health</strong> and Medical Research Council
G3Complexities of measuring the sustainability of the food supplyHistorically, dietary guidance has been based on experimental evidence from nutritional science and epidemiology,with sustainability often referred to in the context of ‘triple bottom line’ considerations of economic, social andenvironmental factors. 1058 Understanding the environmental implications of food choices involves consideringnew, often non-empirical evidence drawn from assessment of the relationship between the food system, foodchoices and environmental outcomes. This requires evidence from research in environmental science, agriculturalscience and economics. Government reports are also useful, especially in areas with policy implications, such ascarbon accounting.The food system comprises many stages from inputs on-farm to waste management following consumer use.As shown in Figure G1, these include agriculture and aquaculture, processing, manufacturing, transport, retail,preparation, consumption and waste management. The complexity of the system challenges the developmentof standardised methodologies for measuring the environmental consequences of producing particular foods. 1060As well, some current analyses do not consider the process through to the consumer and the subsequentdisposal of waste.The environmental consequences of food production depend on the agricultural system used and the particularenvironmental aspect examined, as these differ in impact, with implications for yield, quality and affordability. 1042Given this, the consequences cannot be assessed solely on a commodity basis but are dependent on whereand how the product is grown. <strong>For</strong> example, it is estimated that in NSW, the amount of water used in beef cattleproduction ranges broadly from 3.3 L to 221 L H2Oe kg −1 live weight at farm gate. 1061 As well, it is importantto ensure that focussing on one outcome (e.g. emissions) does not have an unfavourable effect on another(e.g. soil degradation) and consequently add further pressure to the food system.New technologies will play an important role in developing sustainable food systems, but the extent dependson consumer acceptance and economic constraints. 1040 There is a need for more Australian data on manycomponents of the food system and further research and development is required.Two methodologies – process life cycle analysis (Process-LCA) and input-output analysis – are increasinglyused to critically analyse the environmental impact of various components of the food system:• Process-LCA considers the environmental impact of all processes involved in bringing a product to theconsumer, including the way it is used and the impact of disposing packaging and waste. LCA methodologiesare highly standardised, however the complexity of analysing sustainability at the food supply level means thatmany different questions are asked and models used which can limit meaningful comparisons. 1060 Additionally,to obtain an overall perspective, the same process must be completed across the entire life cycle. LCAmethodologies are complex, time consuming and expensive, which inhibits their use for data collection.• Input-output modelling is a useful tool for assessing the environmental impact of consumption. It was originallydeveloped for economic analysis, but has been applied to environmental analysis since the late 1960s.It can be used to assess environmental indicators such as land disturbance, water and energy use, and totalindicator intensities (the total amount of an indicator required to produce and deliver a value unit of a particularcommodity). 1062 This can be used in decision making to predict and forecast the impact of future performanceof an economy and the effect of changes to relevant systems.In developing an evidence-base for sustainable food choices, different methodological approaches limit thecomparability of findings. <strong>For</strong> example, scope and definitions vary according to the stage of the food system beingconsidered. Some studies incorporate the environmental impact of manufacturing on-farm machinery and theproduction of all other on-farm inputs such as fertiliser, while others include only fertiliser production. Much of theenvironmental impact evidence for specific foods is based on primary production and on-farm effects, with lessinformation on aspects of the food supply chain such as processing, distribution, retail, consumption and wastemanagement. However, the environmental impact of the life cycle of a particular food cannot be considered only asa characteristic of the food, but of all the specific and local aspects of its production, movement, storage, preparationand ultimate fate.While overseas studies are not always generalisable to the Australian context, the body of Australian evidenceis steadily growing, and the interest in this field may serve to stimulate more research. Despite the abovechallenges, enough evidence exists to suggest pragmatic guiding principles on how dietary patterns and homepractices can contribute to reducing the environmental consequences of the food system.AppendicesNational <strong>Health</strong> and Medical Research Council133
G4Australia’s progress toward a sustainable food systemA systems approach to food consumption enables consideration of the many factors involved in getting foodfrom farm to consumer, as well as the implications for health. In recognition of the complex relationship betweensustainable food production and consumption, improved environmental practices are being applied to existingcomponents of the food system. These initiatives mainly focus on resource efficiencies (e.g. reducing energy,water and land usage). However, as previously mentioned, this involves interaction and consideration for theentire food supply to ensure any changes are not counterproductive for other areas. 1040Consumers and producers are the primary drivers for the direction of the food system. With increasing consumerdemand for sustainably produced foods, many producers are changing what they produce and how they produceit. 1040 These changes are generally well supported by industry, with many implementing initiatives that encouragesustainable production practices. 1063-1065 Industry is also responsible for funding much of the current researchin this area, with millions of dollars invested annually into research and development activities leading to moresustainable practices while also ensuring economic and social viability.The Australian and other governments are also active participants in planning for and managing a sustainable foodsystem. Australia is committed to reducing threats to biodiversity, through nationally agreed strategies such asAustralia’s Biodiversity Conservation Strategy 2010-2030 and through internationally agreed conventions such asthe United Nations’ Convention on Biological Diversity. 1066 These impacts on biodiversity are key to any approachto sustainable food consumption because conserving biodiversity is an essential part of safeguarding the Earth’sbiological support systems. 1056,1066Relevant state, territory and national departments are also promoting policies, programs and regulations thatfoster and support ecologically sustainable development both broadly and at the food system level. 1059,1067,1068However, there is room for improvement. Strengthening these arrangements through the development of theNational Food Plan will help Australia’s food system respond to new opportunities and challenges. 1059As the planning and management of a sustainable food system progresses at government and industry levels,it will be important to link the strong evidence on health and nutrition with the accruing evidence on theenvironmentally sustainable attributes of food consumption habits.G5Sustainability and food consumption<strong>Health</strong>, food choices and environmental consequences can all be influenced by behaviour change. Changingfood consumption habits can influence demand on the food system and consequently the pressure on naturalresources and biodiversity. 1042,1056,1059 Discussing sustainability in the context of consumption habits not onlyhas the potential to improve population health but also supports the objective of achieving a sustainable foodsupply with improved food security. 1042,1056,1059 While the current evidence is not yet strong enough to makerecommendations about specific foods in terms of ‘more sustainable choices’, it is suggested that food intakethat is aligned with better health outcomes, has a lower environmental impact overall compared to most currentwestern diets. 1042,1046,1056,1070-1073 The nutrient composition of foods is important and people should be encouragedto consume a wide variety of foods from the Five Food Groups to not only meet the nutrients required for healthand wellbeing but also contribute to better environmental outcomes. 8,1056Consumers can contribute to sustainability efforts through the dietary patterns they choose to follow. 1056 As thewealth of our nation has increased and the availability of food has shifted, the foods produced have also changedto meet consumer preferences. 1056,1058 This has resulted in a move toward greater consumption of processed foodsthat are high in saturated fat, added sugars and added salt. 1041,1046 It is suggested that changing consumer foodchoices can make a bigger difference to overall household sustainability than reducing water and energy use. 1040Therefore, avoiding overconsumption of food and food wastage should form the primary areas of focus by healthprofessionals in communicating sustainable food consumption habits. 1056Concerns about, and interest in, both health and the environment will continue to shape our dietary patterns.The practical considerations in G1 aimed at improving sustainability are easily aligned with the recommendationsin these <strong>Guidelines</strong> as they aim for people to eat only to their nutritional requirements.134EAT FOR HEALTH – australian dietary guidelinesNational <strong>Health</strong> and Medical Research Council
Appendix HAssessing growth and healthy weight in infants, childrenand adolescents, and healthy weight in adultsH1Assessing growth and healthy weight in infants, children and adolescentsMeasuring and recording the growth of infants and young children has been standard practice in Australia fordecades. Growth monitoring remains the best method of assessing nutritional status and overall health at thecommunity and primary care level.Measuring height and weight regularly is important. The most practical measures of growth status in childhoodare comparisons with standard growth charts that show the normal ranges of height for age, weight for age andBMI, by sex as well as length for age and head circumference for age for infants aged 0–2 years. As growth is adynamic process, several measurements are preferable when assessing infants and children. When only a singlemeasurement of weight and/or height is available, care is needed in interpretation.There are several widely accepted and practical tools available for assessment. The options are:• BMI using international reference standards (the International Obesity Task <strong>For</strong>ce [IOTF] criteria) 122• 2000 US Centers for Disease Control and Prevention (CDC) BMI curves (also recommended by WHObefore 2006) 1074• WHO growth charts. 1075-1077The differences between these options have been reviewed. 1078Growth charts are not intended to be diagnostic but to contribute to the overall clinical impression of thechild being measured. Generally, irrespective of the reference or standard used, if a child is growing normally,growth approximately follows one of the lines on the chart. The growth trajectory may increase or decrease inadolescence dependent upon timing of the adolescent growth spurt.If the line of growth crosses a number of percentile lines or tends towards or crosses the 10 th or 90 th percentiles,the advice of health professionals should be sought. 351 In the first months of life it is normal for 5% of thepopulation to fall below the 5 th percentile, and this does not always indicate a problem. 351Care should always be taken when both measuring and plotting growth patterns to minimise error associatedwith poor measurement technique or error in plotting.It is important to note that the use of different methods of assessing overweight or obesity will give different results,so results cannot be directly compared. <strong>For</strong> that reason it is essential to state the criteria used when assessing theweight of an individual or population. This also applies for underweight, stunting or wasting level in a population.In Australia, the 2006 WHO BMI charts and the 2000 US CDC charts are commonly used.WHO growth chartsThe WHO has developed and uses growth reference charts for: 1041-1043• infants aged 0–2 years• children from birth to age 5 years• children from age 5–10 years• children and adolescents aged 5–19 years.<strong>For</strong> children younger than 5 years, tables and charts showing percentiles and Z-scores for BMI-for-age, weight-forage,weight-for-length and head circumference were published in 2006.Overweight is defined as two standard deviations above normal on the weight-for-height chart and underweight isdefined as weight-for-age two standard deviations below normal. 1076 <strong>For</strong> children and adolescents aged 5–19 years,tables and charts showing percentiles and Z-scores for BMI-for-age, height-for-age, and weight-for-age werepublished in 2007. The BMI Z-score-for-age chart defines overweight as greater than one standard deviationabove normal, obesity as greater than two standard deviations above normal, thinness as more than twostandard deviations below normal, and severe thinness as more than three standard deviations below normal. 1075AppendicesNational <strong>Health</strong> and Medical Research Council135
It is suggested that by 2011, 125 countries representing 75% of the world’s under–5 population had adopted theWHO growth standards and were at varying stages of implementation. 1079 This includes the US, Canada, UK andNew Zealand. The WHO growth standards for 0–19 years were implemented in the Northern Territory in 2009 andVictoria implemented WHO charts for 0–2 years in 2011. In 2012, all Australian jurisdictions agreed to adopt the WHO2006 growth charts as the standard for Australian children aged 0–2 years. They will be phased in by other states andterritories for use at the primary health care level in child health records. Education and training materials to assistAustralian health professionals in using the WHO Charts are being developed and will become available in 2013.Other specialised growth charts may still be used by clinicians for groups with particular needs or characteristics.Care should be taken to consider the differences between charts when assessing the growth of infants. The newWHO growth standards (2006) are heavier than the CDC 2000 growth reference in the first 6 months of life butlighter after 6 months.Table H1: Practical points in the use of growth reference charts in infants aged 0–2 years• <strong>Health</strong> professionals should use a growth reference chart appropriate to the age and sex of the infant or child and be aware whichchart they are using• In using the WHO growth reference charts, it is important to note that the 2 nd percentile corresponds approximately to the 5 th percentileon the CDC growth chart for infants under 6 months and that lower positions on the growth reference chart are acceptable• In determining whether breast milk production or infant formula consumption is adequate (or for infants fed formula the amount isexcessive), growth trajectory is more important than position on the growth reference chartCDC BMI curvesIn Australia, the NHMRC Overweight and Obesity <strong>Guidelines</strong> 121 suggest the use of the US CDC growth charts 1046for monitoring growth in children and adolescents aged 2–18 years. 35,1081 Overweight is categorised as betweenthe 85 th and 95 th percentiles in the BMI charts and obesity as above the 95 th percentile.However, use of the CDC charts has been criticised as they are based on US data only, from five national surveysundertaken between 1963 and 1994, the most recent being NHANES 111. The age- and sex-specific CDC growthcharts were last updated in 2000, and do not include weight data (and thus BMI data) from NHANES 111 fromchildren over 6 years of age.BMI using international reference standardsBMI measurement is a low-cost, simple method that has been validated against more direct measures of adiposity. 1082In 1999 an expert committee, on behalf of the IOTF, recommended that BMI be used to assess adiposity in childrenand adolescents and that the adult cut-off points be used as a reference. 1083,1084 However, normal BMI among childrenand adolescents changes with age, so choosing a single cut-off number is not possible.Following on from this recommendation, an international reference for defining overweight and obesity in childrenand adolescents was developed with data from six countries, and provide age- and sex-specific BMI cut-off pointsfor children and adolescents aged 2–18 years that correspond to adult BMI values of 25 kg/m 2 for overweight and30 kg/m 2 for obesity. 122 Designed for epidemiological use, the tables will allow international comparison of theprevalence of overweight and obesity, as well as assessment of trends in children. 1074,1085-1087Other measurementsWaist circumference and waist:height ratio are becoming more common measures of child, adolescent andadult central adiposity, but there is little consensus regarding standard cut-off values to define overweightand obesity. 130,1088-1093 A waist:height ratio equal to or less than half (ratio ≤ 0.5) may be useful in predictingcardiovascular risk in children. 1094-1097Skinfold measurement – an index of subcutaneous adipose tissue – is another method of defining of under- orover-nutrition. 1098 Reliable and accurate measurements depend to a large extent on the use of trained operatorsand properly calibrated instruments.Other methods of body composition assessment, for example dual energy X-ray absorptiometry, can provideaccurate measurements, but cost limits their application to experimental use and to clinical settings where moreaccurate diagnosis is required for management. 1099 The most accurate measure of body composition is providedby using doubly labelled water, but cost limits its use to research.136EAT FOR HEALTH – australian dietary guidelinesNational <strong>Health</strong> and Medical Research Council
Z-scores and percentiles: Converting between measuresWhile percentiles are most commonly used in Australia, in some situations, particularly for research, it is moreappropriate to use the Z-scores (standard deviations above or below the mean). The conversion of percentiles toZ-scores requires a table of normal distributions. The 50 th percentile is a Z score of 0, the 90 th percentile is +1.28,and 10 th percentile is –1.28. Growth charts are available in both formats and a calculator is available on the US CDCwebsite. 1080 BMI can be converted into a BMI Z-score using a BMI-for-age growth chart and the formula: Z-score =((BMI/M)L-1)/(LS), where M, L, and S are values selected from reference tables corresponding to the age of thechild in months. 35Differences between IOTF criteria and the new WHO growth standardThe IOTF uses cut-off points based on WHO adult BMI but extrapolated for use in children based on six internationaldata sets. In comparison, the WHO growth standards are a standard rather than a reference. The standard is howchildren should grow as opposed to a reference which describes how they grew at a particular time and place.The WHO growth standards reflect the growth of children who were predominantly breastfed for the first4–6 months of life and were breastfed until 12 months of age. In addition, the data for babies was taken fromthose who were single, term births and those whose mothers did not smoke. There are major differences inthe percentage of children classified as obese or overweight according to the reference used, ranging from5% to 25% in a study of 3-year old children. 1078 The study concluded that ‘the IOTF reference and cut-offs couldbe preferable for the identification of overweight and obesity both at individual and population levels becausethey are at least based on a crude association with ill health later in life, namely the definition of overweight andobesity at age 18 years’. 1078H2How is healthy weight measured in adults?<strong>For</strong> adults, the standard WHO BMI cut-off points are most commonly used for assessment of obesity. BMI isused to define weight status in adults (except older adults) as follows.Table H2: WHO body mass index classificationClassification (WHO) BMI (kg/m 2 )Underweight < 18.5<strong>Health</strong>y weight 18.5 – 24.9Overweight 25.0 – 29.9Obese class I 30.0 – 34.9Obese class II 35.0 – 39.9Obese class III > 40.0However, this classification may not be suitable for all population groups: 118,119• some groups may have equivalent levels of risk at a lower BMI (e.g. people of Asian origin) or higher BMI(e.g. people of Polynesian origin including Torres Strait Islanders and Mãori) 120• while specific BMI ranges have not been developed, Aboriginal people have a relatively high limb to trunk ratioand may have equivalent levels of risk at a lower BMI• a higher BMI range may be desirable for people aged over 70 years.It is important to measure weight and height accurately to assess overweight and obesity, as self-reported data isusually inaccurate.Waist circumference is increasingly being used assessing risk of chronic disease in adults, and provides a betterestimate of risk than BMI. 1100,1101 Risk is increased at ≥80 cm and high at ≥88 cm for women and increased at≥94 cm and high at ≥102 cm for men. 121,169 As with BMI, thresholds for other ethnic groups may differ from thosefor people of European descent.AppendicesNational <strong>Health</strong> and Medical Research Council137
Appendix IPhysical activity guidelinesAustralia’s physical activity guidelines outline the minimum levels of physical activity required to gain a healthbenefit and identify ways to incorporate physical activity into everyday life. Below are excerpts from physicalactivity guidelines developed and published in 2010 by the Australian Department of <strong>Health</strong> and Ageing. 298A review of Australia’s physical activity guidelines will be completed in 2013. Refer to www.health.gov.au for moreinformation on current physical activity guidelines.Physical activity recommendations for children 0–5 yearsThe recommendations for children aged 0–5 years state that being physically active every day is important forthe healthy growth and development of infants, toddlers and preschoolers. 298<strong>For</strong> infants (0–1 year) physical activity – particularly supervised floor-based play in safe environments—should beencouraged from birth.• Before infants begin to crawl, encourage them to be physically active by reaching and grasping, pulling andpushing, moving their head, body and limbs during daily routines and supervised floor play, including tummytime. Once infants are mobile, encourage them to be as active as possible in a safe, supervised and nurturingplay environment.Toddlers (1–3 years) and preschoolers (3–5 years) should be physically active every day for at least 3 hours,spread throughout the day.• Young children don’t need to do their 3 hours of physical activity all at once. It can be accumulated throughoutthe day and can include light activity like standing up, moving around and playing as well as more vigorousactivity like running and jumping. Active play is the best way for young children to be physically active.Children younger than 2 years of age should not spend any time watching television or using other electronicmedia (DVDs, computer and other electronic games). <strong>For</strong> children 2–5 years of age, these activities should belimited to less than 1 hour per day.• Television, DVDs and playing computer games usually involve sitting for long periods – time that could bespent playing active games or interacting with others.Infants, toddlers and preschoolers should not be sedentary, restrained, or kept inactive, for more than 1 hour ata time, with the exception of sleeping.• All children need some ‘down time’ but they are not naturally inactive for long periods of time. Sitting instrollers, highchairs and car seats (restrained) for long periods isn’t good for children’s health and development.Try to take regular breaks on long car trips and walk or pedal for short trips when you can.While meeting these recommendations may seem like a challenge at times, a brochure that includes tips andideas to help you include more activity in your child’s day and further information on the recommendations isavailable on the Department of <strong>Health</strong> and Ageing website. 1102Physical activity recommendations for 5–12 year oldsThe recommendations for children aged 5–12 years 298 recommend that children need at least 60 minutes(and up to several hours) of moderate to vigorous physical activity every day.Examples of moderate activities are a brisk walk, a bike ride or any sort of active play. More vigorous activitiesto make kids ‘huff and puff’ include organised sports such as football and netball, as well as ballet, running andswimming laps. Children typically accumulate activity in intermittent bursts ranging from a few seconds to severalminutes, so any sort of active play will usually include some vigorous activity. Most importantly, kids need theopportunity to participate in a variety of fun activities that suit their interests, skills and abilities. Variety will alsooffer your child a range of health benefits, experiences and challenges.Children shouldn’t spend more than 2 hours a day using electronic media for entertainment (e.g. computergames, TV, internet), particularly during daylight hours.138EAT FOR HEALTH – australian dietary guidelinesNational <strong>Health</strong> and Medical Research Council
Physical activity recommendations for 12–18 year oldsThe recommendations for children aged 12–18 years 298 state that:• at least 60 minutes of physical activity every day is recommended – this can build up throughout the day witha variety of activities• physical activity should be done at moderate to vigorous intensity• for additional health benefits, try to include 20 minutes or more of vigorous activity that causes young peopleto ‘huff and puff at least 3–4 days a week• children shouldn’t spend more than 2 hours a day using electronic media for entertainment (computer games,TV, internet), particularly during daylight hours.Suggested activities include:• moderate activities like brisk walking, bike riding with friends skateboarding and dancing, walking the dog,replacing short car trips with a walk or bike ride• vigorous activities such as football, netball, soccer, running, swimming laps or training for sport• trying to be active in as many ways as possible – variety is important in providing a range of fun experiencesand challenges and provides an opportunity to learn new skills.Physical activity guidelines for Australian adultsThe guidelines for adults 298 make the following recommendations.• Think of movement as an opportunity, not an inconvenience.• Be active every day in as many ways as possible.• Put together at least 30 minutes of moderate-intensity physical activity on most, preferably all, days.• If possible, also enjoy some regular vigorous exercise for extra health and fitness.Moderate-intensity activity will cause a slight, but noticeable, increase in your breathing and heart rate. A goodexample of moderate-intensity activity is brisk walking, that is at a pace where you are able to comfortably talkbut not sing. Other examples include mowing the lawn, digging in the garden, or medium paced swimmingor cycling. The guidelines note that the recommended 30 minutes (or more) of moderate intensity physicalactivity throughout the day, may be accumulated by combining short bouts of around 10 to 15 minutes each.These accumulated short bouts of physical activity are as effective as continuous activity at improving indicatorsof health such as hypertension and blood cholesterol. 1103 However, this level of activity appears to be insufficientfor preventing weight gain or weight loss or weight regain in most people. 276,1104Physical activity recommendations for older AustraliansThe recommendations for older Australians 298 indicate that it is never too late to become physically active and tofeel the associated benefits. Most physical activities can be adjusted to accommodate older people with a rangeof abilities and health problems, including those living in residential care facilities.There are five physical activity recommendations for older Australians.• Older people should do some form of physical activity, no matter what their age, weight, health problems orabilities.• Older people should be active every day in as many ways as possible, doing a range of physical activities thatincorporate fitness, strength, balance and flexibility.• Older people should accumulate at least 30 minutes of moderate-intensity physical activity on most –preferably all – days.• Older people who have stopped physical activity, or who are starting a new physical activity, should start at alevel that is easily manageable and gradually build up the recommended amount, type and frequency of activity.• Older people who have enjoyed a lifetime of vigorous physical activity should carry on doing so in a mannersuited to their capability into later life, provided recommended safety procedures and guidelines are adhered to.AppendicesNational <strong>Health</strong> and Medical Research Council139
Appendix JStudies examining the health effects of intake of fruit andvegetables togetherThe literature includes studies that have investigated the effect of consumption of fruit and vegetables together.This evidence clearly confirms the positive health effects of consuming vegetables and fruits, particularly inreducing the risk of cardiovascular disease, but also in reducing risk of obesity and some cancers. It is compiledas an Appendix to aid the conciseness of Chapter 2.Cardiovascular disease, type 2 diabetes and excess weightThere is evidence regarding a probable association between the consumption of each additional daily serve of fruitand vegetables and reduced risk of coronary heart disease (Grade B; Evidence Report, Section 3.1). 362-364,367,1105Similarly, recent evidence supports a probable association between consumption of each additional daily serve offruit and vegetables and a reduced risk of stroke (Grade B; Evidence Report, Section 3.2). 362,363 Consuming morethan five serves of fruit and vegetables a day was found to reduce the risk of stroke by 26% (fruit serve was 80g andvegetables 77 g), 363 and consuming each additional serve of fruit and vegetables (of average serve size 106 g) reducedthe risk of stroke by 5%. 362 These results are consistent with those presented in the literature reviews to inform therecent review of the <strong>Dietary</strong> <strong>Guidelines</strong> for Americans, 2010 which found that ‘consistent evidence suggests at leasta moderate inverse relationship between vegetable and fruit consumption with myocardial infarction and stroke, withsignificantly larger, positive effects noted above five serves of vegetables and fruits per day’. 198In the literature reviews to inform the revision of the <strong>Dietary</strong> <strong>Guidelines</strong> for Americans, 2010, the evidence for anassociation between increased fruit and vegetable intake and reduced risk of excess body weight was found to bemodest, with a trend towards decreased weight gain over five or more years in middle adulthood associated withincreased fruit and vegetable intake. However no conclusions could be drawn from the evidence of efficacy ofincreased fruit and vegetable consumption in weight loss diets. 198 In children and adolescents, the limited body ofevidence from longitudinal studies suggested that greater intakes of fruits and/or vegetables may protect againstincreased adiposity. 198CancerLung cancer: The recent body of evidence suggests that consumption of fruit and vegetables is associated withreduced risk of lung cancer (Grade C; Evidence Report, Section 3.5). 1106-1108Colorectal cancer: Recent evidence suggests that there is no association between consumption of fruit andvegetables together and risk of colorectal cancer (Grade C; Evidence Report, Section 3.4). 389,410 In its 2008 report,the International Agency for Research on Cancer (IARC) also concluded that intakes of fruit and vegetables wereeither not associated or only slightly associated with risk of colorectal, breast and prostate cancer. 1109 However,recently published findings from the European Prospective Investigation into Cancer and Nutrition (EPIC) studysuggest that a high consumption of fruit and vegetables is associated with reduced risk of colorectal cancer,especially of colon cancer, but that the effect may also depend on smoking status. 1110Ovarian cancer: It is probable that there is no association between consumption of fruit and vegetables andrisk of ovarian cancer (Grade B; Evidence Report, Section 3.6). 384,385 A more recent meta-analysis has describedevidence of a probable inverse relationship between consumption of vegetables and fruit, and bladder cancer. 1111An insufficient number of studies were found to produce an evidence statement for an association between theconsumption of fruit and vegetables and renal cancer. 1112-1114Epithelial cancer: In general, comparison of the results of systematic reviews of the evidence on diet and cancersponsored by the WCRF in 1997 1115 and 2007 43 suggests weaker evidence of a protective effect of high intakesof fruits and vegetables against several common epithelial cancers, with a downgrading of the association from‘convincing’ to ‘probable’. This is also consistent with the evidence presented in the IARC report. 1116Overall cancer: Analyses of prospective studies have generally failed to demonstrate consistent evidence of aconvincing association between the intake of fruits and vegetables and overall risk of cancers. 1109 However themore recent EPIC cohort study found a weak but statistically significant inverse association between consumptionof fruit and vegetables and risk of overall cancers – a 4% lower incidence of all cancers combined for an incrementof 200g total fruit and vegetable intake per day. 1117140EAT FOR HEALTH – australian dietary guidelinesNational <strong>Health</strong> and Medical Research Council
It should also be noted that a very weak association between the consumption of fruit and vegetables as a wholeand overall cancer rates is not inconsistent with the evidence of the effects of fruit and vegetable consumption onsite-specific cancers, or the evidence that specific types of fruit or vegetables may have an effect, particularly onthe risk of site-specific cancers, and suggests that further specific studies are required, particularly those whichattempt to account for potential interactions between tobacco 1118 and alcohol. 419Other conditionsAlthough not sufficient to develop evidence statements, individual studies found an association between otherhealth conditions and consumption of fruit and vegetables. These include:• decreased risk of hypertension 1119• decreased risk of dementia 517• decreased risk of head and neck cancer 1120• decreased risk of various upper digestive tract cancers 45,877,1121-1123• decreased risk of prostate cancer 437,1124• decreased risk of obesity. 1125-1126Although not sufficient to develop evidence statements, individual studies found no evidence of an associationbetween consumption of fruit and vegetables and pancreatic cancer. 771,1127,1128AppendicesNational <strong>Health</strong> and Medical Research Council141
Appendix KAlcohol and energy intakeTable K1: Median percentage of contribution of alcohol to energy intake per consumerAge groups (years)16–18 19–24 25–44 45–64 ≥65≥19 andoverMale (%) 4.2 7.7 9.2 9.5 9.0 9.1Female (%) 4.9 9.0 8.4 7.5 7.4 8.1Source: National Nutrition Survey 1995. 48Table K2: Energy and alcohol content of common alcoholic drink servesDrink typeServe sizeEnergy (kJ/serve)Alcohol(g/serve)*StandarddrinkequivalentBeer, regular (4.5–4.9% alcohol) 1 can/stubby (375ml) 568 15.4 1½Beer, medium–light (3.7% alcohol) 1 can/stubby (375ml) 546 14.0 1Beer, light (2.1% alcohol) 1 can/stubby (375ml) 395 8.0 ½Wine (average of dry white and red) 1 glass (100ml # ) 340 – 395 9.5 1Spirits 1 nip (30ml) 255 8.8 1Pre-mixed spirits 1 can (375ml) 1182 13.9 1½Notes: * Using 1995 National Nutrition Survey data. 45#A glass of wine is usually more than 100ml, i.e. more than one standard drink (10g alcohol).142EAT FOR HEALTH – australian dietary guidelinesNational <strong>Health</strong> and Medical Research Council
GlossaryAdequate intake (AI): The average daily nutrient intake level based on observed or experimentally-determinedapproximations or estimates of nutrient intake by a group (or groups) of apparently healthy people that areassumed to be adequate. An AI is set when there is inadequate evidence to support setting a recommendeddaily intake (RDI).Adolescents: <strong>For</strong> the purposes of these <strong>Guidelines</strong>, an adolescent is someone aged 12–18 years. A markedincrease in the rate of growth and development during adolescence increases the need for most nutrientsincluding energy, protein, vitamins and minerals.Allium vegetables: Vegetables derived from a bulbous plant having an onion odour, including garlic, leeks,shallots, chives and onions.Anaemia: There are several forms of anaemia. Microcytic anaemia (referring to small red blood cells) is adeficiency of red blood cells or their haemoglobin, often, but not always, related to iron deficiency. Macrocyticanaemia (referring to large red blood cells) is prevalent in some groups (such as Aboriginal and Torres StraitIslander people) and may in some cases be associated with deficiencies of other nutrients, especially folateand vitamin B 12.Body mass: Body mass and body weight are often used interchangeably to describe the weight of a person’sbody.Body mass index (BMI): An index calculated by dividing the weight of an individual (in kilograms) by the squareof their height (in metres), BMI is a simple estimate of the body fatness of a human being who does not haveabnormal physical characteristics. The World <strong>Health</strong> Organization and the US National Institutes of <strong>Health</strong> haverecommended that an operational definition of overweight be a BMI of at least 25kg/m 2 and obesity as a BMIof at least 30kg/m 2 .A large number of anthropometric measurements and indices have been proposed for assessing and monitoringlevels of obesity. Methods used in research studies to measure the percentage of body fat are not practical forregular clinical and community use.Body weight: See body mass.Brassica vegetables: Vegetables from the Brassica or crucifer family, collectively known as cabbages or mustardsand including broccoli, cabbage and brussel sprouts.Breads: Refers to leavened and unleavened wholemeal, white, mixed-grain, rye and fruit breads, as well as rolls,bagels, English muffins, crispbreads, crumpets and low fat crackers.Carbohydrates: Carbohydrates are polyhydroxy aldehydes, ketones, alcohols, acids, their simple derivatives, andtheir polymers with linkages of the acetal type. They can be classified according to their degree of polymerisationand can be divided initially into three principal groups – sugars, oligosaccharides and polysaccharides.Carbohydrates are the least concentrated form of energy providing 17 kilojoules per gram.Cereals: See grain foods.Cereal fibre: Cereal fibre refers to dietary fibre obtained from core grain-based foods, including bread, breakfastcereals, rice and pasta.Children: <strong>For</strong> the purposes of these <strong>Guidelines</strong>, children are defined as toddlers aged 1–3 years, preschoolersaged 3–5 years and primary school age 6–11 years. It is important for children to receive a nutritious diet thatincludes all the nutrients they need to grow and develop normally.GlossaryNational <strong>Health</strong> and Medical Research Council143
Cholesterol: Cholesterol, chemically a sterol, occurs in all the cell membranes of land animals. Brains and eggyolks are very rich in cholesterol, oils and fats from plants never contain it. <strong>Eat</strong>ing cholesterol does not necessarilyincrease cholesterol in human blood plasma because when it is absorbed the liver tends to reduce its ownendogenous cholesterol synthesis. About half the body’s cholesterol is made in the body from acetate.Complementary foods: Any food – manufactured or locally prepared – that is suitable as a complement to breastmilk or infant formula when either becomes insufficient to satisfy an infant’s nutritional requirements.Complex carbohydrate: See starch.Core food groups: This was a concept of the previous modelling system and included foods that formed the basisof a healthy diet, based on or developed with reference to recommended daily intakes (RDIs).Cruciferous vegetables: See Brassica vegetables.Dairy food: See milks, yoghurts and cheeses.<strong>Dietary</strong> fibre: See fibre.Discretionary foods: This includes foods and drinks not necessary to provide the nutrients the body needs,but that may add variety. However, many of these are high in saturated fats, sugars, salt and/or alcohol, andare therefore described as energy dense. They can be included sometimes in small amounts by those who arephysically active, but are not a necessary part of the diet.Foods in this category include cakes, biscuits; confectionary, chocolate; pastries, pies; ice confections, butter,cream, and spreads which contain predominantly saturated fats; potato chips, crisps and other fatty or saltysnack foods; sugar-sweetened soft drinks and cordials, sports and energy drinks and alcoholic drinks.Eggs: Eggs are defined as containing a protective shell, albumen (egg white) and vitellus (egg yolk). Eggs areprotein-rich foods and in the <strong>Guidelines</strong> they are classified as a meat alternative.Estimated average requirement (EAR): A daily nutrient level estimated to meet the requirements of half thehealthy individuals in a particular life stage and gender group.Energy expenditure: Total daily energy expenditure includes energy expended in physical activity and restingenergy expenditure (basal metabolic rate plus necessary tissue repair and the thermic effect of food) over a24-hour period.Exclusive breastfeeding: Means an infant is receiving only breast milk, which includes expressed breast milkand milk from a wet nurse. The infant might also receive medications and vitamins or minerals as required.Fats: Most of the fats in foods are triglycerides, made up of a unit of glycerol (glycerine) combined with threefatty acids, which may be the same or different. Differences between fats are largely a consequence of the fattyacids they contain, which together make up 90% of the weight of the molecule. Fats in the diet can be ‘visible’ or‘invisible’. Among visible fats are butter, margarine, cooking oils, and the fat on meat. Invisible fats occur in foodssuch as cheese, sauces, mayonnaise, biscuits, cakes, pastries and nuts. In most diets, about half the fats arevisible and half invisible.Fats are the most concentrated form of energy, providing 37 kilojoules per gram. They are the chemical formin which most of the energy reserve of animals and some seeds is stored. Cholesterol, a lipid, has importantfunctions in the body as part of all cell membranes, part of the myelin in the brain and nervous system, and thestarting material for synthesis in the body of bile acids and adrenocortical and sex hormones. Cholesterol can,however, accumulate in blood and in the inner walls of arteries, leading to disease.Fermented milk: FSANZ defines fermented milk as a milk product obtained by fermentation of milk or productsderived from milk, where the fermentation involves the action of micro-organisms and results in coagulation anda reduction in pH for example, yoghurt. Micro-organisms used in the fermentation of fermented milk must remainviable in the product.Fibre: FSANZ defines fibre as the fraction of the edible parts of plants or their extracts, or synthetic analogues,that are resistant to digestion and absorption in the small bowel, usually with complete or partial fermentation inthe large bowel. This includes polysaccharides, oligosaccharides and lignins, and promotes one or more of thesebeneficial physiological effects – laxation, reduction in blood cholesterol and modulation of blood glucose.Fish: See seafood.144EAT FOR HEALTH – australian dietary guidelinesNational <strong>Health</strong> and Medical Research Council
Flavoured milk: Sweetened flavoured milk provides nutrients but can be high in energy density (due to addedflavours and added sugars). Plain milk is preferable.Food variety: Refers to foods that are biologically diverse or nutritionally distinct from each other. <strong>Eat</strong>ing avariety of nutritious foods means consuming different food types in appropriate amounts to attain all the requirednutrients without excess energy intake. Variety further refers to choosing a range of items from within each foodgroup, particularly within the plant-based groups (vegetables, fruits and cereals). Variety is an important nutritionalprinciple that, in modern sedentary society, requires a reduction in serve sizes, particularly of more energy-densefoods with limited nutrient content.Foundation Diet: The Foundation Diet was informed by current scientific evidence derived from the literature,the most current national intake data and the NHMRC 2006 Nutrient Reference Values. The diets were modelledto provide as close to 100% of the RDIs of ten key nutrients as was feasible and to provide the estimated energyrequirements of the smallest and very sedentary category (PAL 1.4) for each age and gender group. TheseFoundation Diets based on low energy requirements were then tested using 100 7-day simulations with the aimthat all of the simulations would meet the EARs of the ten key nutrients.Fruit: Fruit means the edible portion of a plant or constituents of the edible portion that are present in the typicalproportion of the whole fruit (with or without the peel or water). Examples include pome fruit such as apples andpears, citrus fruit such as oranges and lemons, stone fruit such as apricots and plums, and berries.Fruit juice: Fruit juice, including pulp, is a good source of vitamins such as vitamin C and folate and also providesfibre and carbohydrates, particularly natural sugars. Whole fruit is preferable to fruit juice however the occasionaluse of fruit juice may assist with nutrient intake when fresh, frozen or tinned fruit supply is sub-optimal. Fruit juiceis energy-dense and if consumed in excess, it can displace other nutritious foods from the diet and may lead toproblems such as obesity.Frail elderly people: <strong>For</strong> the purposes of these <strong>Guidelines</strong>, frail elderly people are defined as older persons(usually over the age of 75 years) with a physical or mental disability that may interfere with their ability to performactivities of daily living independently.Grain foods: Refers to the entire class of cereal/grain foods, including whole or partially processed cereal grains(e.g. rice, oats, corn and barley), breads, cereals, rice, pasta, noodles, polenta, couscous, oats, quinoa and barley.It excludes cereal or grain-based products with a significant amount of added fat and sugar, such as cakes,pastries, and biscuits.HDL cholesterol: High-density lipoprotein (HDL) cholesterol assists in removing excess cholesterol out of cells,including cells in the arteries.High quality diet: High quality diet refers to food patterns that closely align with national dietary guidelines with adiverse variety of healthy choices within the five food groups. This is usually aligned with protective dietary patterns.Infant: <strong>For</strong> the purposes of these <strong>Guidelines</strong>, infants are defined as children under the age of 12 months.Iron deficiency: Refers to a condition of low body iron, which may manifest itself as low serum iron, lowserum ferritin, high serum iron–binding capacity, a reduced transferrin saturation index and/or high–freeerythrocyte protoporphyrin. It can cause fatigue, listlessness and pallor and may progress to anaemia. It canalso have widespread non-haematological effects on behaviour, cognition and motor development, physicalwork performance, and body temperature regulation. In Australia, iron deficiency appears to be a conditionpredominantly seen in young women.LDL cholesterol: Low-density lipoprotein (LDL) cholesterol is the main carrier of the cholesterol that is deliveredinto cells.Legumes/beans: Refers to all forms of edible beans and peas and preparations made from them – dried legumes,legume flour, bean curd, canned legumes, cooked legumes. The better known legumes include butter beans,haricot (navy) beans, red kidney beans, soybeans, mung beans, lentils, chick peas, snow peas, peanuts andvarious other types of fresh green peas and beans. Legumes are usually cooked because this increases theirnutritional value and improves their taste, but are occasionally eaten raw (e.g. snow peas). Legumes aretechnically a specialised form of fruit (the pod surrounds the seeds and arises from the base of the flower) butbecause the main food material in legumes is generally the seeds rather than the flesh surrounding the seeds,they are categorised separately.GlossaryNational <strong>Health</strong> and Medical Research Council145
Limit: Limit is used to emphasise the importance of limiting intake of foods and drinks high in saturated and transfats, added salt, added sugars and alcohol, due to evidence that these foods are associated with increased risk ofobesity and/or chronic disease, including cardiovascular disease, type 2 diabetes and/or some cancers.Low fat food: Foods that claim to be ‘low fat’ must meet criteria before a manufacturer is allowed to print thison the food label. A ‘low fat’ or ‘low in fat’ product must contain no more than 3g of fat per 100g of food. A liquidmust contain no more than 1.5g of fat per 100ml of liquid.Low salt food: <strong>For</strong> labelling purposes a low salt food is one with a sodium concentration of up to and including120 mg per 100 g. The following are the conversion factors for the units used to express the sodium contentof food:1 mmol = 23ml1 gram = 43 mmolOne gram of sodium chloride (NaCl) contains 17 mmol, or 391ml, of sodium.Meat: Refers to all or part of the carcass of any cattle, sheep, goat, buffalo, kangaroo, camel, deer, goat, pig orrabbit. <strong>For</strong> the purpose of the <strong>Guidelines</strong> meat refers to the muscle component only, excluding offal such as liverand kidney.Meat alternatives: Refers to other protein-rich foods, such as eggs, fish, shellfish, tofu, legumes, nuts and nutpastes, and certain seeds, such as sunflower and sesame seeds.Mediterranean dietary pattern: It is suggested that the Mediterranean diet is one of the healthiest dietary patternsin the world due to its relation with a low morbidity and mortality for some chronic diseases. The Mediterranean diettraditionally includes fruits, vegetables, nuts, pasta, rice and small amounts of meat. Grains in the Mediterraneanregion are typically wholegrain and bread is eaten plain or dipped in olive oil.Milks, yoghurts and cheeses: Generally refers to cow’s milk and the yoghurt and cheese produced from it butcan also include milks, yoghurts and cheeses from goat and sheep milks.Milk, yoghurt and cheese alternatives: Inclusion in this ‘alternative’ category is based primarily on calciumcontent, although most of the alternatives also provide substantial amounts of protein. Calcium-fortified grainbasedbeverages, fish whose bones are eaten (such as sardines), and some nuts (such as almonds), containmoderate to good amounts of calcium and protein and in this respect can be considered as alternatives.Monounsaturated fatty acids (MUFAs): In chemical terms, MUFAs contain one unsaturated bond. MUFAs occurin considerable amounts in olive oil, canola oil and many kinds of nuts.Mostly: The term ‘mostly’ is derived from the Food Modelling System, where more than 50% of the food groupwas made up of a specific characteristic for example reduced fat varieties. This descriptor ensures that the varietyof foods chosen not only meet nutrient needs but are also within individual energy requirements.Nutrient Reference Values (NRVs): Amounts of nutrients required on an average daily basis for adequatephysiological function and prevention of deficiency disease (EAR, AI or RDI) or chronic disease prevention(acceptable macronutrient distribution range [AMDR] or suggested dietary target [SDT]). Where possible, anupper level of intake (UL) was also set to specify the highest average daily nutrient intake likely to pose noadverse health effects to almost all individuals in the general population.Nutritious foods: Refers to foods that make a substantial contribution towards providing a range of nutrients,have an appropriate nutrient density, and are compatible with the overall aims of these <strong>Guidelines</strong>.Nuts and seeds: A nut is a simple dry fruit with one or two seeds in which the ovary wall becomes very hard(stony or woody) at maturity, and where the seed remains attached or fused with the ovary wall. Most nuts areindehiscent (not opening at maturity). Any large, oily kernel found within a shell and used in food may be regardedas a nut. Examples include almonds, pecans, walnuts, brazil nuts, cashew nuts, chestnuts, hazelnuts, macadamianuts, pine nuts and pistachio nuts.The term ‘nut’ is applied to many seeds that are not botanically true nuts. These may include cape seed, caraway,chia, flaxseed, linseed, passionfruit, poppy seed, pepita or pumpkin seed, sesame seed and sunflower seed.Older adults: <strong>For</strong> the purposes of these <strong>Guidelines</strong>, older adults are defined as healthy people aged 65 yearsand over, not including frail elderly people.146EAT FOR HEALTH – australian dietary guidelinesNational <strong>Health</strong> and Medical Research Council
Omega-3 long chain polyunsaturated fatty acids (LCPUFAs): Omega-3 LCPUFAs have the first double bond inthe n-3 position. The best known are those in fatty fish, their names abbreviated to EPA (20:5 eicosapentaenoicacid) and DHA (22:6 docosahexaenoic acid). Another omega-3 LCPUFA, ALA (18:3 alpha-linolenic acid), occursin considerable amounts in canola and flaxseed oils and in walnuts. Omega-3 LCPUFAs are suggested to beprotective in cardiovascular health.Osteoporosis: Osteoporosis, a condition of low bone mass, can lead to bone fragility and increased risk offractures. Most fractures in older adults are related to osteoporosis whereas trauma is the primary cause offractures in young adults. Clinically, individuals are considered osteoporotic if their bone mineral density is2.5 standard deviations or more below the young adult mean. This criterion identifies about 30% of all postmenopausalwomen as having osteoporosis. Of these, more than 50% will have suffered a previous fracture.Osteoporosis is also of growing importance in men.Pasta and noodles: Includes a wide range of Italian and Asian products based on sheets of dough made fromflours – usually wheat or rice flour – and water, sometimes with egg added. Examples are plain spaghetti, lasagne,fettuccine, udon and Hokkien noodles, rice paper and wonton wrappers. The term excludes some instant noodlesand flavoured pasta mixes with significant amounts of added fat and salt.Physical activity: Any structured or incidental body movement (light, moderate or vigorous) that causes themuscles to work and uses more energy than the person would use if resting.Physical inactivity: Physical inactivity (or sedentary behaviour) is defined as a state in which body movement isminimal, such as sitting time while watching television, reading, working at a computer, talking on the telephone,driving a car, or meditating.Phytochemicals: Substances found in plant materials which may confer some health benefits and which includea number of chemical categories such as carotenoids, flavonoids and isoflavonoids, polyphenols, isothiocyanates,indoles, sulphoraphane, monoterpenes, xanthin, and non-digestible oligosaccharides.Plenty: This term is used judiciously to encourage increased consumption of a variety of vegetables (particularlynon-starchy varieties).Polyunsaturated fatty acids (PUFAs): PUFAs contain two or more (poly) double (unsaturated) bonds. Foods with ahigh PUFA content are liquid at room temperature that is, they tend to be ‘oils’. The most common PUFA is linoleicacid (18:2) whose first double bond is in the n-6 position. It occurs in seed oils including sunflower oil, saffloweroil and corn oil. Smaller amounts of PUFAs with the first double bond in the n-3 position also occur in the diet.The best known are those in fatty fish, their names abbreviated to EPA (20:5 eicosapentaenoic) and DHA (22:6docosahexaenoic). Another omega-3 PUFA, ALA (18:3 alpha-linolenic), occurs in considerable amounts in canolaand flaxseed oils and in walnuts.Poultry: Refers to chicken, duck, turkey and all other avian foods except eggs.Quinoa: See grain foods.Recommended dietary intake (RDI): The average daily dietary intake level that is sufficient to meet the nutrientrequirements of nearly all (97–98 per cent) healthy individuals in a particular life stage and gender group.Red meat: The muscle meat from cattle, sheep, pig, goat and kangaroo. Note that although pork is not consideredred meat for marketing purposes in Australia, it is classified as red meat in the international literature, and hasbeen treated as red meat for the purpose of these <strong>Guidelines</strong>.Reduced fat products: <strong>For</strong> a food to be labelled ‘reduced fat’, it must contain at least 25% less fat than is presentin the same quantity of the reference food.Refined grain (cereal) foods: Refers to highly processed grain (cereal) foods where the outer layer of the grainis lost during processing. These also include cereal or grain-based products with a significant amount of added fatand sugar, such as cakes, pastries, and biscuits.Regularly: The term ‘regularly’ is used in discussions on weight management and growth. In this content, takingmeasurements such as weight or height every month provide a fair indication of change. Measurements takenmore frequently than this are often not a true picture of your weight and/or growth.GlossaryNational <strong>Health</strong> and Medical Research Council147
Salt: <strong>Dietary</strong> salt is an inorganic compound consisting of sodium and chloride ions. It is found naturally in manyfoods, but it is also added to many foods because of its preservative and flavouring characteristics. Research hasshown that both the sodium and the chloride can be detrimental to health when consumed in excess. About 90%of all the sodium added to food is sodium chloride, so dietary intake of sodium approximates intake of sodiumchloride for practical purposes. Sodium in the diet of Australian adults comes mostly from processed foods,although sodium added in cooking, at the table, in medications and naturally present in foods can contribute tothe total dietary intake.Australian adults are recommended to limit their intake of sodium to less than 2,300 mg per day. This is equivalentto about 6g of salt, or one and a half teaspoons.Saturated fatty acids (SFAs): In chemical terms, SFAs contain no double bond – that is, they are fully saturatedwith hydrogen. Foods that predominantly comprise SFAs are usually solid at room temperature (e.g. butter,fat on meat). SFAs are the main type of fatty acid in milk, cream, butter and cheese, in some meats (most ofthe land animal fats), and can also be found in considerable amounts in some oils such as in palm and coconutoil. When the SFAs palmitic (16:0), myristic (14:0) and lauric (12:0) predominate in the diet they tend to raiseplasma cholesterol.Seafood: Refers to seafood (including fish) that is safe for human consumption and is produced or tradedcommercially in Australia, including seafood exports and imports.Simple carbohydrate: See sugars.Sodium: See salt.Solid foods: All foods other than liquids – includes semi-solid/pureed foods, finger foods and family foods.Standard drink: A standard drink contains 10 grams of alcohol – equivalent to 12.5ml of alcohol.Starch: FSANZ defines starch as a complex carbohydrate (polysaccharide) containing a mixture of two molecules:amylose and amylopectin. Starch is determined chromatographically after enzymatic treatment of a de-sugaredextract of the food.Sugars: Conventionally used to describe monosaccharides and disaccharides such as sucrose, glucose andfructose, which can be found naturally in foods or can be added in processing. Sugars is the term used in theanalysis of the 1995 National Nutrition Survey. Sugar, by contrast, is commonly used to describe purified sucrose,as are the terms refined sugar and added sugar. Added sugars may also include other sugars such as glucose,fructose and corn syrup.Tofu: Tofu is made from soybeans, water and a coagulant, or curdling agent. Tofu is a protein-rich food and inthese <strong>Guidelines</strong> it is classified as a meat alternative.Total Diet: Progression from Foundation Diets to Total Diets can occur when total energy needs are greater thanthe energy provided by a Foundation Diet for a particular age and sex group. General principles were determinedto ensure that diets remained within acceptable limits for percentage of energy from fat and the various fatcomponents, protein and carbohydrate (AMDRs), the ULs and SDTs for chronic disease prevention. The principlesallow free addition of vegetables, including legumes, fruits, nuts and seeds, and cereal foods. The principles alsoencourage a variety of choice of additional foods while defining the choices allowed in the modelling for the meat,milk, yoghurt and cheese products and unsaturated margarines and oils categories. ‘Discretionary choices’ canbe included but they do not need to be included in the diet, and Total Diets without inclusion of any ‘discretionarychoices’ were also modelled for all age and sex groups.Trans-fatty acids (TFAs): TFAs are a form of unsaturated fatty acid that is straight at a double bond rather than bent,as in the usual cis form. They are not common in nature but are formed during some manufacturing processes,such as when edible oils are hydrogenated to make cooking margarines. Small amounts of trans-fatty acids occurnaturally in meats and dairy foods.Unsaturated fatty acid: See monounsaturated fatty acids and polyunsaturated fatty acids.Upper level of intake (UL): The highest average daily nutrient intake level likely to pose no adverse health effectsto almost all individuals in the general population. As intake increases above the UL of intake, the potential risk ofadverse effects increases.148EAT FOR HEALTH – australian dietary guidelinesNational <strong>Health</strong> and Medical Research Council
Vegetables: Vegetable means the edible portion of a plant or constituents of the edible portion that are presentin the typical proportion of the whole vegetable (with or without the peel or water). Examples include: leafy greenvegetables (spinach, lettuce, silverbeet and bok choi), members of the crucifer or Brassica family (broccoli, cabbage,and brussel sprouts), starchy root and tuber vegetables (yams and potatoes), and edible plant stems (celery andasparagus), gourd vegetables (pumpkin, squash and cucumber), Allium vegetables (onions, garlic and shallots),and sweet corn.Wholegrain: This term applies to products which uses every part of the grain including the outer layers, bran andgerm even if these parts are separated during processing and regardless of whether the grain is in one piece ormilled into smaller pieces.The term wholegrain may apply to whole and intact grains as found in some bread and crisp breads, puffed orflaked grains in some breakfast cereals, coarsely milled or kibbled wheat found in breads such as pumpernickeland ground grains such whole wheat flour used to make wholemeal bread.Whole foods: This refers to foods themselves for example fruit, vegetables, bread, pasta, lean meat, milk,yoghurt and not the food component for example calcium, iron, protein.GlossaryNational <strong>Health</strong> and Medical Research Council149
Acronyms and abbreviationsADHDAIDSALAAMDRAUSNUTBFHIBMICDCCEOCSIRODAADALYDHADoHADPAEAREPAEPICFAOFSANZGIGPHDLHIVIARCIOTFLCALCPUFALDLMAIFattention deficit hyperactivity disorderacquired immunodeficiency syndromealpha-linolenic acidAcceptable Macronutrient Distribution RangesAustralian Food and Nutrient DatabaseBaby Friendly Hospital Initiativebody mass indexCenters for Disease Control and Prevention (US)Chief Executive OfficerCommonwealth Scientific and Industrial Research OrganisationDietitians Association of Australiadisability-adjusted life yearsdocosahexaenoic acidDepartment of <strong>Health</strong> and Ageingdocosapentaenoic acidEstimated Average Requirementeicosapentaenoic acidEuropean Prospective Investigation into Cancer and NutritionFood and Agriculture Organisation of the United NationsFood Standards Australia New Zealandglycaemic indexgeneral practitionerhigh-density lipoproteinhuman immunodeficiency virusInternational Agency for Research on CancerInternational Obesity Task <strong>For</strong>celife cycle analysislong chain polyunsaturated fatty acidlow-density lipoproteinMarketing in Australia of Infant <strong>For</strong>mulaAcronyms and abbreviationsNational <strong>Health</strong> and Medical Research Council151
MUFAmonounsaturated fatty acidNATSINSAP National Aboriginal and Torres Strait Islander Nutrition Strategy and Action PlanNHANESNHMRCNRVNUTTABPMSEICPUFARCTRDISDTSEIFASFASIDSTFAUKULUSUSDAWCRFWHONational <strong>Health</strong> and Nutrition Examination SurveyNational <strong>Health</strong> and Medical Research Councilnutrient reference valueNutrient Tables for Use in AustraliaPrime Minister’s Science, Engineering and Innovation Councilpolyunsaturated fatty acidrandomised controlled trialrecommended dietary intakeSuggested <strong>Dietary</strong> Targetsocioeconomic indexes for areassaturated fatty acidsudden infant death syndrometrans-fatty acidUnited KingdomUpper LevelUnited StatesUnited States Department of AgricultureWorld Cancer Research FundWorld <strong>Health</strong> Organization152EAT FOR HEALTH – australian dietary guidelinesNational <strong>Health</strong> and Medical Research Council
References1. Rayner M, Scarborough P. The burden of food related ill health in the UK. J Epidemiol Community <strong>Health</strong>2005;59(12):1054–7.2. National Public <strong>Health</strong> Partnership. <strong>Eat</strong> well Australia: an agenda for action for public health nutrition,2000-2010. Canberra: National Public <strong>Health</strong> Partnership; 2001.3. Australian Institute of <strong>Health</strong> and Welfare. Premature mortality from chronic disease. AIHW Bulletin no.84. Cat. no. AUS 133. Canberra: Australian Institute of <strong>Health</strong> and Welfare, 2010. http://www.aihw.gov.au/publication-detail/?id=64424724664. Crowley S, Antioch K, Carter R, Waters AM, Conway L, Mathers C. The cost of diet-related disease inAustralia: a discussion paper. Canberra: Australian Institute of <strong>Health</strong> and Welfare, 1992.5. Access Economics. The growing cost of obesity in 2008: three years on. Canberra: Diabetes Australia,Access Economics, 2008. Available from: http://www.accesseconomics.com.au/publicationsreports/showreport.php?id=1726. National Preventative <strong>Health</strong> Taskforce. Australia: the healthiest country by 2020 – National Preventative<strong>Health</strong> Strategy – the roadmap for action. Canberra: Commonwealth of Australia; 2009a.7. Lee AJ, Bailey AP, Yarmirr D, O’Dea K, Mathews JD. Survival tucker: Improved diet and health indicators inan Aboriginal community. Aust J Public <strong>Health</strong> 1994;18(3):277–85.8. National <strong>Health</strong> and Medical Research Council, Australian Government Department of <strong>Health</strong> and Ageing,New Zealand Ministry of <strong>Health</strong>. Nutrient reference values for Australia and New Zealand includingrecommended dietary intakes. Canberra: Commonwealth of Australia; 2006.9. National <strong>Health</strong> and Medical Research Council. A modelling system to inform the revision of the AustralianGuide to <strong>Health</strong>y <strong>Eat</strong>ing. Canberra: Commonwealth of Australia; 2011b.10. Begg S, Vos T, Barker B, Stevenson C, Stanley L, Lopez AD. The burden of disease and injury in Australia2003. Canberra: Australian Institute of <strong>Health</strong> and Welfare, 2007.11. Australian Bureau of Statistics. National <strong>Health</strong> Survey: Summary of Results, 2007-2008. Cat. no. 4364.0.Canberra: Australian Bureau of Statistics, 2009. http://www.abs.gov.au/ausstats/abs@.nsf/mf/4364.0/12. Commonwealth Scientific and Industrial Research Organisation, Preventative <strong>Health</strong> National ResearchFlagship, University of South Australia. 2007 Australian National Children’s Nutrition and Physical ActivitySurvey: main findings. Canberra: Commonwealth of Australia, 2008. http://www.health.gov.au/internet/main/publishing.nsf/content/66596E8FC68FD1A3CA2574D50027DB86/$File/childrens-nut-phys-survey.pdf13. Buckland G, Bach A, Serra-Majem L. Obesity and the Mediterranean diet: a systematic review ofobservational and intervention studies. Obes Rev 2008;9(6):582–93.14. Roman B, Carta L, Martinez-Gonzalez MA, Serra-Majem L. Effectiveness of the Mediterranean diet in theelderly. Clin Interv Aging 2008;3(1):97–109.15. Serra-Majem L, Roman B, Estruch R. Scientific evidence of interventions using the Mediterranean diet:a systematic review. Nutr Rev 2006;64(2):S27.16. Bamia C, Trichopoulos D, Ferrari P, Overvad K, Bjerregaard L, Tjonneland A et al. <strong>Dietary</strong> patterns andsurvival of older Europeans: the EPIC-Elderly Study (European Prospective Investigation into Cancer andNutrition). Public <strong>Health</strong> Nutr 2007;10(6):590–8.ReferencesNational <strong>Health</strong> and Medical Research Council153
17. Diehr P, Derleth A, Cai L, Newman AB. The effect of different public health interventions on longevity,morbidity, and years of healthy life. BMC Public <strong>Health</strong> 2007;7:52.18. Kant AK, Graubard BI, Schatzkin A. <strong>Dietary</strong> patterns predict mortality in a national cohort: the National<strong>Health</strong> Interview Surveys, 1987 and 1992. J Nutr 2004;134(7):1793–9.19. Togo P, Osler M, Sorensen TI, Heitmann BL. Food intake patterns and body mass index in observationalstudies. Int J Obes Relat Metab Disord 2001;25(12):1741–51.20. Wirt A, Collins CE. Diet quality--what is it and does it matter? Public <strong>Health</strong> Nutr 2009;12(12):2473–92.21. Anderson AL, Harris TB, Tylavsky FA, Perry SE, Houston DK, Hue TF et al. <strong>Dietary</strong> patterns and survival ofolder adults. J Am Diet Assoc 2011;111(1):84–91.22. de Groot CP, van Staveren WA. Nutritional concerns, health and survival in old age. Biogerontol2010;11(5):597–602.23. Scarborough P, Nnoaham KE, Clarke D, Capewell S, Rayner M. Modelling the impact of a healthy diet oncardiovascular disease and cancer mortality. J Epidemiol Community <strong>Health</strong> 2010.24. Australian Institute of <strong>Health</strong> and Welfare. Australia’s health 2010. Australia’s health series no. 12. Cat. no.AUS 122. Canberra: Australian Institute of <strong>Health</strong> and Welfare, 2010. http://www.aihw.gov.au/publicationdetail/?id=644246837625. Wilkinson R, Marmot M. Social determinants of health: The solid facts. Copenhagen: World <strong>Health</strong>Organization, 2003. Available from: http://www.euro.who.int/__data/assets/pdf_file/0005/98438/e81384.pdf26. Marmot MG. The status syndrome: how social standing affects our health and longevity. New York:Henry Holt, 2004.27. Friel S, Baker PI. Equity, food security and health equity in the Asia Pacific region. Asia Pac J Clin Nutr2009;18(4):620–32.28. National <strong>Health</strong> and Medical Research Council. Nutrition in Aboriginal and Torres Strait Islander peoples:an information paper. Canberra: Commonwealth of Australia, 2000.29. Australian Bureau of Statistics, Australian Institute of <strong>Health</strong> and Welfare. The health and welfare ofAustralia’s Aboriginal and Torres Strait Islander peoples. ABS Cat. no. 4704.0. AIHW Cat. no. IHW14.Canberra: Commonwealth of Australia, 2005. http://www.aihw.gov.au/publication-detail/?id=644246775430. Australian Bureau of Statistics. National Aboriginal and Torres Strait Islander <strong>Health</strong> Survey 2004-2005.Canberra: Australian Bureau of Statistics, 2006. http://www.ausstats.abs.gov.au/Ausstats/subscriber.nsf/0/B1BCF4E6DD320A0BCA25714C001822BC/$File/47150_2004-05.pdf31. Commonwealth Department of <strong>Health</strong> and Family Services. Food and nutrition policy. 1992 (cited29 March 2011). http://www.health.gov.au/internet/main/publishing.nsf/content/phd-nutrition-fnp-1992.http://www.patonsyarns.com/pattern.ph32. National <strong>Health</strong> and Medical Research Council. How to review the evidence: systematic identification andreview of the scientific literature. Canberra: Commonwealth of Australia, 2000a. http://www.nhmrc.gov.au/publications/synopses/cp65syn.htm33. National <strong>Health</strong> and Medical Research Council. A review of the evidence to address targeted questionsto inform the revision of the Australian dietary guidelines. Canberra: Commonwealth of Australia; 2011a.34. National <strong>Health</strong> and Medical Research Council. <strong>Dietary</strong> <strong>Guidelines</strong> for Older Australians. Canberra:Commonwealth of Australia, 1999. http://www.nhmrc.gov.au/publications/synopses/n23syn.htm35. National <strong>Health</strong> and Medical Research Council. <strong>Dietary</strong> <strong>Guidelines</strong> for Children and Adolescents inAustralia. Canberra: Commonwealth of Australia, 2003a. http://www.nhmrc.gov.au/publications/synopses/dietsyn.htm36. National <strong>Health</strong> and Medical Research Council. <strong>Dietary</strong> <strong>Guidelines</strong> for Australian Adults. Canberra:Commonwealth of Australia; 2003b.154EAT FOR HEALTH – australian dietary guidelinesNational <strong>Health</strong> and Medical Research Council
37. National <strong>Health</strong> and Medical Research Council. Review: Nutritional requirements and dietary advicetargeted for pregnant and breastfeeding women. Canberra: Commonwealth of Australia; 2013.38. Williams P, Allman-Farrinelli M, Collins C, Gifford J, Byron A. A review of the evidence to address targetedquestions to inform the revision of the Australian dietary guidelines 2009: Process Manual. DietitiansAssociation of Australia; 2011.39. National <strong>Health</strong> and Medical Research Council. NHMRC additional levels of evidence and grades forrecommendations for developers of guidelines. Canberra: Commonwealth of Australia; 2007.40. National <strong>Health</strong> and Medical Research Council. How to use the evidence: assessment and application ofscientific evidence. Canberra: Commonwealth of Australia, 2000b. http://www.nhmrc.gov.au/publications/synopses/cp69syn.htm41. National <strong>Health</strong> and Medical Research Council. NHMRC standards and procedures for externallydeveloped guidelines. Canberra: Commonwealth of Australia; 2007.42. National <strong>Health</strong> and Medical Research Council. NHMRC levels of evidence and grades forrecommendations for developers of guidelines. Canberra: Commonwealth of Australia; 2009.43. World Cancer Research Fund, American Institute for Cancer Research. Food, nutrition, physical activity,and the prevention of cancer: a global perspective. Washington DC.: 2007. Available from:http://www.dietandcancerreport.org/?p=er44. Ball K, Mishra GD, Thane CW, Hodge A. How well do Australian women comply with dietary guidelines?Public <strong>Health</strong> Nutr 2004;7(3):443–52.45. Australian Bureau of Statistics. National Nutrition Survey: Foods eaten, Australia 1995. Canberra: AustralianBureau of Statistics, 1999. http://www.abs.gov.au/AUSSTATS/abs@.nsf/0/9A125034802F94CECA2568A9001393CE?OpenDocument46. Commonwealth Department of <strong>Health</strong> and Family Services. The Australian guide to healthy eating.Canberra: Commonwealth of Australia, 1998. http://www.health.gov.au/internet/main/publishing.nsf/content/health-pubhlth-publicat-document-fdbrox-cnt.htm47. Rangan AM, Randall D, Hector DJ, Gill TP, Webb KL. Consumption of ‘extra’ foods by Australian children:types, quantities and contribution to energy and nutrient intakes. Eur J Clin Nutr 2008;62(3):356–64.48. Australian Bureau of Statistics. National Nutrition Survey: Nutrient intakes and physical measurements,Australia 1995. Canberra: Australian Bureau of Statistics, 1998. http://www.abs.gov.au/ausstats/abs@.nsf/Lookup/95E87FE64B144FA3CA2568A9001393C049. Burke V, Beilin LJ, Simmer K, Oddy WH, Blake KV, Doherty D et al. Predictors of body mass index andassociations with cardiovascular risk factors in Australian children: a prospective cohort study. Int J Obes(Lond) 2005;29(1):15–23.50. Classen T, Hokayem C. Childhood influences on youth obesity. Econ Hum Biol 2005;3(2):165–87.51. Dubois L, Farmer A, Girard M, Porcherie M. Family food insufficiency is related to overweight amongpreschoolers. Soc Sci Med 2006;63(6):1503–16.52. Dubois L, Girard M. Early determinants of overweight at 4.5 years in a population-based longitudinal study.Int J Obesity 2006;30(4):610–7.53. Field AE, Austin SB, Gillman MW, Rosner B, Rockett HR, Colditz GA. Snack food intake does not predictweight change among children and adolescents. Int J Obes Relat Metab Disord 2004;28(10):1210–6.54. Hawkins SS, Cole TJ, Law C. An ecological systems approach to examining risk factors for earlychildhood overweight: findings from the UK Millennium Cohort Study. J Epidemiol Community <strong>Health</strong>2009;63(2):147–55.55. Hesketh K, Carlin J, Wake M, Crawford D. Predictors of body mass index change in Australian primaryschool children. Int J Pediatr Obes 2009;4(1):45–53.ReferencesNational <strong>Health</strong> and Medical Research Council155
56. Hesketh K, Wake M, Waters E, Carlin J, Crawford D. Stability of body mass index in Australian children:a prospective cohort study across the middle childhood years. Public <strong>Health</strong> Nutr 2004;7(2):303–9.57. Li L, Law C, Lo Conte R, Power C. Intergenerational influences on childhood body mass index: the effectof parental body mass index trajectories. Am J Clin Nutr 2009;89(2):551–7.58. Mamun AA, Lawlor DA, O’Callaghan MJ, Williams GM, Najman JM. Family and early life factorsassociated with changes in overweight status between ages 5 and 14 years: findings from the MaterUniversity Study of Pregnancy and its outcomes. Int J Obes (Lond) 2005;29(5):475–82.59. Power C, Li L, Manor O, Davey Smith G. Combination of low birth weight and high adult body massindex: at what age is it established and what are its determinants? J Epidemiol Community <strong>Health</strong>2003;57(12):969–73.60. Reilly JJ, Armstrong J, Dorosty AR, Emmett PM, Ness A, Rogers I et al. Early life risk factors for obesityin childhood: cohort study. Br Med J 2005;330(7504):1357.61. Salsberry PJ, Reagan PB. Taking the long view: the prenatal environment and early adolescent overweight.Res Nurs <strong>Health</strong> 2007;30(3):297–307.62. Yang S, Lynch J, Schulenberg J, Roux AV, Raghunathan T. Emergence of socioeconomic inequalities insmoking and overweight and obesity in early adulthood: the national longitudinal study of adolescenthealth. Am J Public <strong>Health</strong> 2008;98(3):468–77.63. Erik Landhuis C, Poulton R, Welch D, Hancox RJ. Programming obesity and poor fitness: the long-termimpact of childhood television. Obesity (Silver Spring) 2008;16(6):1457–9.64. Danner FW. A national longitudinal study of the association between hours of TV viewing and thetrajectory of BMI growth among US children. J Pediatr Psychol 2008;33(10):1100–7.65. Bhargava A, Jolliffe D, Howard LL. Socio-economic, behavioural and environmental factors predicted bodyweights and household food insecurity scores in the Early Childhood Longitudinal Study-Kindergarten.Br J Nutr 2008;100(2):438–44.66. Henderson VR. Longitudinal associations between television viewing and body mass index among whiteand black girls. J Adolesc <strong>Health</strong> 2007;41(6):544–50.67. Viner RM, Cole TJ. Television viewing in early childhood predicts adult body mass index. J Pediatr2005;147(4):429–35.68. Sturm R, Datar A. Body mass index in elementary school children, metropolitan area food prices andfood outlet density. Public <strong>Health</strong> 2005;119(12):1059–68.69. Baker E, Balistreri KS, Van Hook J. Maternal employment and overweight among Hispanic children ofimmigrants and children of natives. J Immigr Minor <strong>Health</strong> 2009;11(3):158–67.70. Gorely T, Marshall SJ, Biddle SJ. Couch kids: correlates of television viewing among youth. Int J BehavMed 2004;11(3):152–63.71. Epstein LH, Roemmich JN, Robinson JL, Paluch RA, Winiewicz DD, Fuerch JH et al. A randomized trialof the effects of reducing television viewing and computer use on body mass index in young children.Arch Pediatr Adolesc Med 2008;162(3):239–45.72. Matijasevich A, Victora CG, Golding J, Barros FC, Menezes AM, Araujo CL et al. Socioeconomic positionand overweight among adolescents: data from birth cohort studies in Brazil and the UK. BMC Public<strong>Health</strong> 2009;9:105.73. Oliver LN, Hayes MV. Effects of neighbourhood income on reported body mass index: an eight yearlongitudinal study of Canadian children. BMC Public <strong>Health</strong> 2008;8:16.74. Poulton R, Caspi A, Milne BJ, Thomson WM, Taylor A, Sears MR et al. Association between children’sexperience of socioeconomic disadvantage and adult health: a life-course study. Lancet 2002;360(9346):1640–5.156EAT FOR HEALTH – australian dietary guidelinesNational <strong>Health</strong> and Medical Research Council
75. Taveras EM, Berkey CS, Rifas-Shiman SL, Ludwig DS, Rockett HR, Field AE et al. Association ofconsumption of fried food away from home with body mass index and diet quality in older children andadolescents. Pediatrics 2005;116(4):e518–24.76. Viner RM, Cole TJ. Who changes body mass between adolescence and adulthood? Factors predictingchange in BMI between 16 year and 30 years in the 1970 British Birth Cohort. Int J Obesity2006;30(9):1368–74.77. Bisset S, Gauvin L, Potvin L, Paradis G. Association of body mass index and dietary restraint with changesin eating behaviour throughout late childhood and early adolescence: a 5-year study. Public <strong>Health</strong> Nutr2007;10(8):780–9.78. Laitinen J, Pietilainen K, Wadsworth M, Sovio U, Jarvelin MR. Predictors of abdominal obesity among31-y-old men and women born in Northern Finland in 1966. Eur J Clin Nutr 2004;58(1):180–90.79. Sturm R, Datar A. Food prices and weight gain during elementary school: 5-year update. Public <strong>Health</strong>2008;122(11):1140–3.80. Goodman E, Whitaker RC. A prospective study of the role of depression in the development andpersistence of adolescent obesity. Pediatrics 2002;110(3):497–504.81. Hesketh K, Wake M, Waters E. Body mass index and parent-reported self-esteem in elementary schoolchildren: evidence for a causal relationship. Int J Obes Relat Metab Disord 2004;28(10):1233–7.82. Klein EG, Lytle LA, Chen V. Social ecological predictors of the transition to overweight in youth:results from the Teens <strong>Eat</strong>ing for Energy and Nutrition at Schools (TEENS) study. J Am Diet Assoc2008;108(7):1163–9.83. Fidler JA, West R, Van Jaarsveld CH, Jarvis MJ, Wardle J. Does smoking in adolescence affect body massindex, waist or height? Findings from a longitudinal study. Addiction 2007;102(9):1493–501.84. Gale CR, Batty GD, Deary IJ. Locus of control at age 10 years and health outcomes and behaviors at age30 years: the 1970 British Cohort Study. Psychosom Med 2008;70(4):397–403.85. Francis LA, Susman EJ. Self-regulation and rapid weight gain in children from age 3 to 12 years. Arch PediatrAdolesc Med 2009;163(4):297–302.86. Koch FS, Sepa A, Ludvigsson J. Psychological stress and obesity. J Pediatr 2008;153(6):839–44.87. Thomas C, Hypponen E, Power C. Obesity and type 2 diabetes risk in midadult life: the role of childhoodadversity. Pediatrics 2008;121(5):e1240–9.88. Joint WHO/FAO Expert Consultation on Diet Nutrition and the Prevention of Chronic Diseases. Diet,nutrition and the prevention of chronic diseases: report of a joint WHO/FAO expert consultation.Geneva: 2003. Available from: http://www.ncbi.nlm.nih.gov/entrez/query.fcgi?cmd=Retrieve&db=PubMed&dopt=Citation&list_uids=1276889089. National Preventative <strong>Health</strong> Taskforce. Australia: the healthiest country by 2020. Technical report no.1 Obesity in Australia: a need for urgent action Including addendum for October 2008 to June 2009Canberra: Commonwealth of Australia; 2009b.90. Schmidt M, Affenito SG, Striegel-Moore R, Khoury PR, Barton B, Crawford P et al. Fast-food intake anddiet quality in black and white girls: the National Heart, Lung, and Blood Institute Growth and <strong>Health</strong>Study. Arch Pediatr Adolesc Med 2005;159(7):626–31.91. Affenito SG, Thompson DR, Barton BA, Franko DL, Daniels SR, Obarzanek E et al. Breakfast consumptionby African-American and white adolescent girls correlates positively with calcium and fiber intake andnegatively with body mass index. J Am Diet Assoc 2005;105(6):938–45.92. Larson NI, Neumark-Sztainer D, Hannan PJ, Story M. Family meals during adolescence are associatedwith higher diet quality and healthful meal patterns during young adulthood. J Am Diet Assoc2007;107(9):1502–10.ReferencesNational <strong>Health</strong> and Medical Research Council157
93. Australian Bureau of Statistics. Australian <strong>Health</strong> Survey. 2011 (cited 2011). http://www.abs.gov.au/websitedbs/D3310114.nsf/Home/Australian+<strong>Health</strong>+Survey?OpenDocument http://www.patonsyarns.com/pattern.ph94. Mozaffarian D, Micha R, Wallace S. Effects on coronary heart disease of increasing polyunsaturated fat inplace of saturated fat: a systematic review and meta-analysis of randomized controlled trials. PLoS Med2010;7(3):e1000252.95. Yngve A, Tseng M. <strong>Dietary</strong> guidelines and goal-setting. Public health Nutrition 2010;13(8):1149-50.96. Holdsworth M. Sustainability should be integral to nutrition and dietetics. Human Nutrition and Dietetics2010;23:467-68.97. Kickbusch I. The Food System: a prism of present and future challenges for health promotion andsustainable development. Geneva 2010.98. World <strong>Health</strong> Organization. Obesity: preventing and managing the global epidemic. Report of a WHOconsultation (WHO Technical Report Series No. 894). Geneva: World <strong>Health</strong> Organization, 2000.Available from: http://whqlibdoc.who.int/trs/WHO_TRS_894.pdf99. Caballero B. The global epidemic of obesity: an overview. Epidemiol Rev 2007;29:1–5.100. World <strong>Health</strong> Organization Expert Committee on Physical Status. Physical status: the use andinterpretation of anthropometry. Geneva: World <strong>Health</strong> Organization, 1995. Available from:http://whqlibdoc.who.int/trs/WHO_TRS_854.pdf101. World <strong>Health</strong> Organization. Global strategy on diet, physical activity and health. Geneva: World <strong>Health</strong>Organization, 2004. Available from: http://www.goforyourlife.vic.gov.au/hav/articles.nsf/pracpages/WHO_Global_Strategy_on_Diet_Physical_Activity_and_<strong>Health</strong>?OpenDocument102. Willett WC, Dietz WH, Colditz GA. <strong>Guidelines</strong> for healthy weight. N Engl J Med 1999;341(6):427–34.103. National <strong>Health</strong> and Medical Research Council. Acting on Australia’s weight: A strategic plan for theprevention of overweight and obesity. Canberra: Commonwealth of Australia, 1997. http://www.nhmrc.gov.au/_files_nhmrc/file/publications/synopses/withdrawn/n21.pdf104. World <strong>Health</strong> Organization. Global database on body mass index: An interactive surveillance tool formonitoring nutrition transition 2011 (cited 18 May 2011). http://apps.who.int/bmi/index.jsp.http://www.patonsyarns.com/pattern.ph105. Hocking S, Draper G, Somerford P, Xiao J, Weeramanthri T. The Western Australian Chief <strong>Health</strong> Officer’sReport 2010. Perth: Department of <strong>Health</strong>, WA, 2010. http://www.public.health.wa.gov.au/3/1045/1/chief_health_officers_report_.pm106. Queensland <strong>Health</strong>. Risk factor impact on the burden of disease and injury in Queensland, 2007.Queensland <strong>Health</strong>,2010.107. Withrow D, Alter DA. The economic burden of obesity worldwide: a systematic review of the direct costsof obesity. Obes Rev 2011;12(2):131–41.108. Medibank Private Ltd. Obesity in Australia: Financial impacts and cost benefits of intervention.Medibank Private Ltd., 2010. Available from: http://www.medibank.com.au/Client/Documents/Pdfs/Obesity_Report_2010.pdf109. Colagiuri S, Lee CM, Colagiuri R, Magliano D, Shaw JE, Zimmet PZ et al. The cost of overweight andobesity in Australia. Med J Aust 2010;192(5):260–4.110. Institute of Medicine. Bridging the evidence gap in obesity prevention:a framework to inform decisionmaking. Washington DC: Institute of Medicine, 2010. Available from: http://www.iom.edu/Reports/2010/Bridging-the-Evidence-Gap-in-Obesity-Prevention-A-Framework-to-Inform-Decision-Making.aspx111. Rokholm B, Baker JL, Sorensen TI. The levelling off of the obesity epidemic since the year 1999—a reviewof evidence and perspectives. Obes Rev 2010;11(12):835–46.158EAT FOR HEALTH – australian dietary guidelinesNational <strong>Health</strong> and Medical Research Council
112. Olds TS, Tomkinson GR, Ferrar KE, Maher CA. Trends in the prevalence of childhood overweight andobesity in Australia between 1985 and 2008. Int J Obesity 2010;34(1):57–66.113. Gill TP, Baur LA, Bauman AE, Steinbeck KS, Storlien LH, Fiatarone Singh MA et al. Childhood obesity inAustralia remains a widespread health concern that warrants population-wide prevention programs.Med J Aust 2009;190(3):146–8.114. Lobstein T, Baur L, Uauy R. Obesity in children and young people: a crisis in public health. Obes Rev2004;5(Suppl 1):4–104.115. Olshansky SJ, Passaro DJ, Hershow RC, Layden J, Carnes BA, Brody J et al. A potential decline in lifeexpectancy in the United States in the 21st century. N Engl J Med 2005;352(11):1138–45.116. Haby M, Markwick A. Future prevalence of overweight and obesity in Australian children and adolescents,2005-2025. Melbourne: Department of Human Services, 2008. http://www.health.vic.gov.au/healthstatus/downloads/future_overweight_prevalence_report.pdf117. Australian Institute of <strong>Health</strong> and Welfare. Australia’s health 2008. Cat. no. AUS 99. Canberra: AustralianInstitute of <strong>Health</strong> and Welfare, 2008. http://www.aihw.gov.au/publication-detail/?id=6442468102118. Barba C, Cavalli-Sforza T, Cutter J, Darnton-Hill I, Deurenberg P, Deurenberg-Yap M et al. Appropriatebody-mass index for Asian populations and its implications for policy and intervention strategies. Lancet2004;363(9403).119. Flicker L, McCaul KA, Hankey GJ, Jamrozik K, Brown WJ, Byles JE et al. Body mass index and survival inmen and women aged 70 to 75. J Am Geriatr Soc 2010;58(2):234–41.120. Rush E, Plank L, Chandu V, Laulu M, Simmons D, Swinburn B et al. Body size, body composition, and fatdistribution: a comparison on young New Zealand men of European, Pacific Island, and Asian ethnicities.NZ Med J 2004;117:U1203.121. National <strong>Health</strong> and Medical Research Council. Clinical practice guidelines for the management ofoverweight and obesity in adults, adolescents and children. Melbourne: National <strong>Health</strong> and MedicalResearch Council; 2013.122. Cole TJ, Bellizzi MC, Flegal KM, Dietz WH. Establishing a standard definition for child overweight andobesity worldwide: international survey. Br Med J 2000;320(7244):1240–3.123. Cole TJ, Flegal KM, Nicholls D, Jackson AA. Body mass index cut offs to define thinness in children andadolescents: international survey. Br Med J 2007;335(7612):194.124. de Onis M, Onyango AW, Borghi E, Siyam A, Nishida C, Siekmann J. Development of a WHO growthreference for school-aged children and adolescents. Bull World <strong>Health</strong> Organ 2007;85(9):660–7.125. Sinatra FR. Nonalcoholic fatty liver disease in paediatric patients. Journal of Parenteral and EnteralNutrition 2012;36(1):43S-48S.126. Prospective Studies Collaboration, Whitlock G, Lewington S, Sherliker P, Clarke R, Emberson J et al.Body-mass index and cause-specific mortality in 900 000 adults: collaborative analyses of 57 prospectivestudies. Lancet 2009;373(9669):1083–96.127. Stevens J, Cai J, Pamuk ER, Williamson DF, Thun MJ, Wood JL. The effect of age on the associationbetween body-mass index and mortality. N Engl J Med 1998;338(1):1–7.128. Diehr P, O’Meara ES, Fitzpatrick A, Newman AB, Kuller L, Burke G. Weight, mortality, years of healthylife, and active life expectancy in older adults. J Am Geriatr Soc 2008;56(1):76–83.129. National <strong>Eat</strong>ing Disorders Collaboration. <strong>Eat</strong>ing disorders- prevention, treatment and management:an evidence review. 2010.130. Denney-Wilson E, Hardy LL, Dobbins T, Okely AD, Baur LA. Body mass index, waist circumference, andchronic disease risk factors in Australian adolescents. Arch Pediatr Adolesc Med 2008;162(6):566–73.ReferencesNational <strong>Health</strong> and Medical Research Council159
131. Clarke PJ, O’Malley PM, Schulenberg JE, Johnston LD. Midlife health and socioeconomic consequencesof persistent overweight across early adulthood: findings from a national survey of American adults(1986-2008). Am J Epidemiol 2010;172(5):540–8.132. Biro FM, Wien M. Childhood obesity and adult morbidities. Am J Clin Nutr 2010;91(5):1499S–505S.133. Oates RK. Non-organic failure to thrive. Aust Paediatr J 1984;20(2):95–100.134. Pugliese MT, Weyman-Daum M, Moses N, Lifshitz F. Parental health beliefs as a cause of nonorganicfailure to thrive. Pediatrics 1987;80(2):175–82.135. Stubbs CO, Lee AJ. The obesity epidemic: both energy intake and physical activity contribute.Med J Aust 2004;181(9):489–91.136. Bensimhon DR, Kraus WE, Donahue MP. Obesity and physical activity: a review. Am Heart J2006;151(3):598–603.137. Haskell WL, Lee IM, Pate RR, Powell KE, Blair SN, Franklin BA et al. Physical activity and public health:updated recommendation for adults from the American College of Sports Medicine and the AmericanHeart Association. Circulation 2007;116(9):1081–93.138. Swinburn B, Egger G. The runaway weight gain train: too many accelerators, not enough brakes.Br Med J 2004;329(7468):736–9.139. Swinburn B, Sacks G, Ravussin E. Increased food energy supply is more than sufficient to explain theUS epidemic of obesity. Am J Clin Nutr 2009;90(6):1453–6.140. Swinburn BA, Caterson I, Seidell JC, James WP. Diet, nutrition and the prevention of excess weight gainand obesity. Public <strong>Health</strong> Nutr 2004;7(1A):123–46.141. Sacks G, Swinburn BA, Lawrence MA. A systematic policy approach to changing the food system andphysical activity environments to prevent obesity. Aust NZ <strong>Health</strong> Policy 2008;5:13.142. Drewnowski A, Specter SE. Poverty and obesity: the role of energy density and energy costs.Am J Clin Nutr 2004;79(1):6–16.143. Badland H, Schofield G. Transport, urban design, and physical activity: an evidence-based update.Transport Res 2005;10(3):177–96.144. Jackson RJ, Kochtitzky C. Creating a healthy environment: the impact of the built environment on publichealth. Washington DC.: Sprawl Watch, 2001. Available from: http://www.sprawlwatch.org/health.pdf145. Oliver LN, Hayes MV. Neighbourhood socio-economic status and the prevalence of overweight Canadianchildren and youth. Can J Public <strong>Health</strong> 2005;96(6):415–20.146. Gill T, King L, Webb K. Best options for promoting healthy weight and preventing weight gain in NSW.Sydney: NSW Centre for Public <strong>Health</strong> Nutrition, 2005. Available from: http://sydney.edu.au/science/molecular_bioscience/cphn/pdfs/healthy_weight_report.pdf147. Kumanyika SK. The obesity epidemic: looking in the mirror. Am J Epidemiol 2007;166(3):243–5.148. Ebbeling CB, Pawlak DB, Ludwig DS. Childhood obesity: public-health crisis, common sense cure.Lancet 2002;360(9331):473–82.149. McLaren L. Socioeconomic status and obesity. Epidemiol Rev 2007;29:29–48.150. Papas MA, Alberg AJ, Ewing R, Helzlsouer KJ, Gary TL, Klassen AC. The built environment and obesity.Epidemiol Rev 2007;29:129–43.151. National Obesity Taskforce. <strong>Health</strong>y weight 2008 - Australia’s future - The national action agenda forchildren and young people and their families. Canberra: Commonwealth of Australia; 2003.152. Cook T, Rutishauser I, Seelig M. Comparable data on food and nutrient intake and physical measurementsfrom the 1983, 1985 and 1995 national nutrition surveys. Canberra: Commonwealth of Australia, 2001.http://www.health.gov.au/internet/main/publishing.nsf/Content/6A40E29D690738DECA25725F00810008/$File/nutrient.pdf160EAT FOR HEALTH – australian dietary guidelinesNational <strong>Health</strong> and Medical Research Council
153. Rangan AM, Schindeler S, Hector DJ, Gill TP, Webb KL. Consumption of ‘extra’ foods by Australian adults:types, quantities and contribution to energy and nutrient intake. Eur J Clin Nutr 2009;63(Oct 29):865-71.154. Stubbs CO. Determinants of the global obesity epidemic: Contributions of early life, nutrition, physicalactivity, television, smoking and economic and social change. In: Melrose LA, ed. New developments inobesity research. New York: Nova Publishers, 2006: 121–52.155. Prentice AM, Black AE, Coward WA, Cole TJ. Energy expenditure in overweight and obese adults inaffluent societies: an analysis of 319 doubly-labelled water measurements. Eur J Clin Nutr 1996;50(2):93–7.156. Gebel K, King L, Bauman A, Vita P, Gill T, Rigby A et al. Creating healthy environments: A review of linksbetween the physical environment, physical activity and obesity. Sydney: NSW <strong>Health</strong> Department andNSW Centre for Overweight and Obesity, 2005.157. Armstrong T, Bauman A, Davies J. Physical activity patterns of Australian adults. Results of the 1999National Physical Activity Survey. Canberra: Australian Institute of <strong>Health</strong> and Welfare, 2000. Availablefrom: http://www.aihw.gov.au/publication-detail/?id=6442467175158. Queensland <strong>Health</strong>. The health of Queenslanders 2006. Report of the Chief <strong>Health</strong> Officer, Queensland.Brisbane Queensland <strong>Health</strong>; 2006.159. Centre for Epidemiology and Research. The health of the people of New South Wales - Report of the Chief<strong>Health</strong> Officer. Summary report, 2010. Sydney: NSW Department of <strong>Health</strong>, 2010. http://www.health.nsw.gov.au/publichealth/chorep/160. Booth ML, Chey T, Wake M, Norton K, Hesketh K, Dollman J et al. Change in the prevalence of overweightand obesity among young Australians, 1969-1997. Am J Clin Nutr 2003;77(1):29–36.161. Booth ML, Denney-Wilson E, Okely AD, Hardy LL. Methods of the NSW Schools Physical Activity andNutrition Survey (SPANS). J Sci Med Sport 2005;8(3):284–93.162. Abbott RA, Macdonald D, Mackinnon L, Stubbs CO, Lee AJ, Harper C et al. <strong>Health</strong>y Kids QueenslandSurvey 2006 — Summary Report. Brisbane: Queensland <strong>Health</strong>, 2007.163. Bauman A, Bellew B, Vita P, Brown W, Owen N. Getting Australia active: Towards better practice for thepromotion of physical activity. Melbourne: National Public <strong>Health</strong> Partnership, 2002. Available from:http://fulltext.ausport.gov.au/fulltext/2002/nphp/gaa.asp164. Woodcock J, Franco OH, Orsini N, Roberts I. Non-vigorous physical activity and all-cause mortality:systematic review and meta-analysis of cohort studies. Int J Epidemiol 2011;40(1):121–38.165. Janssen I, Leblanc AG. Systematic review of the health benefits of physical activity and fitness inschool-aged children and youth. Int J Behav Nutr Phys Act 2010;7:40.166. Warburton DE, Nicol CW, Bredin SS. <strong>Health</strong> benefits of physical activity: the evidence. Can Med AssocJ 2006;174(6):801–9.167. Brown WJ, Mishra G, Lee C, Bauman A. Leisure time physical activity in Australian women: relationshipwith well being and symptoms. Res Q Exerc Sport 2000;71(3):206–16.168. Nelson MC, Gordon-Larsen P. Physical activity and sedentary behavior patterns are associated withselected adolescent health risk behaviors. Pediatrics 2006;117(4):1281–90.169. Commonwealth Department of <strong>Health</strong> and Ageing. Measure up - weight and waist measurements. 2010(cited 27 March 2011). http://www.health.gov.au/internet/abhi/publishing.nsf/Content/Weight,+waist+circumference+and+BMI-lp.http://www.patonsyarns.com/pattern.ph170. Dunstan D, Zimmet P, Welborn T, Sicree R, Armstrong T, Atkins R et al. Diabesity and associated disordersin Australia - 2000. Melbourne: International Diabetes Institute, 2001. Available from: http://www.diabetes.com.au/pdf/AusDiab_Report.pdf171. Orozco Leonardo J, Buchleitner Ana M, Gimenez-Perez G, Roqué i Figuls M, Richter B, Mauricio D.Exercise or exercise and diet for preventing type 2 diabetes mellitus. Cochrane Database Syst Rev 2008(3).ReferencesNational <strong>Health</strong> and Medical Research Council161
172. Kamath CC, Vickers KS, Ehrlich A, McGovern L, Johnson J, Singhal V et al. Clinical review: behavioralinterventions to prevent childhood obesity: a systematic review and metaanalyses of randomized trials.J Clin Endocrinol Metab 2008;93(12):4606–15.173. Campbell KJ, Hesketh KD. Strategies which aim to positively impact on weight, physical activity, diet andsedentary behaviours in children from zero to five years. A systematic review of the literature. Obes Rev2007;8(4):327–38.174. Summerbell CD, Waters E, Edmunds L, Kelly SAM, Brown T, Campbell KJ. Interventions for preventingobesity in children. Cochrane Database Syst Rev 2005(3).175. Stice E, Shaw H, Marti CN. A meta-analytic review of obesity prevention programs for children andadolescents: the skinny on interventions that work. Psychol Bull 2006(5):667–91.176. Gilles A, Cassano M, Shepherd EJ, Higgins D, Hecker JE, Nangle DW. Comparing active pediatric obesitytreatments using meta-analysis. J Clin Child Adolesc Psychol 2008;37(4):886–92.177. Young KM, Northern JJ, Lister KM, Drummond JA, O’Brien WH. A meta-analysis of family-behavioralweight-loss treatments for children. Clin Psychol Rev 2007;27(2):240–9.178. Berry D, Sheehan R, Heschel R, Knafl K, Melkus G, Grey M. Family-based interventions for childhoodobesity: a review. J Family Nursing 2004;10(4):429.179. Kelly SA, Melnyk BM. Systematic review of multicomponent interventions with overweight middleadolescents: implications for clinical practice and research. Worldviews Evid Based Nurs 2008;5(3):113–35.180. Doak CM, Visscher TL, Renders CM, Seidell JC. The prevention of overweight and obesity in children andadolescents: a review of interventions and programmes. Obes Rev 2006;7(1):111–36.181. Cole K, Waldrop J, D’Auria J, Garner H. An integrative research review: effective school-based childhoodoverweight interventions. J Spec Pediatr Nurs 2006;11(3):166–77.182. Oude Luttikhuis H, Baur L, Jansen H, Shrewsbury VA, O’Malley C, Stolk RP et al. Interventions for treatingobesity in children. Cochrane Database Syst Rev 2009(1):CD001872.183. Waters E, de Silva-Sanigorski A, Hall BJ, Brown T, Campbell KJ, Gao Y et al. Interventions for preventingobesity in children. Cochrane Database Syst Rev 2011(12):CD001871.184. Nations FaAOotU. Fats and fatty acids in human nutrition. Report of an expert consultation. Rome: Foodand Agriculture Organization of the United Nations, 2010.185. Dubois L, Farmer A, Girard M, Peterson K. Regular sugar-sweetened beverage consumption betweenmeals increases risk of overweight among preschool-aged children. J Am Diet Assoc 2007;107(6):924–34.186. Faith MS, Dennison BA, Edmunds LS, Stratton HH. Fruit juice intake predicts increased adiposity gainin children from low-income families: weight status-by-environment interaction. Pediatrics 2006;118(5):2066–75.187. <strong>For</strong>shee RA, Anderson PA, Storey ML. Sugar-sweetened beverages and body mass index in children andadolescents: a meta-analysis. Am J Clin Nutr 2008;87(6):1662–71.188. Gibson S. Sugar-sweetened soft drinks and obesity: a systematic review of the evidence fromobservational studies and interventions. Nutr Res Rev 2008;21(2):134–47.189. Malik VS, Schulze MB, Hu FB. Intake of sugar-sweetened beverages and weight gain: a systematic review.Am J Clin Nutr 2006;84(2):274–88.190. Phillips SM, Bandini LG, Naumova EN, Cyr H, Colclough S, Dietz WH et al. Energy-dense snack food intakein adolescence: longitudinal relationship to weight and fatness. Obes Res 2004;12(3):461–72.191. Sichieri R, Paula Trotte A, de Souza RA, Veiga GV, Sichieri R, Paula Trotte A et al. School randomised trialon prevention of excessive weight gain by discouraging students from drinking sodas. Public <strong>Health</strong> Nutr2009;12(2):197–202.162EAT FOR HEALTH – australian dietary guidelinesNational <strong>Health</strong> and Medical Research Council
192. Stookey JD, Constant F, Gardner CD, Popkin BM. Replacing sweetened caloric beverages with drinkingwater is associated with lower energy intake. Obesity (Silver Spring) 2007;15(12):3013–22.193. Tam CS, Garnett SP, Cowell CT, Campbell K, Cabrera G, Baur LA. Soft drink consumption and excessweight gain in Australian school students: results from the Nepean study. Int J Obesity 2006;30(7):1091–3.194. Taylor RW, McAuley KA, Barbezat W, Strong A, Williams SM, Mann JI. APPLE Project: 2-y findingsof a community-based obesity prevention program in primary school age children. Am J Clin Nutr2007;86(3):735–42.195. Vartanian LR, Schwartz MB, Brownell KD. Effects of soft drink consumption on nutrition and health:a systematic review and meta-analysis. Am J Public <strong>Health</strong> 2007;97(4):667–75.196. Wolff E, Dansinger ML. Soft drinks and weight gain: how strong is the link? Medscape J Med2008;10(8):189.197. Fiorito LM, Marini M, Francis LA, Smiciklas-Wright H, Birch LL. Beverage intake of girls at age 5 y predictsadiposity and weight status in childhood and adolescence. Am J Clin Nutr 2009;90(4):935–42.198. U.S. Department of Agriculture and U.S. Department of <strong>Health</strong> and Human Services. <strong>Dietary</strong> guidelinesfor Americans, 2010. 7th Edition ed. Washington, DC: U.S. Government Printing Office; 2010.199. Vrolix R MR. Variability of the glycemic response to single food products in healthy subjects.Contemporary Clinical Trials 2010;31(1):5-11.200. Field AE, Gillman MW, Rosner B, Rockett HR, Colditz GA. Association between fruit and vegetable intakeand change in body mass index among a large sample of children and adolescents in the United States.Int J Obes Relat Metab Disord 2003;27(7):821–6.201. Sartorelli DS, Franco LJ, Cardoso MA, Sartorelli DS, Franco LJ, Cardoso MA. High intake of fruits andvegetables predicts weight loss in Brazilian overweight adults. Nutr Res 2008;28(4):233–8.202. te Velde SJ, Twisk JW, Brug J, te Velde SJ, Twisk JWR, Brug J. Tracking of fruit and vegetableconsumption from adolescence into adulthood and its longitudinal association with overweight Br J Nutr2007;98(2):431–8.203. Vioque J, Weinbrenner T, Castello A, Asensio L, de la Hera MG. Intake of fruits and vegetables in relationto 10-year weight gain among Spanish adults. Obesity (Silver Spring) 2008;16(3):664–70.204. Booth A, Nowson C, Worsley A, Margerison C, Jorna M. <strong>Dietary</strong> approaches for weight loss withincreased intakes of fruit, vegetables and dairy products. Nutr Diet 2008;65(2):115–20.205. Conceição de Oliveira M, Sichieri R, Sanchez Moura A. Weight loss associated with a daily intake of threeapples or three pears among overweight women. Nutrition 2003;19(3):253–56.206. Drapeau V, Despres JP, Bouchard C, Allard L, Fournier G, Leblanc C et al. Modifications in food-groupconsumption are related to long-term body-weight changes. Am J Clin Nutr 2004;80(1):29–37.207. He K, Hu FB, Colditz GA, Manson JE, Willett WC, Liu S. Changes in intake of fruits and vegetables inrelation to risk of obesity and weight gain among middle-aged women. Int J Obes Relat Metab Disord2004;28(12):1569–74.208. Rodriguez MC, Parra MD, Marques-Lopes I, De Morentin BE, Gonzalez A, Martinez JA. Effects of twoenergy-restricted diets containing different fruit amounts on body weight loss and macronutrient oxidation.Plant Foods Hum Nutr 2005;60(4):219–24.209. Barr SI. Increased dairy product or calcium intake: is body weight or composition affected in humans?J Nutr 2003;133(1):245S–48S.210. Lanou AJ, Barnard ND. Dairy and weight loss hypothesis: an evaluation of the clinical trials. Nutr Rev2008;66(5):272–79.211. Rajpathak SN, Rimm EB, Rosner B, Willett WC, Hu FB. Calcium and dairy intakes in relation to long-termweight gain in US men. Am J Clin Nutr 2006;83(3):559–66.ReferencesNational <strong>Health</strong> and Medical Research Council163
212. Wagner G, Kindrick S, Hertzler S, DiSilvestro RA, Wagner G, Kindrick S et al. Effects of various forms ofcalcium on body weight and bone turnover markers in women participating in a weight loss program.J Am Coll Nutr 2007;26(5):456–61.213. Pereira MA, Jacobs DR, Jr., Van Horn L, Slattery ML, Kartashov AI, Ludwig DS. Dairy consumption,obesity, and the insulin resistance syndrome in young adults: the CARDIA Study. J Am Med Assoc2002;287(16):2081–9.214. Rosell M, Hakansson NN, Wolk A. Association between dairy food consumption and weight change over9 y in 19,352 perimenopausal women. Am J Clin Nutr 2006;84(6):1481–8.215. Huus K, Brekke HK, Ludvigsson JF, Ludvigsson J, Huus K, Brekke HK et al. Relationship of foodfrequencies as reported by parents to overweight and obesity at 5 years. Acta Paediatr 2009;98(1):139–43.216. Johnson L, Wilks DC, Lindroos AK, Jebb SA. Reflections from a systematic review of dietary energydensity and weight gain: is the inclusion of drinks valid?. [Review] [62 refs]. Obesity Reviews2009;10(6):681–92.217. Newby PK, Peterson KE, Berkey CS, Leppert J, Willett WC, Colditz GA. Beverage consumption is notassociated with changes in weight and body mass index among low-income preschool children in NorthDakota. J Am Diet Assoc 2004;104(7):1086–94.218. Striegel-Moore RH, Thompson D, Affenito SG, Franko DL, Obarzanek E, Barton BA et al. Correlates ofbeverage intake in adolescent girls: the National Heart, Lung, and Blood Institute Growth and <strong>Health</strong>Study. J Pediatr 2006;148(2):183–7.219. Berkey CS, Rockett HR, Willett WC, Colditz GA. Milk, dairy fat, dietary calcium, and weight gain:a longitudinal study of adolescents. Arch Pediatr Adolesc Med 2005;159(6):543–50.220. De La Hunty A, Ashwell M. Are people who regularly eat breakfast cereals slimmer than those who don’t?A systematic review of the evidence. Nutrition Bulletin 2007;32(2):118–28.221. Gilhooly CH, Das SK, Golden JK, McCrory MA, Rochon J, DeLany JP et al. Use of cereal fiber to facilitateadherence to a human caloric restriction program. Aging Clin Exp Res 2008;20(6):513–20.222. Hallfrisch J, Scholfield DJ, Behall KM. Blood pressure reduced by whole grain diet containing barley orwhole wheat and brown rice in moderately hypercholesterolemic men. Nutr Res 2003;23(12):1631–42.223. Hamedani A, Akhavan T, Samra RA, Anderson GH, Hamedani A, Akhavan T et al. Reduced energy intakeat breakfast is not compensated for at lunch if a high-insoluble-fiber cereal replaces a low-fiber cereal.Am J Clin Nutr 2009;89(5):1343–49.224. Lightowler HJ, Henry CJK. An investigation of the effectiveness of ready-to-eat breakfast cereals inweight loss: comparison between single and mixed varieties. Nutrition Bulletin 2009;34(1):48–53.225. Ortega RM, Andres P, Lopez-Sobaler AM, Rodriguez-Rodriguez E, Aparicio A, Bermejo LM et al. Changesin thiamin intake and blood levels in young, overweight/obese women following hypocaloric diets basedon the increased relative consumption of cereals or vegetables. Eur J Clin Nutr 2007;61(1):77–82.226. Ortega RM, Rodriguez-Rodriguez E, Aparicio A, Marin-Arias LI, Lopez-Sobaler AM, Ortega RM et al.Responses to two weight-loss programs based on approximating the diet to the ideal: differencesassociated with increased cereal or vegetable consumption. Int J Vitamin Nutrition Res 2006;76(6):367–76.227. Rodriguez-Rodriguez E, Aparicio A, Bermejo LM, Lopez-Sobaler AM, Ortega RM, Rodriguez-Rodriguez Eet al. Changes in the sensation of hunger and well-being before and after meals in overweight/obesewomen following two types of hypoenergetic diet. Public <strong>Health</strong> Nutr 2009;12(1):44–50.228. Waller SM, Vander Wal JS, Klurfeld DM, McBurney MI, Cho S, Bijlani S et al. Evening ready-to-eat cerealconsumption contributes to weight management. J Am Coll Nutr 2004;23(4):316–21.229. Williams PG, Grafenauer SJ, O’Shea JE, Williams PG, Grafenauer SJ, O’Shea JE. Cereal grains, legumes,and weight management: a comprehensive review of the scientific evidence. Nutr Rev 2008;66(4):171–82.230. Fraser GE, Bennett HW, Jaceldo KB, Sabate J. Effect on body weight of a free 76 kilojoule (320 calorie)daily supplement of almonds for six months. J Am Coll Nutr 2002;21(3):275.164EAT FOR HEALTH – australian dietary guidelinesNational <strong>Health</strong> and Medical Research Council
231. Hyson DA, Schneeman BO, Davis PA. Almonds and almond oil have similar effects on plasma lipids andLDL oxidation in healthy men and women. J Nutr 2002;132(4):703.232. Kocyigit A, Koylu AA, Keles H. Effects of pistachio nuts consumption on plasma lipid profile and oxidativestatus in healthy volunteers. Nutr Metab Cardiovasc Dis 2006;16(3):202–09.233. Sabate J. Nut consumption and change in weight: the weight of the evidence. Br J Nutr 2007;98(3):456–7.234. Sabate J, Haddad E, Tanzman JS, Jambazian P, Rajaram S. Serum lipid response to the graduatedenrichment of a Step I diet with almonds: a randomized feeding trial. Am J Clin Nutr 2003;77(6):1379–84.235. Spaccarotella KJ, Kris-Etherton PM, Stone WL, Bagshaw DM, Fishell VK, West SG et al. The effect ofwalnut intake on factors related to prostate and vascular health in older men. Nutr J 2008;7:13.236. Hite AH, Feinman RD, Guzman GE, Satin M, Schoenfeld PA, Wood RJ. In the face of contradictoryevidence: report of the <strong>Dietary</strong> <strong>Guidelines</strong> for Americans Committee. Nutrition 2010;26(10):915–24.237. Owen CG, Martin RM, Whincup PH, Smith GD, Cook DG. Effect of infant feeding on the risk of obesityacross the life course: a quantitative review of published evidence. Pediatrics 2005;115(5):1367–77.238. Araujo CL, Hallal PC, Nader GA, Neutzling MB, deFatima Vieira M, Menezes AM et al. Effect of birth sizeand proportionality on BMI and skinfold thickness in early adolescence: prospective birth cohort study.Eur J Clin Nutr 2009;63(5):634–9.239. Kuh D, Hardy R, Chaturvedi N, Wadsworth ME. Birth weight, childhood growth and abdominal obesity inadult life. Int J Obes Relat Metab Disord 2002;26(1):40–7.240. Monasta L, Batty GD, Cattaneo A, Lutje V, Ronfani L, Van Lenthe FJ et al. Early-life determinants ofoverweight and obesity: a review of systematic reviews. Obes Rev 2010;11(10):695–708.241. Monteiro PO, Victora CG. Rapid growth in infancy and childhood and obesity in later life--a systematicreview. Obes Rev 2005;6(2):143–54.242. Nader PR, O’Brien M, Houts R, Bradley R, Belsky J, Crosnoe R et al. Identifying risk for obesity in earlychildhood. Pediatrics 2006;118(3):e594–601.243. Mamun AA, Lawlor DA, Alati R, O’Callaghan MJ, Williams GM, Najman JM. Does maternal smokingduring pregnancy have a direct effect on future offspring obesity? Evidence from a prospective birthcohort study. Am J Epidemiol 2006;164(4):317–25.244. Landhuis CE, Poulton R, Welch D, Hancox RJ. Childhood sleep time and long-term risk for obesity:a 32-year prospective birth cohort study. Pediatrics 2008;122(5):955–60.245. Marshall SJ, Biddle SJ, Gorely T, Cameron N, Murdey I. Relationships between media use, body fatnessand physical activity in children and youth: a meta-analysis. [Review] [76 refs]. Int J Obes Relat MetabDis 2004;28(10):1238–46.246. Rey-Lopez JP, Vicente-Rodriguez G, Biosca M, Moreno LA. Sedentary behaviour and obesity developmentin children and adolescents. Nutr Metab Cardiovasc Dis 2008;18(3):242–51.247. Biddle SJ, Gorely T, Marshall SJ, Murdey I, Cameron N. Physical activity and sedentary behaviours inyouth: issues and controversies. J R Soc Promot <strong>Health</strong> 2004;124(1):29–33.248. Coon KA, Tucker KL. Television and children’s consumption patterns: a review of the literature. MinervaPediatr 2002;54(5):423–36.249. Goldani MZ, Haeffner LS, Agranonik M, Barbieri MA, Bettiol H, Silva AA. Do early life factors influencebody mass index in adolescents? Braz J Med Biol Res 2007;40(9):1231–6.250. Langenberg C, Hardy R, Kuh D, Brunner E, Wadsworth M. Central and total obesity in middle agedmen and women in relation to lifetime socioeconomic status: evidence from a national birth cohort.J Epidemiol Community <strong>Health</strong> 2003;57(10):816–22.ReferencesNational <strong>Health</strong> and Medical Research Council165
251. Power C, Atherton K, Strachan DP, Shepherd P, Fuller E, Davis A et al. Life-course influences on healthin British adults: effects of socio-economic position in childhood and adulthood. Int J Epidemiol2007;36(3):532–9.252. Wright CM, Parker L. <strong>For</strong>ty years on: the effect of deprivation on growth in two Newcastle birth cohorts.Int J Epidemiol 2004;33(1):147–52.253. Jyoti DF, Frongillo EA, Jones SJ. Food insecurity affects school children’s academic performance, weightgain, and social skills. J Nutr 2005;135(12):2831–9.254. Senf JH, Shisslak CM, Crago MA. Does dieting lead to weight gain? A four-year longitudinal study ofmiddle school girls. Obesity 2006;14(12):2236–41.255. Field AE, Austin SB, Taylor CB, Malspeis S, Rosner B, Rockett HR et al. Relation between dieting andweight change among preadolescents and adolescents. Pediatrics 2003;112(4):900–6.256. Mamun AA, Lawlor DA, Cramb S, O’Callaghan M, Williams G, Najman J. Do childhood sleeping problemspredict obesity in young adulthood? Evidence from a prospective birth cohort study. Am J Epidemiol2007;166(12):1368–73.257. Taveras EM, Rifas-Shiman SL, Oken E, Gunderson EP, Gillman MW. Short sleep duration in infancy andrisk of childhood overweight. Arch Pediatr Adolesc Med 2008;162(4):305–11.258. Timlin MT, Pereira MA, Story M, Neumark-Sztainer D. Breakfast eating and weight change in a 5-yearprospective analysis of adolescents: Project EAT (<strong>Eat</strong>ing Among Teens). Pediatrics 2008;121(3):e638–45.259. Astrup A, Grunwald GK, Melanson EL, Saris WH, Hill JO. The role of low-fat diets in body weight control:a meta-analysis of ad libitum dietary intervention studies. Int J Obes Relat Metab Disord 2000;24(12):1545–52.260. Willett WC, Leibel RL. <strong>Dietary</strong> fat is not a major determinant of body fat. Am J Med 2002;113(Suppl9B):47S–59S.261. Prentice AM, Jebb SA. Fast foods, energy density and obesity: a possible mechanistic link. Obes Rev2003;4(4):187–94.262. McCrory MA, Saltzman E, Rolls BJ, Roberts SB. A twin study of the effects of energy density andpalatability on energy intake of individual foods. Physiol Behav 2006;87(3):451–9.263. Paddon-Jones D, Westman E, Mattes RD, Wolfe RR, Astrup A, Westerterp-Plantenga M. Protein,weight management, and satiety. Am J Clin Nutr 2008;87(5):1558S–61S.264. Drewnowski A, Darmon N. The economics of obesity: dietary energy density and energy cost.Am J Clin Nutr 2005;82(1 Suppl):265S–73S.265. Bowman SA, Gortmaker SL, Ebbeling CB, Pereira MA, Ludwig DS. Effects of fast-food consumptionon energy intake and diet quality among children in a national household survey. Pediatrics 2004;113(1 Pt 1):112–8.266. Pereira MA, Kartashov AI, Ebbeling CB, Van Horn L, Slattery ML, Jacobs DR, Jr. et al. Fast-foodhabits, weight gain, and insulin resistance (the CARDIA study): 15-year prospective analysis. Lancet2005;365(9453):36–42.267. Ledikwe JH, Ello-Martin JA, Rolls BJ. Portion sizes and the obesity epidemic. J Nutr 2005;135(4):905–9.268. Cameron-Smith D, Bilsborough SA, Crowe TC. Upsizing Australia’s waistline: the dangers of “meal deals”.Med J Aust 2002;177(11-12):2–16.269. Franz MJ, VanWormer JJ, Crain AL, Boucher JL, Histon T, Caplan W et al. Weight-loss outcomes:a systematic review and meta-analysis of weight-loss clinical trials with a minimum 1-year follow-up.J Am Diet Assoc 2007;107(10):1755–67.270. Goodpaster BH, Delany JP, Otto AD, Kuller L, Vockley J, South-Paul JE et al. Effects of diet and physicalactivity interventions on weight loss and cardiometabolic risk factors in severely obese adults: a randomizedtrial. J Am Med Assoc 2010;304(16):1795–802.166EAT FOR HEALTH – australian dietary guidelinesNational <strong>Health</strong> and Medical Research Council
271. Marks GC, Coyne C, Pang G. Type 2 diabetes costs in Australia - the potential impact of changes in diet,physical activity and levels of obesity. Brisbane: Australian Food and Nutrition Modelling Unit, 2001.Available from: http://www.health.gov.au/internet/main/publishing.nsf/Content/health-pubhlth-strategfood-pdf-diabetes-cnt.htm272. National Public <strong>Health</strong> Partnership. Be active Australia: A framework for health sector action for physicalactivity 2005–2010. In: Department of Human Services V, editor. Melbourne: National Public <strong>Health</strong>Partnership; 2005.273. Hu FB, Li TY, Colditz GA, Willett WC, Manson JE. Television watching and other sedentary behaviors inrelation to risk of obesity and type 2 diabetes mellitus in women. J Am Med Assoc 2003;289(14):1785–91.274. Martinez-Gonzalez MA, Martinez JA, Hu FB, Gibney MJ, Kearney J. Physical inactivity, sedentary lifestyleand obesity in the European Union. Int J Obes Relat Metab Disord 1999;23(11):1192–201.275. Brown WJ, Miller YD, Miller R. Sitting time and work patterns as indicators of overweight and obesity inAustralian adults. Int J Obesity Relat Metabol Dis 2003;27(11):1340–6.276. Saris WH, Blair SN, van Baak MA, <strong>Eat</strong>on SB, Davies PS, Di Pietro L et al. How much physical activity isenough to prevent unhealthy weight gain? Outcome of the IASO 1st Stock Conference and consensusstatement. Obes Rev 2003;4(2):101–14.277. Blair SN, LaMonte MJ, Nichaman MZ. The evolution of physical activity recommendations: how much isenough? Am J Clin Nutr 2004;79(5).278. Petersen L, Schnohr P, Sørensen T. Longitudinal study of the long-term relation between physical activityand obesity in adults. Int J Obes 2003;28(1):105–12.279. Schoeller DA. But how much physical activity? Am J Clin Nutr 2003;78(4):669–70.280. Martinez-Gomez D, Ruiz JR, Ortega FB, Veiga OL, Moliner-Urdiales D, Mauro B et al. Recommended levelsof physical activity to avoid an excess of body fat in European adolescents: the HELENA Study. Am J PrevMed 2010;39(3):203–11.281. Caterson ID, Finer N. Emerging pharmacotherapy for treating obesity and associated cardiometabolic risk.Asia Pacific 2006;15:55–62.282. Callaway LK, O’Callaghan MJ, McIntyre HD. Barriers to addressing overweight and obesity beforeconception. Med J Aust 2009;191(8):425–28.283. Mamun AA, Kinarivala M, O’Callaghan MJ, Williams GM, Najman JM, Callaway LK. Associations of excessweight gain during pregnancy with long-term maternal overweight and obesity: evidence from 21 ypostpartum follow-up. Am J Clin Nutr 2010;91(5):1336–41.284. Dodd JM, Grivell RM, Crowther CA, Robinson JS. Antenatal interventions for overweight or obesepregnant women: a systematic review of randomised trials: a systematic review of randomised trials.BJOG 2010;117(11):1316–26.285. Callaway LK, Prins JB, Chang AM, McIntyre HD. The prevalence and impact of overweight and obesity inan Australian obstetric population. Med J Aust 2006;184(2):56–9.286. Budge H, Gnanalingham MG, Gardner DS, Mostyn A, Stephenson T, Symonds ME. Maternal nutritionalprogramming of fetal adipose tissue development: long-term consequences for later obesity. Birth DefectsRes 2005;75(3):193–9.287. Boney CM, Verma A, Tucker R, Vohr BR. Metabolic syndrome in childhood: association with birth weight,maternal obesity, and gestational diabetes mellitus. Pediatrics 2005;115(3):e290–6.288. Institute of Medicine. Preventing childhood obesity: <strong>Health</strong> in the balance. Washington DC: Institute ofMedicine of the National Academies, 2005.289. Institute of Medicine NRC. Weight Gain During Pregnancy: Reexamining the <strong>Guidelines</strong>. Washington,DC: The National Academies Press, 2009.ReferencesNational <strong>Health</strong> and Medical Research Council167
290. Fraser A, Tilling K, Macdonald-Wallis C, Hughes R, Sattar N, Nelson SM et al. Associations of gestationalweight gain with maternal body mass index, waist circumference, and blood pressure measured 16 y afterpregnancy: the Avon Longitudinal Study of Parents and Children. Am J Clin Nutr 2011.291. Kinnunen TI, Pasanen M, Aittasalo M, Fogelholm M, Weiderpass E, Luoto R. Reducing postpartum weightretention--a pilot trial in primary health care. Nutr J 2007;6:21.292. Harding JE. The nutritional basis of the fetal origins of adult disease. Int J Epidemiol 2001;30(1):15.293. Makrides M. Early childhood nutrition and cognitive outcome. Proc Nutr Soc Aust 1998;22:216–22.294. Cooper C, Fall C, Egger P, Hobbs R, Eastell R, Barker D. Growth in infancy and bone mass in later life.Ann Rheum Dis 1997;56(1):17–21.295. National <strong>Health</strong> and Medical Research Council. Infant Feeding <strong>Guidelines</strong>. Canberra: Commonwealth ofAustralia; 2012.296. Evans WJ. Effects of aging and exercise on nutrition needs of the elderly. Nutr Rev 1996;54(1 Pt 2):S35–9.297. Nelson ME, Rejeski WJ, Blair SN, Duncan PW, Judge JO, King AC et al. Physical activity and public healthin older adults: recommendation from the American College of Sports Medicine and the American HeartAssociation. Circulation 2007;116(9):1094–105.298. Department of <strong>Health</strong> and Ageing. Physical activity guidelines. 2010 (cited 30 March 2011).http://www.health.gov.au/internet/main/publishing.nsf/content/health-pubhlth-strateg-phys-act-guidelines.http://www.patonsyarns.com/pattern.ph299. Gregg EW, Pereira MA, Caspersen CJ. Physical activity, falls, and fractures among older adults: a reviewof the epidemiologic evidence. J Am Geriatr Soc 2000;48(8):883–93.300. Kujala UM, Kaprio J, Kannus P, Sarna S, Koskenvuo M. Physical activity and osteoporotic hip fracture riskin men. Arch Intern Med 2000;160(5):705–8.301. Glass TA, De Leon CM, Marottoli RA, Berkman LF. Population based study of social and productiveactivities as predictors of survival among elderly Americans. Br Med J 1999;319(7208):478.302. Truswell AS. <strong>Dietary</strong> guidance for older Australians. Nutr Diet 2009;66(4):243–48.303. Nowson C. Nutritional challenges in the elderly. Australian Doctor 2009(27 March):25–30.304. Corrada MM, Kawas CH, Mozaffar F, Paganini-Hill A. Association of body mass index and weight changewith all-cause mortality in the elderly. Am J Epidemiol 2006;163(10):938–49.305. Strandberg TE, Pitkala KH. Frailty in elderly people. Lancet 2007;369(9570):1328–9.306. Wahlqvist ML, Kouris-Blazos A, Ross K, Setter T, Tienboon T. Growth and Ageing. In: Nutrition andMetabolism. M Gibney, editor. Oxford: British Nutrition Society, 2002.307. Leggo M, Banks M, Isenring E, Stewart L, Tweeddale M. A quality improvement nutrition screening andintervention program available to Home and Community Care eligible clients. Nutr Diet 2008;65(2):162–67.308. Banks M, Ash S, Bauer J, Gaskill D. Prevalence of malnutrition in adults in Queensland public hospitalsand residential aged care facilities. Nutr Diet 2007;64(3):172–78.309. Morley JE, van Staveren WA. Undernutrition: diagnosis, causes, consequences and treatment. In: RaatsM, de Groot L, van Staveren WA, eds. Food for the ageing population. Cambridge: Woodhead PublishingLimited, 2009.310. Cunningham J, Mackerras D. Occasional paper - Overweight and obesity Indigenous Australians 1994.Canberra: Australian Bureau of Statistics, 1998. http://www.abs.gov.au/AUSSTATS/abs@.nsf/DetailsPage/4702.01994?OpenDocument311. O’Dea K. Body fat distribution and health outcome in Australian Aborigines. Proc Nutr Soc Aust1987;12:56–65.168EAT FOR HEALTH – australian dietary guidelinesNational <strong>Health</strong> and Medical Research Council
312. Cunningham J, O’Dea K, Dunbar T, Maple Brown L. Perceived weight versus Body Mass Index amongurban Aboriginal Australians: do perceptions and measurements match? Aust N Z J Public <strong>Health</strong>2008;32(2):135–38.313. Australian Institute of <strong>Health</strong> and Welfare. Aboriginal and Torres Strait Islander <strong>Health</strong> PerformanceFramework, 2008 report: Detailed analyses. Canberra: Australian Institute of <strong>Health</strong> and Welfare, 2008.314. Turrell G, Hewitt B, Patterson C, Oldenburg B, Gould T. Socioeconomic differences in food purchasingbehaviour and suggested implications for diet-related health promotion. J Hum Nutr Diet 2002;15(5):355–64.315. Maillot M, Darmon N, Darmon M, Lafay L, Drewnowski A. Nutrient-dense food groups have high energycosts: an econometric approach to nutrient profiling. J Nutr 2007;137(7):1815.316. Kettings C, Sinclair AJ, Voevodin M. A healthy diet consistent with Australian health recommendations istoo expensive for welfare dependent families. Aust N Z J Public <strong>Health</strong> 2009;33(6):566–72.317. Harrison M, Lee A, Findlay M, Nicholls R, Leonard D, Martin C. The increasing cost of healthy food.Aust N Z J Public <strong>Health</strong> 2010;34(2):179–86.318. Food Standards Australia New Zealand. The 22nd Australian Total Diet Study. Canberra, Australia andWellington, NZ: Food Standards Australia New Zealand, 2008. Available from: http://www.foodstandards.gov.au/scienceandeducation/publications/22ndaustraliantotaldietstudy/319. Commonwealth Department of <strong>For</strong>eign Affairs and Trade. Australia in brief: a diverse people. 2010(cited 29 March 2011). http://www.dfat.gov.au/aib/society.html.http://www.patonsyarns.com/pattern.ph320. Symons M. One continuous picnic : a gastronomic history of Australia. 2nd ed. Melbourne: MelbourneUniversity Press, 2007. http://www.loc.gov/catdir/toc/fy0709/2007386861.html321. Stanton RA. Nutrition problems in an obesogenic environment. Med J Aust 2006;184(2):76–9.322. Walker KZ, Woods JL, Rickard CA, Wong CK. Product variety in Australian snacks and drinks: how can theconsumer make a healthy choice? Public <strong>Health</strong> Nutr 2008;11(10):1046–53.323. National <strong>Health</strong> and Medical Research Council. Iodine supplementation for pregnant and breastfeedingwomen. Canberra: Commonwealth of Australia; 2010.324. Harriss LR, English DR, Powles J, Giles GG, Tonkin AM, Hodge AM et al. <strong>Dietary</strong> patterns andcardiovascular mortality in the Melbourne Collaborative Cohort Study. Am J Clin Nutr 2007;86(1):221–9.325. Jacques PF, Tucker KL. Are dietary patterns useful for understanding the role of diet in chronic disease?Am J Clin Nutr 2001;73(1):1–2.326. Kant AK, Schatzkin A, Graubard BI, Schairer C. A prospective study of diet quality and mortality in women.J Am Med Assoc 2000;283(16):2109–15.327. McCullough ML, Feskanich D, Stampfer MJ, Giovannucci EL, Rimm EB, Hu FB et al. Diet quality andmajor chronic disease risk in men and women: moving toward improved dietary guidance. Am J Clin Nutr2002;76(6):1261–71.328. Wahlqvist ML, Wattanapenpaiboon N, Kannar D, Dalais F, Kouris-Blazos A. Phytochemical deficiencydisorders: inadequate intake of protective foods. Curr Therapeut 1998;39(7):53–60.329. Van Dokkum W, Frølich W, Saltmarsh M, Gee J. The health effects of bioactive plant components in food:results and opinions of the EU COST 926 action. Nutrition Bulletin 2008;33(2):133–39.330. Dolan LC, Matulka RA, Burdock GA. Naturally occurring food toxins. Toxins 2010;2(9):2289–332.331. Gibson RS. The role of diet- and host-related factors in nutrient bioavailability and thus in nutrient-baseddietary requirement estimates. Food Nutr Bull 2007;28(1 Suppl International):S77–100.332. Lopez MA, Martos FC. Iron availability: an updated review. Int J Food Sci Nutr 2004;55(8):597–606.333. Russell RM. The vitamin A spectrum: from deficiency to toxicity. Am J Clin Nutr 2000;71(4):878–84.ReferencesNational <strong>Health</strong> and Medical Research Council169
334. Knudsen VK, Orozova-Bekkevold IM, Mikkelsen TB, Wolff S, Olsen SF. Major dietary patterns in pregnancyand fetal growth. Eur J Clin Nutr 2008;62(4):463–70.335. Rodriguez-Bernal CL, Rebagliato M, Iniguez C, Vioque J, Navarrete-Munoz EM, Murcia M et al. Diet qualityin early pregnancy and its effects on fetal growth outcomes: the Infancia y Medio Ambiente (Childhoodand Environment) Mother and Child Cohort Study in Spain. Am J Clin Nutr 2010;91(6):1659–66.336. Thompson JM, Wall C, Becroft DM, Robinson E, Wild CJ, Mitchell EA. Maternal dietary patterns inpregnancy and the association with small-for-gestational-age infants. Br J Nutr 2010;103(11):1665–73.337. Kinnunen TI, Pasanen M, Aittasalo M, Fogelholm M, Hilakivi-Clarke L, Weiderpass E et al. Preventingexcessive weight gain during pregnancy - a controlled trial in primary health care. Eur J Clin Nutr2007;61(7):884–91.338. Brantsæter AL, Haugen M, Samuelsen SO, Torjusen H, Trogstad L, Alexander J et al. A dietary patterncharacterized by high intake of vegetables, fruits, and vegetable oils is associated with reduced risk ofpreeclampsia in nulliparous pregnant Norwegian women. J Nutr 2009;139(6):1162.339. Rifas-Shiman SL, Rich-Edwards JW, Kleinman KP, Oken E, Gillman MW. <strong>Dietary</strong> quality during pregnancyvaries by maternal characteristics in Project Viva: a US cohort. J Am Diet Assoc 2009;109(6):1004–11.340. Radesky JS, Oken E, Rifas-Shiman SL, Kleinman KP, Rich-Edwards JW, Gillman MW. Diet during earlypregnancy and development of gestational diabetes. Paediatr Perinat Epidemiol 2008;22(1):47–59.341. Tieu J, Crowther CA, Middleton P. <strong>Dietary</strong> advice in pregnancy for preventing gestational diabetes mellitus.Cochrane Database Syst Rev 2008(2):CD006674.342. Zhang C, Liu S, Solomon CG, Hu FB. <strong>Dietary</strong> fiber intake, dietary glycemic load, and the risk for gestationaldiabetes mellitus. Diabetes Care 2006;29(10):2223–30.343. Chatzi L, Torrent M, Romieu I, Garcia-Esteban R, Ferrer C, Vioque J et al. Mediterranean diet in pregnancyis protective for wheeze and atopy in childhood. Thorax 2008;63(6):507.344. De Batlle J, Garcia Aymerich J, Barraza Villarreal A, Antó J, Romieu I. Mediterranean diet is associated withreduced asthma and rhinitis in Mexican children. Allergy 2008;63(10):1310–16.345. Hattevig G, Kjellman B, Sigurs N, Björkstén B, Kjellman N. Effect of maternal avoidance of eggs, cow’smilk and fish during lactation upon allergic manifestations in infants. Clin Exp Allergy 1989;19(1):27–32.346. Lange NE, Rifas-Shiman SL, Camargo CA, Gold DR, Gillman MW, Litonjua AA. Maternal dietarypattern during pregnancy is not associated with recurrent wheeze in children. J Allergy Clin Immunol2010;126(2):250–55.347. Shaheen SO, Northstone K, Newson RB, Emmett PM, Sherriff A, Henderson AJ. <strong>Dietary</strong> patterns inpregnancy and respiratory and atopic outcomes in childhood. Thorax 2009;64(5):411–7.348. Robinson S, Marriott L, Poole J, Crozier S, Borland S, Lawrence W et al. <strong>Dietary</strong> patterns in infancy: theimportance of maternal and family influences on feeding practice. Br J Nutr 2007;98(5):1029–37.349. Food Standards Australia New Zealand. Listeria. 2011 (cited 29 March 2011). http://www.foodstandards.gov.au/consumerinformation/listeria/.http://www.patonsyarns.com/pattern.ph350. Cullen G, O’Donoghue D. Constipation and pregnancy. Best Pract Res Clin Gastroenterol 2007;21(5):807–18.351. National <strong>Health</strong> and Medical Research Council. Infant feeding guidelines for health workers Canberra:Commonwealth of Australia; 2011.352. Lee AJ, O’Dea K, Mathews JD. Apparent dietary intake in remote Aboriginal communities. Aust J Public<strong>Health</strong> 1994;18(2):190–7.353. Brimblecombe JK, O’Dea K. The role of energy cost in food choices for an Aboriginal population innorthern Australia. Med J Aust 2009;190(10):549–51.354. Ball K, Timperio A, Crawford D. Neighbourhood socioeconomic inequalities in food access and affordability.<strong>Health</strong> & place 2009;15(2):578–85.170EAT FOR HEALTH – australian dietary guidelinesNational <strong>Health</strong> and Medical Research Council
355. Burns C, Inglis A. Measuring food access in Melbourne: access to healthy and fast foods by car, bus andfoot in an urban municipality in Melbourne. <strong>Health</strong> & Place 2007;13(4):877–85.356. Landrigan T, Pollard C. Food Access and Cost Survey (FACS), Western Australia, 2010. Perth: Departmentof <strong>Health</strong>, WA, 2011.357. NT Department of <strong>Health</strong> and Community Services. NT Market basket survey, 2006. NT Department of<strong>Health</strong> and Community Services; 2007.358. American Dietetic Association. Position of the American Dietetic Association: Vegetarian Diets. J Am DietAssoc 2009;109:1266-82.359. Marsh K, Zeuschner C, Saunders A, Reid M. Meeting nutritional needs on a vegetarian diet. Aust FamPhysician 2009;38(8):600–2.360. U.S. Department of <strong>Health</strong> and Human Services, U.S. Department of Agriculture. <strong>Dietary</strong> guidelines forAmericans 2005. 6th edition ed. Washington DC: U.S. Government Printing Office; 2005.361. Martinez-Gonzalez MA et al. Low consumption of fruit and vegetables and risk of chronic disease: a reviewof the epidemiological evidence and temporal trends among Spanish graduates. Public <strong>Health</strong> Nutr2011;14(12A):2309-15.362. Dauchet L, Amouyel P, Hercberg S, Dallongeville J, Dauchet L, Amouyel P et al. Fruit and vegetableconsumption and risk of coronary heart disease: a meta-analysis of cohort studies. J Nutr2006;136(10):2588–93.363. He FJ, Nowson CA, Lucas M, MacGregor GA. Increased consumption of fruit and vegetables isrelated to a reduced risk of coronary heart disease: meta-analysis of cohort studies. J Hum Hypertens2007;21(9):717–28.364. Joshipura KJ, Hung HC, Li TY, Hu FB, Rimm EB, Stampfer MJ et al. Intakes of fruits, vegetables andcarbohydrate and the risk of CVD. Public <strong>Health</strong> Nutr 2009;12(1):115–21.365. Rastogi T, Reddy KS, Vaz M, Spiegelman D, Prabhakaran D, Willett WC et al. Diet and risk of ischemicheart disease in India. Am J Clin Nutr 2004;79(4):582–92.366. Rodríguez-Rodríguez E, Ortega RM, López-Sobaler AM, Andrés P, Aparicio A, Bermejo LM et al. Restrictedenergydiets rich in vegetables or cereals improve cardiovascular risk factors in overweight/obese women.Nutr Res 2007;27(6):313–20.367. Takachi R, Inoue M, Ishihara J, Kurahashi N, Iwasaki M, Sasazuki S et al. Fruit and vegetable intake andrisk of total cancer and cardiovascular disease: Japan Public <strong>Health</strong> Center-Based Prospective Study.Am J Epidemiol 2008;167(1):59–70.368. Dauchet L, Amouyel P, Dallongeville J. Fruit and vegetable consumption and risk of stroke: a meta-analysisof cohort studies. Neurology 2005;65(8):1193–7.369. He FJ, Nowson CA, MacGregor GA. Fruit and vegetable consumption and stroke: meta-analysis of cohortstudies. Lancet 2006;367(9507):320–6.370. Villegas R, Shu XO, Gao YT, Yang G, Elasy T, Li H et al. Vegetable but not fruit consumption reduces the riskof type 2 diabetes in Chinese women. J Nutr 2008;138(3):574–80.371. Harding AH, Wareham NJ, Bingham SA, Khaw K, Luben R, Welch A et al. Plasma vitamin C level, fruit andvegetable consumption, and the risk of new-onset type 2 diabetes mellitus: the European prospectiveinvestigation of cancer--Norfolk prospective study. Arch Intern Med 2008;168(14):1493–9.372. Hamer M, Chida Y. Intake of fruit, vegetables, and antioxidants and risk of type 2 diabetes: systematicreview and meta-analysis. J Hypertens 2007;25(12):2361–9.373. Heck JE, Sapkota A, Vendhan G, Roychowdhury S, Dikshit RP, Jetly DH et al. <strong>Dietary</strong> risk factors forhypopharyngeal cancer in India. Cancer Causes Control 2008;19(10):1329–37.ReferencesNational <strong>Health</strong> and Medical Research Council171
374. Kreimer AR, Randi G, Herrero R, Castellsague X, La Vecchia C, Franceschi S. Diet and body mass, and oraland oropharyngeal squamous cell carcinomas: analysis from the IARC multinational case-control study.Int J Cancer 2006;118(9):2293–7.375. Gallicchio L, Matanoski G, Tao XG, Chen L, Lam TK, Boyd K et al. Adulthood consumption of preservedand nonpreserved vegetables and the risk of nasopharyngeal carcinoma: a systematic review. Int J Cancer2006;119(5):1125–35.376. Guneri P, Cankaya H, Yavuzer A, Guneri EA, Erisen L, Ozkul D et al. Primary oral cancer in a Turkishpopulation sample: association with sociodemographic features, smoking, alcohol, diet and dentition.Oral Oncol 2005;41(10):1005–12.377. Escribano Uzcudun A, Rabanal Retolaza I, Garcia Grande A, Miralles Olivar L, Garcia Garcia A, GonzalezBaron M et al. Pharyngeal cancer prevention: evidence from a case--control study involving 232consecutive patients. J Laryngol Otol 2002;116(7):523–31.378. George SM, Park Y, Leitzmann MF, Freedman ND, Dowling EC, Reedy J et al. Fruit and vegetable intakeand risk of cancer: a prospective cohort study. Am J Clin Nutr 2009;89(1):347.379. Freedman ND, Park Y, Subar AF, Hollenbeck AR, Leitzmann MF, Schatzkin A et al. Fruit and vegetableintake and esophageal cancer in a large prospective cohort study. Int J Cancer 2007;121(12):2753–60.380. Anderson LA, Watson RG, Murphy SJ, Johnston BT, Comber H, Mc Guigan J et al. Risk factors forBarrett’s oesophagus and oesophageal adenocarcinoma: results from the FINBAR study. World JGastroenterol 2007;13(10):1585–94.381. González CA, Pera G, Agudo A, Bueno de Mesquita HB, Ceroti M, Boeing H et al. Fruit and vegetableintake and the risk of stomach and oesophagus adenocarcinoma in the European Prospective Investigationinto Cancer and Nutrition (EPIC–EURGAST). Int J Cancer 2006;118(10):2559–66.382. Etminan M, Takkouche B, Caamano-Isorna F. The role of tomato products and lycopene in the preventionof prostate cancer: a meta-analysis of observational studies. Cancer Epidemiol Biomarkers Prev2004;13(3):340–5.383. Stram DO, Hankin JH, Wilkens LR, Park S, Henderson BE, Nomura AM et al. Prostate cancer incidenceand intake of fruits, vegetables and related micronutrients: the multiethnic cohort study (United States).Cancer Causes Control 2006;17(9):1193–207.384. Koushik A, Hunter DJ, Spiegelman D, Anderson KE, Arslan AA, Beeson WL et al. Fruits and vegetablesand ovarian cancer risk in a pooled analysis of 12 cohort studies. Cancer Epidemiol Biomarkers Prev2005;14(9):2160–7.385. Schulz M, Lahmann PH, Boeing H, Hoffmann K, Allen N, Key TJA et al. Fruit and vegetable consumptionand risk of epithelial ovarian cancer: the European Prospective Investigation into Cancer and Nutrition.Cancer Epidemiol Biomarkers Prev 2005;14(11):2531.386. Bandera EV, Kushi LH, Moore DF, Gifkins DM, McCullough ML. Fruits and vegetables and endometrialcancer risk: a systematic literature review and meta-analysis. Nutr Cancer 2007;58(1):6–21.387. Bravi F, Scotti L, Bosetti C, Zucchetto A, Talamini R, Montella M et al. Food groups and endometrialcancer risk: a case-control study from Italy. Am J Obstet Gynecol 2009;200(3):293 e1–7.388. Yeh M, Moysich KB, Jayaprakash V, Rodabaugh KJ, Graham S, Brasure JR et al. Higher intakes ofvegetables and vegetable-related nutrients are associated with lower endometrial cancer risks. J Nutr2009;139(2):317–22.389. Koushik A, Hunter DJ, Spiegelman D, Beeson WL, van den Brandt PA, Buring JE et al. Fruits, vegetables,and colon cancer risk in a pooled analysis of 14 cohort studies. J Natl Cancer Inst 2007;99(19):1471–83.390. Lam TK, Gallicchio L, Lindsley K, Shiels M, Hammond E, Tao XG et al. Cruciferous vegetable consumptionand lung cancer risk: a systematic review. Cancer Epidemiol Biomarkers Prev 2009;18(1):184–95.391. Cho E, Seddon JM, Rosner B, Willett WC, Hankinson SE, Cho E et al. Prospective study of intake offruits, vegetables, vitamins, and carotenoids and risk of age-related maculopathy. Arch Ophthalmol2004;122(6):883–92.172EAT FOR HEALTH – australian dietary guidelinesNational <strong>Health</strong> and Medical Research Council
392. Harland JI, Haffner TA. Systematic review, meta-analysis and regression of randomised controlled trialsreporting an association between an intake of circa 25g soya protein per day and blood cholesterol.Atherosclerosis 2008;200(1):13–27.393. Deibert P, König D, Schmidt-Trucksaess A, Zaenker K, Frey I, Landmann U et al. Weight loss without losingmuscle mass in pre-obese and obese subjects induced by a high-soy-protein diet. Int J Obes (Lond)2004;28(10):1349–52.394. Liao FH, Shieh MJ, Yang SC, Lin SH, Chien YW. Effectiveness of a soy-based compared with a traditionallow-calorie diet on weight loss and lipid levels in overweight adults. Nutrition 2007;23(7-8):551–6.395. St-Onge MP, Claps N, Wolper C, Heymsfield SB. Supplementation with soy-protein-rich foods does notenhance weight loss. J Am Diet Assoc 2007;107(3):500–05.396. Akhter M, Inoue M, Kurahashi N, Iwasaki M, Sasazuki S, Tsugane S. <strong>Dietary</strong> soy and isoflavone intakeand risk of colorectal cancer in the Japan public health center-based prospective study. Cancer EpidemiolBiomarkers Prev 2008;17(8):2128–35.397. Deneo-Pellegrini H, Boffetta P, De Stefani E, Ronco A, Brennan P, Mendilaharsu M. Plant foods anddifferences between colon and rectal cancers. Eur J Cancer Prev 2002;11(4):369.398. Michels KB, Giovannucci E, Chan AT, Singhania R, Fuchs CS, Willett WC. Fruit and vegetable consumptionand colorectal adenomas in the Nurses’ <strong>Health</strong> Study. Cancer Res 2006;66(7):3942–53.399. Oba S, Nagata C, Shimizu N, Shimizu H, Kametani M, Takeyama N et al. Soy product consumption and therisk of colon cancer: a prospective study in Takayama, Japan. Nutr Cancer 2007;57(2):151–7.400. Yang G, Shu XO, Li H, Chow WH, Cai H, Zhang X et al. Prospective cohort study of soy food intake andcolorectal cancer risk in women. Am J Clin Nutr 2009;89(2):577–83.401. Ward HA, Kuhnle GGC, Mulligan AA, Lentjes MAH, Luben RN, Khaw KT. Breast, colorectal, and prostatecancer risk in the European Prospective Investigation into Cancer and Nutrition–Norfolk in relation tophytoestrogen intake derived from an improved database. Am J Clin Nutr 2010;91(2):440.402. Riboli E, Norat T. Epidemiologic evidence of the protective effect of fruit and vegetables on cancer risk.Am J Clin Nutr 2003;78(3 Suppl):559S–69S.403. Gaudet MM, Britton JA, Kabat GC, Steck-Scott S, Eng SM, Teitelbaum SL et al. Fruits, vegetables,and micronutrients in relation to breast cancer modified by menopause and hormone receptor status.Cancer Epidemiol Biomarkers Prev 2004;13(9):1485–94.404. Hermann S, Linseisen J, Chang-Claude J. Nutrition and breast cancer risk by age 50: a population-basedcase-control study in Germany. Nutr Cancer 2002;44(1):23–34.405. Kruk J. Association of lifestyle and other risk factors with breast cancer according to menopausal status:a case-control study in the Region of Western Pomerania (Poland). Asian Pac J Cancer Prev 2007;8(4):513–24.406. Malin AS, Qi D, Shu XO, Gao YT, Friedmann JM, Jin F et al. Intake of fruits, vegetables and selectedmicronutrients in relation to the risk of breast cancer. Int J Cancer 2003;105(3):413–8.407. van Gils CH, Peeters PH, Bueno-de-Mesquita HB, Boshuizen HC, Lahmann PH, Clavel-Chapelon F et al.Consumption of vegetables and fruits and risk of breast cancer. J Am Med Assoc 2005;293(2):183–93.408. McCullough ML, Bandera EV, Patel R, Patel AV, Gansler T, Kushi LH et al. A prospective study of fruits,vegetables, and risk of endometrial cancer. Am J Epidemiol 2007;166(8):902–11.409. Oh S-Y, Lee JH, Jang DK, Heo SC, Kim HJ. Relationship of nutrients and food to colorectal cancer risk inKoreans. Nutr Res 2005;25(9):805–13.410. Sato Y, Tsubono Y, Nakaya N, Ogawa K, Kurashima K, Kuriyama S et al. Fruit and vegetable consumptionand risk of colorectal cancer in Japan: The Miyagi Cohort Study. Public <strong>Health</strong> Nutr 2005;8(3):309–14.411. Wu H, Dai Q, Shrubsole MJ, Ness RM, Schlundt D, Smalley WE et al. Fruit and vegetable intakes areassociated with lower risk of colorectal adenomas. J Nutr 2009;139(2):340–4.ReferencesNational <strong>Health</strong> and Medical Research Council173
412. Hamilton CA. Low-density lipoprotein and oxidised low-density lipoprotein: their role in the developmentof atherosclerosis. Pharmacol Ther 1997;74(1):55–72.413. Thompson HJ, Heimendinger J, Diker A, O’Neill C, Haegele A, Meinecke B et al. <strong>Dietary</strong> botanicaldiversity affects the reduction of oxidative biomarkers in women due to high vegetable and fruit intake.J Nutr 2006;136(8):2207.414. Wannamethee SG, Lowe GD, Rumley A, Bruckdorfer KR, Whincup PH. Associations of vitamin C status,fruit and vegetable intakes, and markers of inflammation and hemostasis. Am J Clin Nutr 2006;83(3):567–74; quiz 726–7.415. Jialal I, Singh U. Is vitamin C an antiinflammatory agent? Am J Clin Nutr 2006;83(3):525.416. Tavani A, La Vecchia C. [beta]-Carotene and risk of coronary heart disease. A review of observational andintervention studies. Biomed Pharmacother 1999;53(9):409–16.417. Messina MJ. Legumes and soybeans: overview of their nutritional profiles and health effects. Am J ClinNutr 1999;70(3):439S.418. Nagata C. Factors to consider in the association between soy isoflavone intake and breast cancer risk.J Epidemiol 2010(0):1002160133.419. Willett WC. Fruits, vegetables, and cancer prevention: turmoil in the produce section. J Natl Cancer Inst2010;102(8):510–1.420. Giovannucci E. Alcohol, one-carbon metabolism, and colorectal cancer: recent insights from molecularstudies. J Nutr 2004;134(9):2475S–81S.421. Zhang SM, Willett WC, Selhub J, Hunter DJ, Giovannucci EL, Holmes MD et al. Plasma folate, vitamin B6,vitamin B 12, homocysteine, and risk of breast cancer. J Natl Cancer Inst 2003;95(5):373–80.422. García-Lafuente A, Guillamón E, Villares A, Rostagno MA, Martínez JA. Flavonoids as anti-inflammatoryagents: implications in cancer and cardiovascular disease. Inflammation Res 2009;58(9):537–52.423. Lippman SM, Klein EA, Goodman PJ, Lucia MS, Thompson IM, <strong>For</strong>d LG et al. Effect of selenium andvitamin E on risk of prostate cancer and other cancers: the Selenium and Vitamin E Cancer PreventionTrial (SELECT). J Am Med Assoc 2009;301(1):39–51.424. Paolini M, Abdel-Rahman SZ, Sapone A, Pedulli GF, Perocco P, Cantelli-<strong>For</strong>ti G et al. Beta-carotene: acancer chemopreventive agent or a co-carcinogen? Mutat Res 2003;543(3):195–200.425. Khan N, Afaq F, Mukhtar H. Cancer chemoprevention through dietary antioxidants: progress and promise.Antioxidants Redox Signaling 2008;10(3):475–510.426. Bingham SA, Day NE, Luben R, Ferrari P, Slimani N, Norat T et al. <strong>Dietary</strong> fibre in food and protectionagainst colorectal cancer in the European Prospective Investigation into Cancer and Nutrition (EPIC):an observational study. Lancet 2003;361(9368):1496–501.427. Inskip HM, Crozier SR, Godfrey KM, Borland SE, Cooper C, Robinson SM. Women’s compliance withnutrition and lifestyle recommendations before pregnancy: general population cohort study. Br Med J2009;338.428. New Zealand Ministry of <strong>Health</strong>. Food and nutrition guidelines for healthy pregnant and breastfeedingwomen: a background paper. Wellington: New Zealand Ministry of <strong>Health</strong>; 2006 (revised 2008).429. Lussi A MB, Peter Shellis R, Wang X. Analysis of the erosive effect of different dietary substances andmedications. Br J Nutr 2011;30:1-11.430. Birch L. Development of food preferences. Annual Review of Nutrition 1999;19:41-62.431. Tasmanian School Canteen Association Inc. The Cool Canteen Accreditation Program. 2011 (cited 30 June2011). http://www.tascanteenassn.org.au/coolcap.http://www.patonsyarns.com/pattern.ph432. Office of Learning and Teaching. Go for your life school canteens and other school food services policy.Melbourne: Department of Education; 2006.174EAT FOR HEALTH – australian dietary guidelinesNational <strong>Health</strong> and Medical Research Council
433. Northern Territory Government. Canteen, nutrition and health eating policy. In: Training DoEa, editor.Darwin 2009.434. New South Wales Department of <strong>Health</strong>, New South Wales Department of Education and Training.Fresh tastes @ school NSW healthy school canteen strategy. Sydney: NSW Department of <strong>Health</strong> andNSW Department of Education and Training,; 2006.435. Government of Western Australia. <strong>Health</strong>y food and drink. Perth: Department of Education, 2008.436. Government of South Australia. Right bite, healthy food and drink supply strategy for south Australianschools and preschools. Adelaide: Government of South Australia, 2008.437. Dick M, Farquharson R, Bright M, Turner K, Lee AJ. Smart choices – healthy food and drink supply strategyfor queensland schools: evaluation report. Brisbane: Queensland health and department of education andtraining, 2009.438. Commonwealth Department of <strong>Health</strong> and Ageing. <strong>Guidelines</strong> for healthy foods and drinks supplied inschool canteens. Canberra: Commonwealth of Australia, 2010. http://www.health.gov.au/internet/main/publishing.nsf/Content/phd-nutrition-canteens439. AIHW. Australia’s <strong>Health</strong> 2010. In: AIHW, editor. Canberra: AIHW; 2010.440. McDermott R, Campbell S, Li M, McCulloch B. The health and nutrition of young indigenous women innorth Queensland–intergenerational implications of poor food quality, obesity, diabetes, tobacco smokingand alcohol use. Public <strong>Health</strong> Nutr 2009;12(11):2143–49.441. Food Standards Australia New Zealand. Australia New Zealand Food Standards Code. Canberra: FSANZ, 2011.442. Jacobs DR Jr, Meyer KA, Kushi LH, AR. F. Whole-grain intake may reduce the risk of ischemicheart disease death in postmenopausal women: the Iowa Women’s <strong>Health</strong> Study. Am J Clin Nutr1998;68(2):248–57.443. Anderson JW. Whole grains protect against atherosclerotic cardiovascular disease. Proc Nutr Soc2003;62(1):135–42.444. Berg A, Konig D, Deibert P, Grathwohl D, Baumstark MW, Franz IW. Effect of an oat bran enriched dieton the atherogenic lipid profile in patients with an increased coronary heart disease risk. A controlledrandomized lifestyle intervention study. Ann Nutr Metab 2003;47(6):306–11.445. De Moura F. Whole grain intake and cardiovascular disease and whole grain intake and diabetes:A review. Bethesda, MD: Life Sciences Research Organization, 2008.446. Djousse L, Gaziano JM. Breakfast cereals and risk of heart failure in the physicians’ health study I.Arch Intern Med 2007;167(19):2080–5.447. Erkkila AT, Herrington DM, Mozaffarian D, Lichtenstein AH. Cereal fiber and whole-grain intake areassociated with reduced progression of coronary-artery atherosclerosis in postmenopausal womenwith coronary artery disease. Am Heart J 2005;150(1):94–101.448. Flight I, Clifton P. Cereal grains and legumes in the prevention of coronary heart disease and stroke:a review of the literature. Eur J Clin Nutr 2006;60(10):1145–59.449. Jacobs DR, Jr., Gallaher DD. Whole grain intake and cardiovascular disease: a review. Curr AtherosclerRep 2004;6(6):415–23.450. Katcher HI, Legro RS, Kunselman AR, Gillies PJ, Demers LM, Bagshaw DM et al. The effects of a wholegrain-enriched hypocaloric diet on cardiovascular disease risk factors in men and women with metabolicsyndrome. Am J Clin Nutr 2008;87(1):79–90.451. Kelly SA, Summerbell CD, Brynes A, Whittaker V, Frost G. Wholegrain cereals for coronary heart disease.Cochrane Database Syst Rev 2007(2):CD005051.452. Liu S, Buring JE, Sesso HD, Rimm EB, Willett WC, Manson JAE. A prospective study of dietary fiberintake and risk of cardiovascular disease among women. J Am Coll Cardiol 2002;39(1):49–56.ReferencesNational <strong>Health</strong> and Medical Research Council175
453. Liu S, Sesso HD, Manson JAE, Willett WC, Buring JE. Is intake of breakfast cereals related to total andcause-specific mortality in men? Am J Clin Nutr 2003;77(3):594.454. Negri E, La Vecchia C, Pelucchi C, Bertuzzi M, Tavani A. Fiber intake and risk of nonfatal acute myocardialinfarction. Eur J Clin Nutr 2003;57(3):464–70.455. Nettleton JA, Steffen LM, Loehr LR, Rosamond WD, Folsom AR. Incident heart failure is associatedwith lower whole-grain intake and greater high-fat dairy and egg intake in the Atherosclerosis Risk inCommunities (ARIC) study. J Am Diet Assoc 2008;108(11):1881–87.456. Pereira MA, O’Reilly E, Augustsson K, Fraser GE, Goldbourt U, Heitmann BL et al. <strong>Dietary</strong> fiber and riskof coronary heart disease: a pooled analysis of cohort studies. Arch Intern Med 2004;164(4):370–6.457. Rave K, Roggen K, Dellweg S, Heise T, tom Dieck H. Improvement of insulin resistance after diet with awhole-grain based dietary product: results of a randomized, controlled cross-over study in obese subjectswith elevated fasting blood glucose. Br J Nutr 2007;98(5):929–36.458. Truswell AS. Cereal grains and coronary heart disease. Eur J Clin Nutr 2002;56(1):1–14.459. de Munter JS, Hu FB, Spiegelman D, Franz M, van Dam RM. Whole grain, bran, and germ intake and riskof type 2 diabetes: a prospective cohort study and systematic review. PLoS Med 2007;4(8):e261.460. Henry CJK, Lightowler H, Tydeman E, Skeath R. Use of low-glycaemic index bread to reduce 24-h bloodglucose: implications for dietary advice to non-diabetic and diabetic subjects. Int J Food Sci Nutrition2006;57(3-4):273–78.461. Hodge AM, English DR, O’Dea K, Giles GG. Glycemic index and dietary fiber and the risk of type 2diabetes. Diabetes Care 2004;27(11):2701–6.462. Krishnan S, Rosenberg L, Singer M, Hu FB, Djousse L, Cupples LA et al. Glycemic index, glycemicload, and cereal fiber intake and risk of type 2 diabetes in US black women. Arch Intern Med2007;167(21):2304–9.463. Pereira MA, Jacobs DR, Jr., Pins JJ, Raatz SK, Gross MD, Slavin JL et al. Effect of whole grains on insulinsensitivity in overweight hyperinsulinemic adults. Am J Clin Nutr 2002;75(5):848–55.464. Priebe MG, van Binsbergen JJ, de Vos R, Vonk RJ. Whole grain foods for the prevention of type 2 diabetesmellitus. Cochrane Database Syst Rev 2008(1):CD006061.465. Venn BJ, Mann JI. Cereal grains, legumes and diabetes. Eur J Clin Nutr 2004;58(11):1443–61.466. Andersson A, Tengblad S, Karlstrom B, Kamal-Eldin A, Landberg R, Basu S et al. Whole-grain foods donot affect insulin sensitivity or markers of lipid peroxidation and inflammation in healthy, moderatelyoverweight subjects. J Nutr 2007;137(6):1401–7.467. Asano T, McLeod RS. <strong>Dietary</strong> fibre for the prevention of colorectal adenomas and carcinomas. CochraneDatabase Syst Rev 2002(2):CD003430.468. Jacobs ET, Lanza E, Alberts DS, Hsu CH, Jiang R, Schatzkin A et al. Fiber, sex, and colorectal adenoma:results of a pooled analysis. Am J Clin Nutr 2006;83(2):343–9.469. La Vecchia C, Chatenoud L, Negri E, Franceschi S. Session: whole cereal grains, fibre and human cancerwholegrain cereals and cancer in Italy. Proc Nutr Soc 2003;62(1):45–9.470. Peters U, Sinha R, Chatterjee N, Subar AF, Ziegler RG, Kulldorff M et al. <strong>Dietary</strong> fibre and colorectaladenoma in a colorectal cancer early detection programme. Lancet 2003;361(9368):1491–95.471. Schatzkin A, Mouw T, Park Y, Subar AF, Kipnis V, Hollenbeck A et al. <strong>Dietary</strong> fiber and whole-grainconsumption in relation to colorectal cancer in the NIH-AARP Diet and <strong>Health</strong> Study. Am J Clin Nutr2007;85(5):1353–60.472. Chan D, Lau R AD, R V, D G, Kampman E, T N. P1-109 The WCRF/AICR continuous update project:dietary fibre intake and colorectal cancer incidence. J Epidemiol Community <strong>Health</strong> 2011;65(A97).176EAT FOR HEALTH – australian dietary guidelinesNational <strong>Health</strong> and Medical Research Council
473. Aune D, Chan DSM, Lau R, Vieira R, Greenwood DC, Kampman E et al. <strong>Dietary</strong> fibre, whole grains, andrisk of colorectal cancer: systematic review and dose-response meta-analysis of prospective studies.BMJ 2011;343:d6617.474. Theuwissen E, Mensink RP. Water-soluble dietary fibers and cardiovascular disease. Physiol Behav2008;94(2):285–92.475. Kerckhoffs DA, Brouns F, Hornstra G, Mensink RP. Effects on the human serum lipoprotein profileof beta-glucan, soy protein and isoflavones, plant sterols and stanols, garlic and tocotrienols. J Nutr2002;132(9):2494–505.476. Beck EJ, Tosh SM, Batterham MJ, Tapsell LC, Huang XF. Oat beta-glucan increases postprandialcholecystokinin levels, decreases insulin response and extends subjective satiety in overweight subjects.Mol Nutr Food Res 2009;53(10):1343–51.477. Toden S, Belobrajdic DP, Bird AR, Topping DL, Conlon MA. Effects of dietary beef and chicken with andwithout high amylose maize starch on blood malondialdehyde, interleukins, IGF-I, insulin, leptin, MMP-2,and TIMP-2 concentrations in rats. Nutr Cancer 2010;62(4):454.478. Lazaridou A, Biliaderis C. Molecular aspects of cereal [beta]-glucan functionality: physical properties,technological applications and physiological effects. Journal of Cereal Science 2007;46(2):101–18.479. Liu RH. Whole grain phytochemicals and health. J Cereal Sci 2007;46(3):207–19.480. Slavin J. Why whole grains are protective: biological mechanisms. Proc Nutr Soc 2003;62(1):129–34.481. Dodd H, Williams S, Brown R, B V. Calculating meal gylcaemic index by using measured and publishedfood values compared with directly measured meal glycaemic index. The American Journal of ClinicalNutrition 2011;94(4):992-96.482. De-Regil LM, Fernández-Gaxiola AC, Dowswell T, Peña-Rosas JP. Effects and safety of periconceptionalfolate supplementation for preventing birth defects. Cochrane Database of Systematic Reviews2010:DOI:10.1002/14651858.CD007950.pub2.483. Food Standards Australia and New Zealand. Folic acid / Folate. 2011 (cited 12 May 2011). http://www.foodstandards.gov.au/consumerinformation/adviceforpregnantwomen/folicacidfolateandpr4598.cfm.http://www.patonsyarns.com/pattern.ph484. National Institute for Clinical Studies. Encouraging periconceptional use of folic acid supplements.Melbourne: National Institute for Clinical Studies, 2005. http://www.nhmrc.gov.au/_files_nhmrc/file/nics/material_resources/evidence_practice_gaps_report_volume_2.pdf485. Mooney BD et al. Seafood the good food II: oil profiles for further Australian seafoods and influencingfactors. CSIRO Marine Research and Fisheries Research & Development Corporation Australia; 2002.486. Nichols PD et al. Seafood the good food: the oil (fat) content and composition of Australian commercialfishes, shellfishes and crustaceans. CSIRO Marine Research Australia; 1998.487. Sinha R, Cross AJ, Graubard BI, Leitzmann MF, Schatzkin A. Meat intake and mortality: a prospectivestudy of over half a million people. Arch Intern Med 2009;169(6):562–71.488. Brink M, Weijenberg MP, de Goeij AF, Roemen GM, Lentjes MH, de Bruine AP et al. Meat consumptionand K-ras mutations in sporadic colon and rectal cancer in The Netherlands Cohort Study. Br J Cancer2005;92(7):1310–20.489. Chan AT, Tranah GJ, Giovannucci EL, Willett WC, Hunter DJ, Fuchs CS. Prospective study ofN-acetyltransferase-2 genotypes, meat intake, smoking and risk of colorectal cancer. Int J Cancer2005;115(4):648–52.490. Kabat GC, Miller AB, Jain M, Rohan TE. A cohort study of dietary iron and heme iron intake and risk ofcolorectal cancer in women. Br J Cancer 2007;97(1):118–22.491. Larsson SC, Wolk A. Meat consumption and risk of colorectal cancer: a meta-analysis of prospectivestudies. Int J Cancer 2006;119(11):2657–64.ReferencesNational <strong>Health</strong> and Medical Research Council177
492. Lee SA, Shu XO, Yang G, Li H, Gao YT, Zheng W et al. Animal origin foods and colorectal cancer risk:a report from the Shanghai Women’s <strong>Health</strong> Study. Nutr Cancer 2009;61(2):194–205.493. Norat T, Lukanova A, Ferrari P, Riboli E. Meat consumption and colorectal cancer risk: dose-responsemeta-analysis of epidemiological studies. Int J Cancer 2002;98(2):241–56.494. Oba S, Shimizu N, Nagata C, Shimizu H, Kametani M, Takeyama N et al. The relationship betweenthe consumption of meat, fat, and coffee and the risk of colon cancer: a prospective study in Japan.Cancer Lett 2006;244(2):260–67.495. Sato Y, Nakaya N, Kuriyama S, Nishino Y, Tsubono Y, Tsuji I. Meat consumption and risk of colorectalcancer in Japan: the Miyagi Cohort Study. Eur J Cancer Prev 2006;15(3):211.496. Seow A, Quah SR, Nyam D, Straughan PT, Chua T, Aw TC. Food groups and the risk of colorectalcarcinoma in an Asian population. Cancer 2002;95(11):2390–96.497. Garcia-Closas R, Garcia-Closas M, Kogevinas M, Malats N, Silverman D, Serra C et al. Food, nutrient andheterocyclic amine intake and the risk of bladder cancer. Eur J Cancer 2007;43(11):1731–40.498. Larsson SC, Johansson JE, Andersson SO, Wolk A. Meat intake and bladder cancer risk in a Swedishprospective cohort. Cancer Causes Control 2009;20(1):35–40.499. Koutros S, Cross AJ, Sandler DP, Hoppin JA, Ma X, Zheng T et al. Meat and meat mutagens and risk ofprostate cancer in the Agricultural <strong>Health</strong> Study. Cancer Epidemiol Biomarkers Prev 2008;17(1):80–7.500. Mori M, Masumori N, Fukuta F, Nagata Y, Sonoda T, Sakauchi F et al. Traditional Japanese diet and prostatecancer. Mol Nutr Food Res 2009;53(2):191–200.501. Chan JM, Wang F, Holly EA. Pancreatic cancer, animal protein and dietary fat in a population-based study,San Francisco Bay Area, California. Cancer Causes Control 2007;18(10):1153–67.502. Iso H, Kobayashi M, Ishihara J, Sasaki S, Okada K, Kita Y et al. Intake of fish and n3 fatty acids and risk ofcoronary heart disease among Japanese: the Japan Public <strong>Health</strong> Center-Based (JPHC) Study Cohort I.Circulation 2006;113(2):195.503. Virtanen JK, Mozaffarian D, Chiuve SE, Rimm EB. Fish consumption and risk of major chronic disease inmen. Am J Clin Nutr 2008;88(6):1618–25.504. Whelton SP, He J, Whelton PK, Muntner P. Meta-analysis of observational studies on fish intake andcoronary heart disease. Am J Cardiol 2004;93(9):1119–23.505. Yamagishi K, Iso H, Date C, Fukui M, Wakai K, Kikuchi S et al. Fish, omega-3 polyunsaturated fatty acids,and mortality from cardiovascular diseases in a nationwide community-based cohort of Japanese men andwomen the JACC (Japan Collaborative Cohort Study for Evaluation of Cancer Risk) Study. J Am Coll Cardiol2008;52(12):988–96.506. Folsom AR, Demissie Z. Fish intake, marine omega-3 fatty acids, and mortality in a cohort ofpostmenopausal women. Am J Epidemiol 2004;160(10):1005–10.507. He K, Song Y, Daviglus ML, Liu K, Van Horn L, Dyer AR et al. Accumulated evidence on fish consumptionand coronary heart disease mortality: a meta-analysis of cohort studies. Circulation 2004;109(22):2705–11.508. Jarvinen R, Knekt P, Rissanen H, Reunanen A. Intake of fish and long-chain n-3 fatty acids and the risk ofcoronary heart mortality in men and women. Br J Nutr 2006;95(4):824–9.509. Kaushik S, Wang JJ, Flood V, Liew G, Smith W, Mitchell P. Frequency of fish consumption, retinalmicrovascular signs and vascular mortality. Microcirculation 2008;15(1):27–36.510. Konig A, Bouzan C, Cohen JT, Connor WE, Kris-Etherton PM, Gray GM et al. A quantitative analysis of fishconsumption and coronary heart disease mortality. Am J Prev Med 2005;29(4):335–46.511. Nakamura Y, Ueshima H, Okamura T, Kadowaki T, Hayakawa T, Kita Y et al. Association between fishconsumption and all-cause and cause-specific mortality in Japan: NIPPON DATA80, 1980-99. Am J Med2005;118(3):239–45.178EAT FOR HEALTH – australian dietary guidelinesNational <strong>Health</strong> and Medical Research Council
512. Ness A, Maynard M, Frankel S, Davey Smith G, Frobisher C, Leary S et al. Diet in childhood and adultcardiovascular and all cause mortality: the Boyd Orr cohort. Heart 2005;91(7):894.513. Streppel MT, Ocke MC, Boshuizen HC, Kok FJ, Kromhout D. Long-term fish consumption and n-3fatty acid intake in relation to (sudden) coronary heart disease death: the Zutphen study. Eur Heart J2008;29(16):2024–30.514. Bouzan C, Cohen JT, Connor WE, Kris-Etherton PM, Gray GM, Konig A et al. A quantitative analysis offish consumption and stroke risk. Am J Prev Med 2005;29(4):347–52.515. Ding EL, Mozaffarian D. Optimal dietary habits for the prevention of stroke. Semin Neurol 2006;26(1):11–23.516. Gochfeld M, Burger J. Good fish/bad fish: a composite benefit-risk by dose curve. Neurotoxicology2005;26(4):511–20.517. Barberger-Gateau P, Raffaitin C, Letenneur L, Berr C, Tzourio C, Dartigues JF et al. <strong>Dietary</strong> patterns andrisk of dementia: the three-city cohort study. Neurology 2007;69(20):1921–30.518. Huang T, Zandi P, Tucker K, Fitzpatrick A, Kuller L, Fried L et al. Benefits of fatty fish on dementia risk arestronger for those without APOE 4. Neurology 2005;65(9):1409.519. Kalmijn S, Van Boxtel M, Ocke M, Verschuren W, Kromhout D, Launer L. <strong>Dietary</strong> intake of fatty acids andfish in relation to cognitive performance at middle age. Neurology 2004;62(2):275.520. Morris MC, Evans DA, Tangney CC, Bienias JL, Wilson RS. Fish consumption and cognitive decline withage in a large community study. Arch Neurol 2005;62(12):1849–53.521. van Gelder BM, Tijhuis M, Kalmijn S, Kromhout D. Fish consumption, n-3 fatty acids, and subsequent 5-ycognitive decline in elderly men: the Zutphen Elderly Study. Am J Clin Nutr 2007;85(4):1142–7.522. Weih M, Wiltfang J, Kornhuber J. Non-pharmacologic prevention of Alzheimer’s disease: nutritional andlife-style risk factors. J Neural Transm 2007;114(9):1187–97.523. Larrieu S, Letenneur L, Helmer C, Dartigues J, Barberger-Gateau P. Nutritional factors and risk of incidentdementia in the PAQUID longitudinal cohort. J Nutrition <strong>Health</strong> Aging 2004;8(3):150–54.524. Maclean CH, Issa AM, Newberry SJ, Mojica WA, Morton SC, Garland RH et al. Effects of omega-3 fattyacids on cognitive function with aging, dementia, and neurological diseases. Evid Rep Technol Assess(Summ) 2005(114):1–3.525. Schiepers OJ, de Groot RH, Jolles J, van Boxtel MP. Plasma phospholipid fatty acid status and depressivesymptoms: association only present in the clinical range. J Affect Disord 2009;118(1-3):209–14.526. Sontrop J, Campbell MK. Omega-3 polyunsaturated fatty acids and depression: a review of the evidenceand a methodological critique. Prev Med 2006;42(1):4–13.527. Sanchez-Villegas A, Henriquez P, Figueiras A, Ortuno F, Lahortiga F, Martinez-Gonzalez MA et al. Long chainomega-3 fatty acids intake, fish consumption and mental disorders in the SUN cohort study. Eur J Nutrition2007;46(6):337–46.528. Colangelo LA, He K, Whooley MA, Daviglus ML, Liu K. Higher dietary intake of long-chain omega-3polyunsaturated fatty acids is inversely associated with depressive symptoms in women. Nutrition2009;25(10):1011–9.529. Kyrozis A, Psaltopoulou T, Stathopoulos P, Trichopoulos D, Vassilopoulos D, Trichopoulou A. <strong>Dietary</strong>lipids and geriatric depression scale score among elders: The EPIC-Greece cohort. J Psychiatr Res2009;43(8):763–69.530. Chong EW, Kreis AJ, Wong TY, Simpson JA, Guymer RH. <strong>Dietary</strong> omega-3 fatty acid and fish intake inthe primary prevention of age-related macular degeneration: a systematic review and meta-analysis.Arch Ophthalmol 2008;126(6):826–33.531. Djousse L, Gaziano JM, Buring JE, Lee IM. Egg consumption and risk of type 2 diabetes in men andwomen. Diabetes Care 2009;32(2):295–300.ReferencesNational <strong>Health</strong> and Medical Research Council179
532. Sauvaget C, Nagano J, Allen N, Grant EJ, Beral V. Intake of animal products and stroke mortality in theHiroshima/Nagasaki Life Span Study. Int J Epidemiol 2003;32(4):536–43.533. Kramer Michael S, Kakuma R. Maternal dietary antigen avoidance during pregnancy or lactation, or both,for preventing or treating atopic disease in the child. Cochrane Database Syst Rev 2006(3).534. Chakrabarty G, Bijlani RL, Mahapatra SC, Mehta N, Lakshmy R, Vashisht S et al. The effect ofingestion of egg on serum lipid profile in healthy young free-living subjects. Indian J Physiol Pharmacol2002;46(4):492–8.535. Chakrabarty G, Manjunatha S, Bijlani RL, Ray RB, Mahapatra SC, Mehta N et al. The effect of ingestion ofegg on the serum lipid profile of healthy young Indians. Indian J Physiol Pharmacol 2004;48(3):286–92.536. Djousse L, Gaziano JM. Egg consumption in relation to cardiovascular disease and mortality: the Physicians’<strong>Health</strong> Study. Am J Clin Nutr 2008;87(4):964–9.537. Gillingham LG, Caston L, Leeson S, Hourtovenko K, Holub BJ. The effects of consumingdocosahexaenoic acid (DHA)-enriched eggs on serum lipids and fatty acid compositions in statin-treatedhypercholesterolemic male patients. Food Research Int 2005;38(10):1117–23.538. Goodrow EF, Wilson TA, Houde SC, Vishwanathan R, Scollin PA, Handelman G et al. Consumption of oneegg per day increases serum lutein and zeaxanthin concentrations in older adults without altering serumlipid and lipoprotein cholesterol concentrations. J Nutr 2006;136(10):2519.539. Harman NL, Leeds AR, Griffin BA. Increased dietary cholesterol does not increase plasma lowdensity lipoprotein when accompanied by an energy-restricted diet and weight loss. Eur J Nutrition2008;47(6):287–93.540. Katz DL, Evans MA, Nawaz H, Njike VY, Chan W, Comerford BP et al. Egg consumption and endothelialfunction: a randomized controlled crossover trial. Int J Cardiol 2005;99(1):65–70.541. Lee JY, Lewis NM, Scheideler SE, Carr TP. Consumption of omega-3 fatty acid-enriched eggs and serumlipids in humans. J Nutraceut Functional Med Foods 2003;4(1):3–13.542. Maki KC, Van Elswyk ME, McCarthy D, Seeley MA, Veith PE, Hess SP et al. Lipid responses in mildlyhypertriglyceridemic men and women to consumption of docosahexaenoic acid-enriched eggs. Int J VitamNutr Res 2003;73(5):357–68.543. Makrides M, Hawkes JS, Neumann MA, Gibson RA. Nutritional effect of including egg yolk in the weaningdiet of breast-fed and formula-fed infants: a randomized controlled trial. Am J Clin Nutr 2002;75(6):1084–92.544. Nakamura Y, Iso H, Kita Y, Ueshima H, Okada K, Konishi M et al. Egg consumption, serum total cholesterolconcentrations and coronary heart disease incidence: Japan Public <strong>Health</strong> Center-based prospective study.Br J Nutr 2006;96(5):921–8.545. Nakamura Y, Okamura T, Tamaki S, Kadowaki T, Hayakawa T, Kita Y et al. Egg consumption, serumcholesterol, and cause-specific and all-cause mortality: the National Integrated Project for ProspectiveObservation of Non-communicable Disease and Its Trends in the Aged, 1980 (NIPPON DATA80).Am J Clin Nutr 2004;80(1):58.546. Ohman M, Akerfeldt T, Nilsson I, Rosen C, Hansson LO, Carlsson M et al. Biochemical effects of consumptionof eggs containing omega-3 polyunsaturated fatty acids. Ups J Med Sci 2008;113(3):315–23.547. Rose EL, Holub BJ. Effects of a liquid egg product containing fish oil on selected cardiovascular diseaserisk factors: A randomized crossover trial. Food Res Int 2006;39(8):910–16.548. Sindelar CA, Scheerger SB, Plugge SL, Eskridge KM, Wander RC, Lewis NM. Serum lipids of physically activeadults consuming omega-3 fatty acid-enriched eggs or conventional eggs. Nutr Res 2004;24(9):731–39.549. Vander Wal JS, Gupta A, Khosla P, Dhurandhar NV. Egg breakfast enhances weight loss. Int J Obes (Lond)2008;32(10):1545–51.180EAT FOR HEALTH – australian dietary guidelinesNational <strong>Health</strong> and Medical Research Council
550. Vislocky LM, Pikosky MA, Rubin KH, Vega-López S, Gaine PC, Martin WF et al. Habitual consumptionof eggs does not alter the beneficial effects of endurance training on plasma lipids and lipoproteinmetabolism in untrained men and women. J Nutritional Biochem 2009;20(1):26–34.551. Wenzel AJ, Gerweck C, Barbato D, Nicolosi RJ, Handelman GJ, Curran-Celentano J. A 12-wk eggintervention increases serum zeaxanthin and macular pigment optical density in women. J Nutr2006;136(10):2568–73.552. Alper CM, Mattes RD. Peanut consumption improves indices of cardiovascular disease risk in healthyadults. J Am Coll Nutr 2003;22(2):133–41.553. Pan A et al. Red meat consumption and mortality: results from two prospective cohort studies.Arch Intern Med 2012;172(7):555-63.554. Bernstein AM et al. Major dietary protein sources and risk of coronary heart disease in women.Circulation 2010;122::876-83.555. Hebels DG et al. Red meat intake-induced increases in fecal water genotoxicity correlate with procarcinogenicgene expression changes in the human colon. Food Chem Toxicol 2012;50(2):95-103.556. Kuhnle GGC, Story GW, Reda T, Mani AR, Moore KP, Lunn JC et al. Diet-induced endogenous formationof nitroso compounds in the GI tract. Free Radical Biol Med 2007;43(7):1040–47.557. Bastide NM et al. Heme iron from meat and risk of colorectal cancer: a meta-analysis and a review ofthe mechanisms involved. Cancer Prev Res 2011;4(2):177-84.558. Ma RW, Chapman K. A systematic review of the effect of diet in prostate cancer prevention andtreatment. J Hum Nutr Diet 2009;22(3):187–99; quiz 200–2.559. Sofi F, Cesari F, Abbate R, Gensini GF, Casini A. Adherence to Mediterranean diet and health status:meta-analysis. Br Med J 2008;337:a1344.560. Ros E, Tapsell LC, Sabaté J. Nuts and berries for heart health. Curr Atheroscler Rep 2010:1–10.561. Segura R, Javierre C, Lizarraga MA, Ros E. Other relevant components of nuts: phytosterols, folate andminerals. Br J Nutr 2006;96(Suppl 2):S36–44.562. Ziemke F, Mantzoros CS. Adiponectin in insulin resistance: lessons from translational research. Am J ClinNutr 2010;91(1):258S–61S.563. Mattes RD, Dreher ML. Nuts and healthy body weight maintenance mechanisms. Asia Pac J Clin Nutr2010;19(1):137–41.564. Tapsell L, Batterham M, Tan SY, Warensjo E. The effect of a calorie controlled diet containing walnuts onsubstrate oxidation during 8-hours in a room calorimeter. J Am Coll Nutr 2009;28(5):611.565. Commonwealth Department of Agriculture Fisheries and <strong>For</strong>estry. Australia’s agriculture, fisheries andforestry at a glance 2010. Canberra: Commonwealth Department of Agriculture, Fisheries and <strong>For</strong>estry,2010. http://www.daff.gov.au/about/publications/australias_agriculture,_fisheries_and_forestry_at_a_glance_2010566. Australian Bureau of Agricultural and Resource Economics and Sciences. Fishery status reports 2010:Status of Fish Stocks and Fisheries managed by the Australian Government. In: Australian GovernmentDepartment of Agriculture Fisheries and <strong>For</strong>estry, editor. 2011.567. Food Standards Australia New Zealand. Mercury in fish. 2011 (cited 29 March 2011). http://www.foodstandards.gov.au/consumerinformation/adviceforpregnantwomen/mercuryinfish.cfm.http://www.patonsyarns.com/pattern.ph568. Greer FR, Sicherer SH, Burks A. Effects of early nutritional interventions on the development ofatopic disease in infants and children: the role of maternal dietary restriction, breastfeeding, timing ofintroduction of complementary foods, and hydrolyzed formulas. Pediatrics 2008;121(1):183.569. Host A, Halken S, Muraro A, Dreborg S, Niggemann B, Aalberse R et al. <strong>Dietary</strong> prevention of allergicdiseases in infants and small children. Pediatr Allergy Immunol 2008;19(1):1–4.ReferencesNational <strong>Health</strong> and Medical Research Council181
570. Sicherer SH, Burks AW. Maternal and infant diets for prevention of allergic diseases: understanding menuchanges in 2008. J Allergy Clin Immunol 2008;122(1):29–33.571. Prescott SL, Tang ML. The Australasian Society of Clinical Immunology and Allergy position statement:Summary of allergy prevention in children. Med J Aust 2005;182(9):464–7.572. UK Royal College of Obstericians and Gynaecologists. Nutrition in pregnancy (SAC opinion paper 18).2010. Available from: http://www.rcog.org.uk/nutrition-pregnancy-sac-opinion-paper-18573. Food Authority NSW. Sydney Harbour seafood and dioxins. 2010 (cited 29 March 2011). http://www.foodauthority.nsw.gov.au/consumers/keeping-food-safe/special-care-foods/sydney-harbour-seafood/.http://www.patonsyarns.com/pattern.ph574. Food Standards Australia New Zealand. Dioxins in food: dietary exposure assessment and riskcharacterisation. Canberra: 2004. Available from: http://www.foodstandards.gov.au/_srcfiles/FINAL%20DEA-RC%20Report%20Dioxin%2024May04final.pdf575. Food and Agriculture Organization of the United Nations and the World <strong>Health</strong> Organization. Joint FAO/WHO Expert Consultation on the risks and benefits of fish consumption. Rome: Food and AgricultureOrganization of the United Nations and the World <strong>Health</strong> Organization, 2010 25-29 January 2010.http://www.who.int/foodsafety/chem/meetings/jan2010/en/index.html576. Elwood PC, Givens DI, Beswick AD, Fehily AM, Pickering JE, Gallacher J. The survival advantage of milkand dairy consumption: an overview of evidence from cohort studies of vascular diseases, diabetes andcancer. J Am Coll Nutr 2008;27(6):723S–34S.577. He K, Merchant A, Rimm EB, Rosner BA, Stampfer MJ, Willett WC et al. <strong>Dietary</strong> fat intake andrisk of stroke in male US healthcare professionals: 14 year prospective cohort study. Br Med J2003;327(7418):777–82.578. Alonso A, Beunza JJ, Delgado-Rodriguez M, Martinez JA, Martinez-Gonzalez MA. Low-fat dairyconsumption and reduced risk of hypertension: the Seguimiento Universidad de Navarra (SUN) cohort.Am J Clin Nutr 2005;82(5):972–9.579. Engberink MF, Geleijnse JM, de Jong N, Smit HA, Kok FJ, Verschuren WM. Dairy intake, blood pressure,and incident hypertension in a general Dutch population. J Nutr 2009;139(3):582–7.580. Toledo E, Delgado-Rodríguez M, Estruch R, Salas-Salvadó J, Corella D, Gomez-Gracia E et al. Low-fat dairyproducts and blood pressure: follow-up of 2290 older persons at high cardiovascular risk participating inthe PREDIMED study. Br J Nutr 2009;101(01):59–67.581. Wang L, Manson JAE, Buring JE, Lee I. <strong>Dietary</strong> intake of dairy products, calcium, and vitamin D andthe risk of hypertension in middle-aged and older women. Hypertension 2008;51(4):1073.582. Lutsey PL, Steffen LM, Stevens J. <strong>Dietary</strong> intake and the development of the metabolic syndrome:the Atherosclerosis Risk in Communities study. Circulation 2008;117(6):754–61.583. Pittas AG, Lau J, Hu FB, Dawson-Hughes B. The role of vitamin D and calcium in type 2 diabetes.A systematic review and meta-analysis. J Clin Endocrinol Metab 2007;92(6):2017–29.584. Berkey CS, Rockett HR, Field AE, Gillman MW, Colditz GA. Sugar-added beverages and adolescentweight change. Obes Res 2004;12(5):778–88.585. Johnson L, Mander AP, Jones LR, Emmett PM, Jebb SA. Is sugar-sweetened beverage consumptionassociated with increased fatness in children? Nutrition 2007;23(7-8):557–63.586. Cho E, Smith-Warner SA, Spiegelman D, Beeson WL, van den Brandt PA, Colditz GA et al. Dairyfoods, calcium, and colorectal cancer: a pooled analysis of 10 cohort studies. J Natl Cancer Inst2004;96(13):1015–22.587. Huncharek M, Muscat J, Kupelnick B. Colorectal cancer risk and dietary intake of calcium, vitamin D,and dairy products: a meta-analysis of 26,335 cases from 60 observational studies. Nutr Cancer2009;61(1):47–69.182EAT FOR HEALTH – australian dietary guidelinesNational <strong>Health</strong> and Medical Research Council
588. Sellers TA, Vierkant RA, Djeu J, Celis E, Wang AH, Kumar N et al. Unpasteurized milk consumption andsubsequent risk of cancer. Cancer Causes Control 2008;19(8):805–11.589. Lee JE, Hunter DJ, Spiegelman D, Adami HO, Bernstein L, van den Brandt PA et al. Intakes of coffee,tea, milk, soda and juice and renal cell cancer in a pooled analysis of 13 prospective studies. Int J Cancer2007;121(10):2246–53.590. Alvarez-Leon EE, Roman-Vinas B, Serra-Majem L. Dairy products and health: a review of theepidemiological evidence. Br J Nutr 2006;96(Suppl 1):S94–9.591. Missmer SA, Smith-Warner SA, Spiegelman D, Yaun SS, Adami HO, Beeson WL et al. Meat and dairy foodconsumption and breast cancer: a pooled analysis of cohort studies. Int J Epidemiol 2002;31(1):78–85.592. Bandera EV, Kushi LH, Moore DF, Gifkins DM, McCullough ML. Consumption of animal foods andendometrial cancer risk: a systematic literature review and meta-analysis. Cancer Causes Control2007;18(9):967–88.593. Bonjour JP, Brandolini-Bunlon M, Boirie Y, Morel-Laporte F, Braesco V, Bertiere MC et al. Inhibition of boneturnover by milk intake in postmenopausal women. Br J Nutr 2008;100(4):866–74.594. Hartman JW, Tang JE, Wilkinson SB, Tarnopolsky MA, Lawrence RL, Fullerton AV et al. Consumption offat-free fluid milk after resistance exercise promotes greater lean mass accretion than does consumptionof soy or carbohydrate in young, novice, male weightlifters. Am J Clin Nutr 2007;86(2):373.595. Javaid MK, Crozier SR, Harvey NC, Taylor P, Inskip HM, Godfrey KM et al. Maternal and seasonalpredictors of change in calcaneal quantitative ultrasound during pregnancy. J Clin Endocrinol Metab2005;90(9):5182–7.596. Lanou AJ, Berkow SE, Barnard ND. Calcium, dairy products, and bone health in children and young adults:a reevaluation of the evidence. Pediatrics 2005;115(3):736–43.597. Teegarden D, Legowski P, Gunther CW, McCabe GP, Peacock M, Lyle RM. <strong>Dietary</strong> calcium intakeprotects women consuming oral contraceptives from spine and hip bone loss. J Clin Endocrinol Metab2005;90(9):5127–33.598. Volek JS, Gomez AL, Scheett TP, Sharman MJ, French DN, Rubin MR et al. Increasing fluid milk favorablyaffects bone mineral density responses to resistance training in adolescent boys. J Am Diet Assoc2003;103(10):1353–6.599. Feskanich D, Willett WC, Colditz GA. Calcium, vitamin D, milk consumption, and hip fractures: a prospectivestudy among postmenopausal women. Am J Clin Nutr 2003;77(2):504.600. Kanis JA, Johansson H, Oden A, De Laet C, Johnell O, Eisman JA et al. A meta-analysis of milk intakeand fracture risk: low utility for case finding. Osteoporos Int 2005;16(7):799–804.601. Griffith LE, Guyatt GH, Cook RJ, Bucher HC, Cook DJ. The influence of dietary and nondietary calciumsupplementation on blood pressure: an updated metaanalysis of randomized controlled trials. Am JHypertens 1999;12(1 Pt 1):84–92.602. Clare DA, Swaisgood HE. Bioactive milk peptides: a prospectus. J Dairy Sci 2000;83(6):1187–95.603. Bolland MJ, Avenell A, Baron JA, Grey A, MacLennan GS, Gamble GD et al. Effect of calcium supplementson risk of myocardial infarction and cardiovascular events: meta-analysis. Br Med J 2010;341:c3691.604. Bolland MJ, Grey A, Avenell A, Gamble GD, Reid IR. Calcium supplements with or without vitamin D andrisk of cardiovascular events: reanalysis of the Women’s <strong>Health</strong> Initiative limited access dataset and metaanalysis.BMJ 2011;342:d2040.605. Green JH, Booth C, Bunning R. Postprandial metabolic responses to milk enriched with milk calcium aredifferent from responses to milk enriched with calcium carbonate. Asia Pac J Clin Nutr 2003;12(1):109–19.606. Resnick L, DiFabio B, Marion R, James G, Laragh J. <strong>Dietary</strong> calcium modifies the pressor effects of dietarysalt intake in essential hypertension. J Hypertens 1986;4(suppl 6):S679–S81.ReferencesNational <strong>Health</strong> and Medical Research Council183
607. Kalkwarf HJ, Khoury JC, Lanphear BP. Milk intake during childhood and adolescence, adult bone density,and osteoporotic fractures in US women. Am J Clin Nutr 2003;77(1):257–65.608. Albala C, Ebbeling CB, Cifuentes M, Lera L, Bustos N, Ludwig DS. Effects of replacing the habitualconsumption of sugar-sweetened beverages with milk in Chilean children. Am J Clin Nutr 2008;88(3):605–11.609. Einarson A, Tam C, Erebara A, Koren G. Food-borne illnesses during pregnancy. Can Fam Physician2010;56(9):869–70.610. Brand JC, Darnton-Hill I, Gracey MS, Spargo RM. Lactose malabsorption in Australian Aboriginal children.Am J Clin Nutr 1985;41(3):620–2.611. Buttenshaw R, Sheridan J, Tye V, Miller O, Carseldine JBD. Lactose malabsorption and its temporalstability in Aboriginal children. Proc Nutr Soc Aust 1990;15:228.612. Shaukat A, Levitt MD, Taylor BC, MacDonald R, Shamliyan TA, Kane RL et al. Systematic review:effective management strategies for lactose intolerance. Ann Intern Med 2010;152(12):797–803.613. Kleiner SM. Water: an essential but overlooked nutrient. J Amer Diet Assoc 1999;99(2):200-6.614. Pfeil LA, Katz PR, Davis PJ. Water metabolism. In: Morley JE, Glick Z, Rubenstein LZ, eds. Geriatricnutrition: a comprehensive view. 2nd edition ed. New York: Raven Press, 1995.615. Cheung SS, McLellan TM. Influence of hydration status and fluid replacement on heat tolerance whilewearing NBC protective clothing. Eur J Appl Physiol Occupat Physiol 1998;77(1):139–48.616. Hubbard RW, Armstrong LE. The heat illnesses: biochemical, ultrastructural, and fluid-electrolyteconsiderations. In: Pandolf KB, Sawka MN, Gonzalez RR, eds. Human performance physiology andenvironmental medicine at terrestrial extremes: Indianapolis: Benchmark Press, Inc, 1988: 305–60.617. Gardner E, Ruxton C, Leeds A. Black tea–helpful or harmful? A review of the evidence. Eur J Clin Nutr2006;61(1):3–18.618. Greenberg JA, Chow G, Ziegelstein RC. Caffeinated coffee consumption, cardiovascular disease, andheart valve disease in the elderly (from the Framingham Study). Am J Cardiol 2008;102(11):1502–8.619. Kuriyama S. The relation between green tea consumption and cardiovascular disease as evidenced byepidemiological studies. J Nutr 2008;138(8):1548S.620. Lagiou P, Samoli E, Lagiou A, Tzonou A, Kalandidi A, Peterson J et al. Intake of specific flavonoid classesand coronary heart disease--a case-control study in Greece. Eur J Clin Nutr 2004;58(12):1643–8.621. Sesso HD, Paffenbarger RS, Oguma Y, Lee I. Lack of association between tea and cardiovascular diseasein college alumni. Int J Epidemiol 2003;32(4):527.622. Fraser ML, Mok GS, Lee AH. Green tea and stroke prevention: emerging evidence. Complement TherMed 2007;15(1):46–53.623. Okamoto K. Habitual green tea consumption and risk of an aneurysmal rupture subarachnoid hemorrhage:a case-control study in Nagoya, Japan. Eur J Epidemiol 2006;21(5):367–71.624. Tanabe N, Suzuki H, Aizawa Y, Seki N. Consumption of green and roasted teas and the risk of strokeincidence: results from the Tokamachi-Nakasato cohort study in Japan. Int J Epidemiol 2008;37(5):1030–40.625. Arab L, Liu W, Elashoff D. Green and black tea consumption and risk of stroke: a meta-analysis. Stroke2009;40(5):1786–92.626. Hammar N, Andersson T, Alfredsson L, Reuterwall C, Nilsson T, Hallqvist J et al. Association of boiled andfiltered coffee with incidence of first nonfatal myocardial infarction: the SHEEP and the VHEEP study.J Intern Med 2003;253(6):653–9.627. Klatsky AL, Koplik S, Kipp H, Friedman GD. The confounded relation of coffee drinking to coronary arterydisease. Am J Cardiol 2008;101(6):825–7.184EAT FOR HEALTH – australian dietary guidelinesNational <strong>Health</strong> and Medical Research Council
628. Rosner SA, Åkesson A, Stampfer MJ, Wolk A. Coffee consumption and risk of myocardial infarctionamong older Swedish women. Am J Epidemiol 2007;165(3):288.629. Sofi F, Conti AA, Gori AM, Eliana Luisi ML, Casini A, Abbate R et al. Coffee consumption and risk ofcoronary heart disease: a meta-analysis. Nutr Metab Cardiovasc Dis 2007;17(3):209–23.630. Greenberg JA, Axen KV, Schnoll R, Boozer CN. Coffee, tea and diabetes: the role of weight loss andcaffeine. Int J Obes (Lond) 2005;29(9):1121–9.631. Hamer M, Witte DR, Mosdøl A, Marmot MG, Brunner EJ. Prospective study of coffee and tea consumptionin relation to risk of type 2 diabetes mellitus among men and women: The Whitehall II study. Br J Nutr2008;100(05):1046–53.632. Hu G, Jousilahti P, Peltonen M, Bidel S, Tuomilehto J. Joint association of coffee consumption and otherfactors to the risk of type 2 diabetes: a prospective study in Finland. Int J Obes (Lond) 2006;30(12):1742–9.633. Odegaard AO, Pereira MA, Koh WP, Arakawa K, Lee HP, Yu MC. Coffee, tea, and incident type 2 diabetes:the Singapore Chinese <strong>Health</strong> Study. Am J Clin Nutr 2008;88(4):979–85.634. Paynter NP, Yeh HC, Voutilainen S, Schmidt MI, Heiss G, Folsom AR et al. Coffee and sweetenedbeverage consumption and the risk of type 2 diabetes mellitus: the atherosclerosis risk in communitiesstudy. Am J Epidemiol 2006;164(11):1075–84.635. Smith B, Wingard DL, Smith TC, Kritz-Silverstein D, Barrett-Connor E. Does coffee consumption reducethe risk of type 2 diabetes in individuals with impaired glucose? Diabetes Care 2006;29(11):2385.636. van Dam RM, Hu FB. Coffee consumption and risk of type 2 diabetes: a systematic review. J Am MedAssoc 2005;294(1):97–104.637. van Dam RM, Willett WC, Manson JE, Hu FB. Coffee, caffeine, and risk of type 2 diabetes: a prospectivecohort study in younger and middle-aged U.S. women. Diabetes Care 2006;29(2):398–403.638. Tang N, Zhou B, Wang B, Yu R. Coffee consumption and risk of breast cancer: a metaanalysis. Am J ObstetGynecol 2009;200(3):290 e1–9.639. Michels KB, Willett WC, Fuchs CS, Giovannucci E. Coffee, tea, and caffeine consumption and incidenceof colon and rectal cancer. J Natl Cancer Inst 2005;97(4):282–92.640. Lee KJ, Inoue M, Otani T, Iwasaki M, Sasazuki S, Tsugane S. Coffee consumption and risk ofcolorectal cancer in a population-based prospective cohort of Japanese men and women. Int J Cancer2007;121(6):1312–8.641. Tavani A, La Vecchia C. Coffee, decaffeinated coffee, tea and cancer of the colon and rectum: a reviewof epidemiological studies, 1990-2003. Cancer Causes Control 2004;15(8):743–57.642. Steevens J, Schouten LJ, Verhage BA, Goldbohm RA, van den Brandt PA. Tea and coffee drinkingand ovarian cancer risk: results from the Netherlands Cohort Study and a meta-analysis. Br J Cancer2007;97(9):1291–4.643. Song YJ, Kristal AR, Wicklund KG, Cushing-Haugen KL, Rossing MA. Coffee, tea, colas, and risk ofepithelial ovarian cancer. Cancer Epidemiol Biomarkers Prev 2008;17(3):712–6.644. Silvera SA, Jain M, Howe GR, Miller AB, Rohan TE. Intake of coffee and tea and risk of ovarian cancer:a prospective cohort study. Nutr Cancer 2007;58(1):22–7.645. Bravi F, Scotti L, Bosetti C, Gallus S, Negri E, La Vecchia C et al. Coffee drinking and endometrial cancerrisk: a metaanalysis of observational studies. Am J Obstet Gynecol 2009;200(2):130–35.646. Larsson SC, Giovannucci E, Wolk A. Coffee consumption and stomach cancer risk in a cohort of Swedishwomen. Int J Cancer 2006;119(9):2186–9.647. Bravi F, Bosetti C, Tavani A, Bagnardi V, Gallus S, Negri E et al. Coffee drinking and hepatocellularcarcinoma risk: a meta-analysis. Hepatology 2007;46(2):430–5.ReferencesNational <strong>Health</strong> and Medical Research Council185
648. Su LJ, Arab L. Tea consumption and the reduced risk of colon cancer -- results from a national prospectivecohort study. Public <strong>Health</strong> Nutr 2002;5(3):419–25.649. Dora I, Arab L, Martinchik A, Sdvizhkov A, Urbanovich L, Weisgerber U. Black tea consumption and riskof rectal cancer in Moscow population. Ann Epidemiol 2003;13(6):405–11.650. Kristensen M, Jensen M, Kudsk J, Henriksen M, Molgaard C. Short-term effects on bone turnoverof replacing milk with cola beverages: a 10-day interventional study in young men. Osteoporos Int2005;16(12):1803–8.651. Libuda L, Alexy U, Remer T, Stehle P, Schoenau E, Kersting M. Association between long-termconsumption of soft drinks and variables of bone modeling and remodeling in a sample of healthyGerman children and adolescents. Am J Clin Nutr 2008;88(6):1670.652. Manias K, McCabe D, Bishop N. Fractures and recurrent fractures in children; varying effects ofenvironmental factors as well as bone size and mass. Bone 2006;39(3):652–7.653. Tucker KL, Morita K, Qiao N, Hannan MT, Cupples LA, Kiel DP. Colas, but not other carbonated beverages,are associated with low bone mineral density in older women: The Framingham Osteoporosis Study.Am J Clin Nutr 2006;84(4):936.654. Ahokas JT, Demos L, Donohue DC, Killalea S, McNeil J, Rix CJ. Review of water fluoridation and fluorideintake from discretionary fluoride supplements. Melbourne: National <strong>Health</strong> and Medical ResearchCouncil, 1999.655. Young WG. Tooth wear: diet analysis and advice. Int Dent J 2005;55(2):68–72.656. Kazoullis S, Seow WK, Holcombe T, Newman B, <strong>For</strong>d D. Common dental conditions associated withdental erosion in schoolchildren in Australia. Pediatr Dent 2007;29(1):33–9.657. American Academy of Pediatrics. Soft drinks in schools. Pediatrics 2004;113(1 Pt 1):152–4.658. Keijzers GB, De Galan BE, Tack CJ, Smits P. Caffeine can decrease insulin sensitivity in humans.Diabetes Care 2002;25(2):364.659. Yoshioka K, Kogure A, Yoshida T, Yoshikawa T. Coffee consumption and risk of type 2 diabetes mellitus.Lancet 2003;361(9358):703.660. Lopez-Ridaura R, Willett WC, Rimm EB, Liu S, Stampfer MJ, Manson JAE et al. Magnesium intake andrisk of type 2 diabetes in men and women. Diabetes Care 2004;27(1):134.661. Curin Y, Andriantsitohaina R. Polyphenols as potential therapeutical agents against cardiovascular diseases.Pharmacological reports 2005;57:97.662. National <strong>Health</strong> and Medical Research Council. Australian Drinking Water <strong>Guidelines</strong> 6. Canberra2011.663. Commonwealth Department of <strong>Health</strong> and Ageing. <strong>Health</strong>y eating at various lifestages: Pregnant Women.2009 (cited). www.health.gov.au/internet/healthyactive/publishing.nsf/content/pregnant-women.http://www.patonsyarns.com/pattern.ph664. Mensink RP, Zock PL, Kester AD, Katan MB. Effects of dietary fatty acids and carbohydrates on the ratio ofserum total to HDL cholesterol and on serum lipids and apolipoproteins: a meta-analysis of 60 controlledtrials. Am J Clin Nutr 2003;77(5):1146–55.665. Ratnayake WM, Galli C. Fat and fatty acid terminology, methods of analysis and fat digestion andmetabolism: a background review paper. Ann Nutr Metab 2009;55(1-3):8–43.666. Truswell AS. Review of dietary intervention studies: effect on coronary events and on total mortalityAust NZ J Med 1994;24:98-106.667. Hooper L, Summerbell CD, Thompson R, Sills D, Roberts FG, Moore H et al. Reduced or modifieddietary fats for preventing cardiovascular disease. The Cochrane Library 2011;July 2011.668. Skeaff M, Miller J. <strong>Dietary</strong> fat and coronary heart disease: Summary of evidence from prospectivecohort and randomised controlled trials. Annals of nutrition and metabolism 2009;55(1-3):173-U287.186EAT FOR HEALTH – australian dietary guidelinesNational <strong>Health</strong> and Medical Research Council
669. Siri-Tarino PW, Sun Q, Hu FB, Krauss RM. Meta-analysis of prospective cohort studies evaluating theassociatation of saturated fat with cardiovascular disease. The American Journal of Clinical Nutrition2010;91(3):535-46.670. Danaei G et al. The preventable causes of death in the United States: Comparative risk assessment ofdietary lifestyle and metabolic risk factors. PLoS Medicine 2009;6(4):e1000058.671. Food Standards Australia New Zealand. Review Report: Trans fatty acids in the New Zealand and Australianfood supply. In: Food Standards Australia New Zealand, editor. Canberra2009.672. Melanson EL, Astrup A, Donahoo WT. The relationship between dietary fat and fatty acid intake and bodyweight, diabetes, and the metabolic syndrome. Ann Nutr Metab 2009;55(1-3):229–43.673. Balk EM, Lichtenstein AH, Chung M, Kupelnick B, Chew P, Lau J. Effects of omega-3 fatty acids oncoronary restenosis, intima-media thickness, and exercise tolerance: A systematic review. Atherosclerosis2006;184(2):237–46.674. Balk EM, Lichtenstein AH, Chung M, Kupelnick B, Chew P, Lau J. Effects of omega-3 fatty acids on serummarkers of cardiovascular disease risk: a systematic review. Atherosclerosis 2006;189(1):19–30.675. Castro IA, Barroso LP, Sinnecker P. Functional foods for coronary heart disease risk reduction: a metaanalysisusing a multivariate approach. Am J Clin Nutr 2005;82(1):32–40.676. Eslick GD, Howe PR, Smith C, Priest R, Bensoussan A. Benefits of fish oil supplementation inhyperlipidemia: a systematic review and meta-analysis. Int J Cardiol 2009;136(1):4–16.677. Hooper L, Harrison RA, Summerbell DC, Moore H, Worthington HV, Ness A et al. Omega 3 fatty acids forprevention and treatment of cardiovascular disease. Cochrane Database Syst Rev 2004(4):CD003177.678. Lee KW, Lip GYH. Effects of lifestyle on hemostasis, fibrinolysis, and platelet reactivity: a systematicreview. Arch Intern Med 2003;163(19):2368–92.679. Studer M, Briel M, Leimenstoll B, Glass TR, Bucher HC. Effect of different antilipidemic agents and dietson mortality: a systematic review. Arch Intern Med 2005;165(7):725.680. Wang C, Harris WS, Chung M, Lichtenstein AH, Balk EM, Kupelnick B et al. n-3 fatty acids from fish orfish-oil supplements, but not alpha-linolenic acid, benefit cardiovascular disease outcomes in primaryandsecondary-prevention studies: a systematic review. Am J Clin Nutr 2006;84(1):5–17.681. Wendland E, Farmer A, Glasziou P, Neil A. Effect of alpha linolenic acid on cardiovascular risk markers:a systematic review. Heart 2006;92(2):166–69.682. Nations FaAOotU. Fats and fatty acids in human nutrition. Report of an expert consultation. Rome:Food and Agriculture Organization of the United Nations 2010. Available from: http://www.fao.org/ag/agn/nutrition/Call_for_experts.pdf683. Ulbak J, Lauritzen L, Hansen HS, Michaelsen KF. Diet and blood pressure in 2.5-y-old Danish children.Am J Clin Nutr 2004;79(6):1095–102.684. Schack-Nielsen L, Mølgaard C, Larsen D, Martyn C, Michaelsen KF. Arterial stiffness in 10-year-oldchildren: current and early determinants. Br J Nutr 2005;94(6):1004–11.685. Sanders TAB, Gleason K, Griffin B, Miller GJ. Influence of an algal triacylglycerol containingdocosahexaenoic acid (22:6n-3) and docosahentaenoic acid (22:5n-6) on cardiovascular risk factors inhealthy men and women. Br J Nutr 2006;95(3):525–31.686. Raitakari OT, RÃnnemaa T, Järvisalo MJ, Kaitosaari T, Volanen I, Kallio K et al. Endothelial function inhealthy 11-year-old children after dietary intervention with onset in infancy: the Special Turku CoronaryRisk Factor Intervention Project for children (STRIP). Circulation 2005;112(24):3786–94.687. Psaltopoulou T, Naska A, Orfanos P, Trichopoulos D, Mountokalakis T, Trichopoulou A. Olive oil, theMediterranean diet, and arterial blood pressure: the Greek European Prospective Investigation intoCancer and Nutrition (EPIC) study [corrected] [published erratum appears in AM J CLIN NUTR 2005May;81(5):1181]. Am J Clin Nutr 2004;80(4):1012–18.ReferencesNational <strong>Health</strong> and Medical Research Council187
688. Perona JS, Canizares J, Montero E, Sanchez-Dominguez JM, Ruiz-Gutierrez V, Perona JS et al. Plasmalipid modifications in elderly people after administration of two virgin olive oils of the same variety(Olea europaea var. hojiblanca) with different triacylglycerol composition. Br J Nutr 2003;89(6):819–26.689. Bondia-Pons I, Schroder H, Covas MI, Castellote AI, Kaikkonen J, Poulsen HE et al. Moderate consumptionof olive oil by healthy European men reduces systolic blood pressure in non-Mediterranean participants.J Nutr 2007;137(1):84–7.690. Alonso A, Martinez-Gonzalez MA, Alonso A, Martinez-Gonzalez MA. Olive oil consumption and reducedincidence of hypertension: the SUN study. Lipids 2004;39(12):1233–8.691. Damsgaard CT, Frøkiaer H, Andersen AD, Lauritzen L. Fish oil in combination with high or low intakesof linoleic acid lowers plasma triacylglycerols but does not affect other cardiovascular risk markers inhealthy men. J Nutr 2008;138(6):1061–66.692. Berry SE, Miller GJ, Sanders TA, Berry SEE, Miller GJ, Sanders TAB. The solid fat content of stearicacid-rich fats determines their postprandial effects. Am J Clin Nutr 2007;85(6):1486–94.693. Eckel RH, Hernandez TL, Bell ML, Weil KM, Shepard TY, Grunwald GK et al. Carbohydrate balancepredicts weight and fat gain in adults. Am J Clin Nutr 2006;83(4):803–08.694. Kratz M, von Eckardstein A, Fobker M, Buyken A, Posny N, Schulte H et al. The impact of dietary fatcomposition on serum leptin concentrations in healthy nonobese men and women. J Clin EndocrinolMetabol 2002;87(11):5008–14.695. Lovegrove JA, Lovegrove SS, Lesauvage SVM, Brady LM, Saini N, Minihane AM et al. Moderate fishoilsupplementation reverses low-platelet, long-chain n-3 polyunsaturated fatty acid status and reducesplasma triacylglycerol concentrations in British Indo-Asians. Am J Clin Nutr 2004;79(6):974–82.696. Nicholls SJ, Lundman P, Harmer JA, Cutri B, Griffiths KA, Rye KA et al. Consumption of saturated fatimpairs the anti-inflammatory properties of high-density lipoproteins and endothelial function. J Am CollCardiol 2006;48(4):715–20.697. Nosaka N, Kasai M, Nakamura M, Takahashi I, Itakura M, Takeuchi H et al. Effects of dietary medium-chaintriacylglycerols on serum lipoproteins and biochemical parameters in healthy men. Biosci Biotech Biochem2002;66(8):1713–8.698. Owen B, Wolever TMS. Effect of fat on glycaemic responses in normal subjects: a dose-response study.Nutr Res 2003;23(10):1341–47.699. Rueda-Clausen CF, Silva FA, Lindarte MA, Villa-Roel C, Gomez E, Gutierrez R et al. Olive, soybean and palmoils intake have a similar acute detrimental effect over the endothelial function in healthy young subjects.Nutr Metab Cardiovasc Dis 2007;17(1):50–57.700. Tahvonen RL, Schwab US, Linderborg KM, Mykkänen HM, Kallio HP. Black currant seed oil and fish oilsupplements differ in their effects on fatty acid profiles of plasma lipids, and concentrations of serumtotal and lipoprotein lipids, plasma glucose and insulin. J Nutr Biochem 2005;16(6):353–59.701. Tholstrup T, Raff M, Basu S, Nonboe P, Sejrsen K, Straarup EM. Effects of butter high in ruminant transand monounsaturated fatty acids on lipoproteins, incorporation of fatty acids into lipid classes, plasmaC-reactive protein, oxidative stress, hemostatic variables, and insulin in healthy young men. Am J ClinNutr 2006;83(2):237–43.702. MacLean CH, Newberry SJ, Mojica WA, Khanna P, Issa AM, Suttorp MJ et al. Effects of omega-3 fattyacids on cancer risk: a systematic review. J Am Med Assoc 2006;295(4):403–15.703. van de Rest O, Geleijnse JM, Kok FJ, van Staveren WA, Hoefnagels WH, Beekman ATF et al. Effect offish-oil supplementation on mental well-being in older subjects: a randomized, double-blind, placebocontrolledtrial. Am J Clin Nutr 2008;88(3):706–13.704. Laitinen M, Ngandu T, Rovio S, Helkala E, Uusitalo U, Viitanen M et al. Fat intake at midlife and riskof dementia and Alzheimer’s disease: a population-based study. Dementia Geriatric Cognitive Dis2006;22(1):99–107.188EAT FOR HEALTH – australian dietary guidelinesNational <strong>Health</strong> and Medical Research Council
705. Mamalakis G, Kiriakakis M, Tsibinos G, Hatzis C, Flouri S, Mantzoros C et al. Depression and serumadiponectin and adipose omega-3 and omega-6 fatty acids in adolescents. Pharmacol Biochem Behav2006;85(2):474–79.706. Morris MC, Evans DA, Bienias JL, Tangney CC, Bennett DA, Wilson RS et al. Consumption of fish and n-3fatty acids and risk of incident Alzheimer disease. Arch Neurol 2003;60(7):940–46.707. Hiroi M, Nagahara Y, Miyauchi R, Misaki Y, Goda T, Kasezawa N et al. The combination of genetic variationsin the PRDX3 gene and dietary fat intake contribute to obesity risk. Obesity (Silver Spring) 2010.708. Fantuzzi G. Adipose tissue, adipokines, and inflammation. J Allergy Clin Immunol 2005;115(5):911–19.709. Jain SS, Bird RP. Elevated expression of tumor necrosis factor-alpha signaling molecules in colonic tumorsof Zucker obese (fa/fa) rats. Int J Cancer 2010;127(9):2042–50.710. Renehan AG, Soerjomataram I, Tyson M, Egger M, Zwahlen M, Coebergh JW et al. Incident cancer burdenattributable to excess body mass index in 30 European countries. Int J Cancer 2010;126(3):692–702.711. Alberti KG, Eckel RH, Grundy SM, Zimmet PZ, Cleeman JI, Donato KA et al. Harmonizing the metabolicsyndrome: a joint interim statement of the International Diabetes Federation Task <strong>For</strong>ce on Epidemiologyand Prevention; National Heart, Lung, and Blood Institute; American Heart Association; World HeartFederation; International Atherosclerosis Society; and International Association for the Study of Obesity.Circulation 2009;120(16):1640–5.712. Baghurst K. <strong>Dietary</strong> fats, marbling and human health. Australian Journal of Experimental Agriculture2004;44:635-44.713. National Heart Foundation of Australia (National Blood Pressure and Vascular Disease AdvisoryCommittee). Guide to management of hypertension. National Heart Foundation of Australia; 2008.714. Sacks FM, Pfeffer MA, Moye LA, Rouleau JL, Rutherford JD, Cole TG et al. The effect of pravastatin oncoronary events after myocardial infarction in patients with average cholesterol levels. N Engl J Med1996;335(14):1001–9.715. Ramsden CE, Hibbeln JR, Majchrzak SF, Davis JM. n-6 fatty acid-specific and mixed polyunsaturatedietary interventions have different effects on CHD risk: a meta-analysis of randomised controlled trials.Br J Nutr 2010;104(11):1586–600.716. Brown MA, Storlien LH, Huang X-F, Tapsell LC, Else PL, Higgins JA et al. <strong>Dietary</strong> fat and carbohydratecomposition: Metabolic disease. In: Montmayeur J-P, leCoutre J, eds. Fat detection: taste, texture andpost ingestive effects. Florida: CRC Press 2010.717. Galli C, Calder PC. Effects of fat and fatty acid intake on inflammatory and immune responses: a criticalreview. Ann Nutr Metab 2009;55(1-3):123–39.718. Crawford MA, Bazinet RP, Sinclair AJ. Fat intake and CNS functioning: ageing and disease. Ann NutrMetab 2009;55(1-3):202–28.719. Daniels SR, Greer FR. Lipid screening and cardiovascular health in childhood. Pediatrics 2008;122(1):198–208.720. McGill HC, McMahan CA, Gidding SS. Are pediatricians responsible for prevention of adult cardiovasculardisease? Nat Clin Pract Cardiovasc Med 2009;6(1):10–1.721. Niinikoski H, Lagstrom H, Jokinen E, Siltala M, Ronnemaa T, Viikari J et al. Impact of repeated dietarycounseling between infancy and 14 years of age on dietary intakes and serum lipids and lipoproteins:the STRIP study. Circulation 2007;116(9):1032.722. Clarke R, Emberson JR, Parish S, Palmer A, Shipley M, Linksted P et al. Cholesterol fractionsand apolipoproteins as risk factors for heart disease mortality in older men. Arch Intern Med2007;167(13):1373–8.723. U.S. Department of <strong>Health</strong>, Education, Welfare. <strong>Health</strong>y People - The Surgeon General’s report on healthpromotion and disease prevention Washington D.C.: U.S. Department of <strong>Health</strong>, Education and Welfare,1979. http://profiles.nlm.nih.gov/ps/access/NNBBGK.pdfReferencesNational <strong>Health</strong> and Medical Research Council189
724. Jürgens G, Graudal Niels A. Effects of low sodium diet versus high sodium diet on blood pressure, renin,aldosterone, catecholamines, cholesterols, and triglyceride. Cochrane Database Syst Rev 2004(1).725. Hooper L, Bartlett C, Davey SG, Ebrahim S, Davey SG. Advice to reduce dietary salt for prevention ofcardiovascular disease.[update of Cochrane Database Syst Rev. 2003;(3):CD003656; PMID: 12917977].Cochrane Database Syst Rev 2004(1):CD003656.726. He FJ, MacGregor GA. Effect of longer-term modest salt reduction on blood pressure. Cochrane DatabaseSyst Rev 2004(3):CD004937.727. Geleijnse JM, Kok FJ, Grobbee DE. Impact of dietary and lifestyle factors on the prevalence ofhypertension in Western populations. Eur J Public <strong>Health</strong> 2004;14(3):235–39.728. Chen J, Gu D, Huang J, Rao DC, Jaquish CE, Hixson JE et al. Metabolic syndrome and salt sensitivityof blood pressure in non-diabetic people in China: a dietary intervention study.[see comment]. Lancet2009;373(9666):829–35.729. Charlton KE, Steyn K, Levitt NS, Peer N, Jonathan D, Gogela T et al. A food-based dietary strategy lowersblood pressure in a low socio-economic setting: a randomised study in South Africa. Public <strong>Health</strong> Nutr2008;11(12):1397–406.730. China Salt Substitute Study Collaborative G. Salt substitution: a low-cost strategy for blood pressurecontrol among rural Chinese. A randomized, controlled trial.[see comment]. J Hypertens 2007;25(10):2011–8.731. Takahashi Y, Sasaki S, Okubo S, Hayashi M, Tsugane S. Blood pressure change in a free-living populationbaseddietary modification study in Japan. J Hypertens 2006;24(3):451–58.732. Robertson JI, Robertson JIS. <strong>Dietary</strong> salt and hypertension: a scientific issue or a matter of faith? J EvalClin Pract 2003;9(1):1–22.733. Obarzanek E, Proschan MA, Vollmer WM, Moore TJ, Sacks FM, Appel LJ et al. Individual blood pressureresponses to changes in salt intake: results from the DASH-Sodium trial.[see comment]. Hypertension2003;42(4):459–67.734. Nowson CA, Wattanapenpaiboon N, Pachett A, Nowson CA, Wattanapenpaiboon N, Pachett A. Low-sodiumdietary approaches to stop hypertension-type diet including lean red meat lowers blood pressure inpostmenopausal women. Nutr Res 2009;29(1):8–18.735. Melander O, von Wowern F, Frandsen E, Burri P, Willsteen G, Aurell M et al. Moderate salt restrictioneffectively lowers blood pressure and degree of salt sensitivity is related to baseline concentration ofrenin and N-terminal atrial natriuretic peptide in plasma. J Hypertens 2007;25(3):619–27.736. Kawano Y, Ando K, Matsuura H, Tsuchihashi T, Fujita T, Ueshima H et al. Report of the working group fordietary salt reduction of the Japanese Society of Hypertension: (1) Rationale for salt restriction and saltrestrictiontarget level for the management of hypertension. Hypertens Res Clin Exp 2007;30(10):879–86.737. Geleijnse JM, Kok FJ, Grobbee DE. Blood pressure response to changes in sodium and potassium intake:a metaregression analysis of randomised trials. J Hum Hypertens 2003;17(7):471–80.738. Dickinson KM, Keogh JB, Clifton PM. Effects of a low-salt diet on flow-mediated dilatation in humans.Am J Clin Nutr 2009;89(2):485–90.739. Dickinson BD, Havas S. Reducing the population burden of cardiovascular disease by reducing sodiumintake: a report of the council on science and public health. Arch Intern Med 2007;167(14):1460–68.740. Geleijnse JM, Grobbee DE. High salt intake early in life: does it increase the risk of hypertension?J Hypertens 2002;20(11):2121–24.741. Beevers DG. The epidemiology of salt and hypertension. Clinical Autonomic Research 2002;12(5):353–7.742. Chang HY, Hu YW, Yue CS, Wen YW, Yeh WT, Hsu LS et al. Effect of potassium-enriched salt oncardiovascular mortality and medical expenses of elderly men. Am J Clin Nutr 2006;83(6):1289–96.190EAT FOR HEALTH – australian dietary guidelinesNational <strong>Health</strong> and Medical Research Council
743. Cook NR, Cutler JA, Obarzanek E, Buring JE, Rexrode KM, Kumanyika SK et al. Long term effects ofdietary sodium reduction on cardiovascular disease outcomes: observational follow-up of the trials ofhypertension prevention (TOHP). Br Med J 2007;334(7599):885–88.744. Cook NR, Obarzanek E, Cutler JA, Buring JE, Rexrode KM, Kumanyika SK et al. Joint effects of sodium andpotassium intake on subsequent cardiovascular disease: the Trials of Hypertension Prevention follow-upstudy. Arch Intern Med 2009;169(1):32–40.745. He J, Ogden LG, Bazzano LA, Vupputuri S, Loria C, Whelton PK. <strong>Dietary</strong> sodium intake and incidence ofcongestive heart failure in overweight US men and women: first National <strong>Health</strong> and Nutrition ExaminationSurvey Epidemiologic Follow-up Study. Arch Intern Med 2002;162(14):1619–24.746. Reddy KS, Katan MB. Diet, nutrition and the prevention of hypertension and cardiovascular diseases...Diet, Nutrition and the Prevention of Chronic Diseases: scientific background papers of the Joint WHO/FAO Expert Consultation (Geneva, 28 January-1 February 2002). Public <strong>Health</strong> Nutr 2004;7(1A):167–86.747. Lawes CM, Vander Hoorn S, Rodgers A. Global burden of blood-pressure-related disease, 2001. Lancet2008;371(9623):1513–8.748. Law MR, Morris JK, Wald NJ. Use of blood pressure lowering drugs in the prevention of cardiovasculardisease: meta-analysis of 147 randomised trials in the context of expectations from prospectiveepidemiological studies. Br Med J 2009;338:b1665.749. Key TJ, Schatzkin A, Willett WC, Allen NE, Spencer EA, Travis RC. Diet, nutrition and the prevention ofcancer. Public <strong>Health</strong> Nutr 2004;7(1A):187–200.750. Commonwealth Department of <strong>Health</strong>. <strong>Dietary</strong> guidelines for Australians. Canberra: CommonwealthDepartment of <strong>Health</strong>, 1982.751. National <strong>Health</strong> and Medical Research Council. <strong>Dietary</strong> guidelines for Australians. Canberra: Commonwealthof Australia, 1992. http://www.nhmrc.gov.au/_files_nhmrc/file/publications/synopses/withdrawn/n4.pdf752. Food Standards Australia New Zealand. Food Standards Code- Standard 1.2.8- Clause 17(1). 2012.753. Food Standards Australia and New Zealand. Final assessment report - Proposal P230 – Considerationof mandatory fortification with iodine for New Zealand. Wellington: Food Standards Australia NewZealand, 2008 12 February 2008. http://www.foodstandards.gov.au/foodstandards/proposals/proposalp230iodinefo2802.cfm754. Duley L, Henderson-Smart D. Reduced salt intake compared to normal dietary salt, or high intake,in pregnancy. Cochrane Database Syst Rev 1999(2):CD001687.755. Food Standards Australia New Zealand. Food Standards Code – Standard 2.9.2 Foods for Infants. 2009.756. Krebs-Smith SM. Choose beverages and foods to moderate your intake of sugars: measurement requiresquantification. J Nutr 2001;131(2S-1):527S–35S.757. Marriott BP, Olsho L, Hadden L, Connor P. Intake of added sugars and selected nutrients in the UnitedStates, National <strong>Health</strong> and Nutrition Examination Survey (NHANES) 2003-2006. Crit Rev Food Sci Nutr2010;50(3):228–58.758. Australian Institute of <strong>Health</strong> and Welfare. <strong>Health</strong> expenditure Australia 2007-08, cat. no. HWE 46.Canberra: Australian Institute of <strong>Health</strong> and Welfare, 2009.759. Mann JI, Truswell AS, Manning EB. Effects on serum lipids of reducing dietary sucrose or starch for 22weeks in normal men. S Afr Med J 1972;46(25):827–34.760. Palmer JR, Boggs DA, Krishnan S, Hu FB, Singer M, Rosenberg L. Sugar-sweetened beverages andincidence of type 2 diabetes mellitus in African American women. Arch Intern Med 2008;168(14):1487–92.761. Laville M, Nazare JA. Diabetes, insulin resistance and sugars. Obes Rev 2009;10(Suppl 1):24–33.762. Esposito K, Kastorini CM, Panagiotakos DB, Giugliano D. Prevention of type 2 diabetes by dietary patterns:a systematic review of prospective studies and meta-analysis. Metab Syndr Relat Disord 2010;8(6):471–6.ReferencesNational <strong>Health</strong> and Medical Research Council191
763. Malik VS, Popkin BM, Bray GA, Despres JP, Willett WC, Hu FB. Sugar-sweetened beverages and risk ofmetabolic syndrome and type 2 diabetes: a meta-analysis. Diabetes Care 2010;33(11):2477–83.764. Fiorito LM, Marini M, Mitchell DC, Smiciklas-Wright H, Birch LL. Girls’ early sweetened carbonatedbeverage intake predicts different patterns of beverage and nutrient intake across childhood andadolescence. J Am Diet Assoc 2010;110(4):543–50.765. Libuda L, Alexy U, Sichert-Hellert W, Stehle P, Karaolis-Danckert N, Buyken AE et al. Pattern of beverageconsumption and long-term association with body-weight status in German adolescents--results from theDONALD study. Br J Nutr 2008;99(6):1370–9.766. Bes-Rastrollo M, Sanchez-Villegas A, Gomez-Gracia E, Martinez JA, Pajares RM, Martinez-Gonzalez MA.Predictors of weight gain in a Mediterranean cohort: the Seguimiento Universidad de Navarra Study 1.Am J Clin Nutr 2006;83(2):362–70; quiz 94–5.767. Silvera SA, Jain M, Howe GR, Miller AB, Rohan TE, Silvera SAN et al. <strong>Dietary</strong> carbohydrates and breastcancer risk: a prospective study of the roles of overall glycemic index and glycemic load.[erratum appearsin Int J Cancer. 2006 May 1;118(9):2372]. Int J Cancer 2005;114(4):653–8.768. Michaud DS, Liu S, Giovannucci E, Willett WC, Colditz GA, Fuchs CS et al. <strong>Dietary</strong> sugar, glycemic load,and pancreatic cancer risk in a prospective study. J Natl Cancer Inst 2002;94(17):1293–300.769. Michaud DS, Fuchs CS, Liu S, Willett WC, Colditz GA, Giovannucci E et al. <strong>Dietary</strong> glycemic load,carbohydrate, sugar, and colorectal cancer risk in men and women. Cancer Epidemiol Biomarkers Prev2005;14(1):138–47.770. De Stefani E, Boffetta P, Ronco AL, Deneo-Pellegrini H, Acosta G, Mendilaharsu M. <strong>Dietary</strong> patterns andrisk of bladder cancer: a factor analysis in Uruguay. Cancer Causes Control 2008;19(10):1243–9.771. Nothlings U, Murphy SP, Wilkens LR, Henderson BE, Kolonel LN. <strong>Dietary</strong> glycemic load, added sugars,and carbohydrates as risk factors for pancreatic cancer: the Multiethnic Cohort Study. Am J Clin Nutr2007;86(5):1495–501.772. Miller WD. Dental caries. Am J Dent Sci 1883;17:77–130.773. Burt BA, Eklund SA, Morgan KJ, Larkin FE, Guire KE, Brown LO et al. The effects of sugars intakeand frequency of ingestion on dental caries increment in a three-year longitudinal study. J Dent Res1988;67(11):1422–9.774. Warren JJ, Weber Gasparoni K, Marshall TA, Drake DR, Dehkordi Vakil F, Dawson DV et al. A longitudinalstudy of dental caries risk among very young low SES children. Community Dent Oral Epidemiol2009;37(2):116–22.775. Ruottinen S, Karjalainen S, Pienihäkkinen K, Lagström H, Niinikoski H, Salminen M et al. Sucrose intakesince infancy and dental health in 10-year-old children. Caries research 2000;38(2):142–48.776. Marshall TA, Eichenberger-Gilmore JM, Larson MA, Warren JJ, Levy SM. Comparison of the intakes ofsugars by young children with and without dental caries experience. J Am Dent Assoc 2007;138(1):39.777. Levy SM, Warren JJ, Broffitt B, Hillis SL, Kanellis MJ. Fluoride, beverages and dental caries in the primarydentition. Caries Res 2003;37(3):157–65.778. Anderson CA, Curzon ME, Van Loveren C, Tatsi C, Duggal MS. Sucrose and dental caries: a review of theevidence. Obes Rev 2009;10(Suppl 1):41–54.779. Gibson S, Williams S. Dental caries in pre-school children: associations with social class, toothbrushinghabit and consumption of sugars and sugar-containing foods. Further analysis of data from the NationalDiet and Nutrition Survey of children aged 1.5-4.5 years. Caries research 1999;33(2):101.780. American Academy of Pediatrics. Clinical practice guideline: Diagnosis and evaluation of the child withattention-deficit/hyperactivity disorder. Pediatrics 2000;105(5).781. Walsh LJ. Preventive dentistry for the general dental practitioner. Aust Dent J 2000;45(2):76–82.192EAT FOR HEALTH – australian dietary guidelinesNational <strong>Health</strong> and Medical Research Council
782. Balakrishnan M, Simmonds RS, Tagg JR. Dental caries is a preventable infectious disease. Aust Dent J2000;45(4):235–45.783. Mattes RD. <strong>Dietary</strong> compensation by humans for supplemental energy provided as ethanol orcarbohydrate in fluids. Physiol Behav 1996;59(1):179–87.784. Raben A, Vasilaras TH, Moller AC, Astrup A. Sucrose compared with artificial sweeteners: different effectson ad libitum food intake and body weight after 10 wk of supplementation in overweight subjects. Am JClin Nutr 2002;76(4):721–9.785. Lam M, Riedy CA, Coldwell SE, Milgrom P, Craig R. Children’s acceptance of xylitol-based foods.Community Dent Oral Epidemiol 2000;28(2):97–101.786. Davies MJ, Spencer AJ, Westwater A, Simmons B. Dental caries among Australian Aboriginal, non-AboriginalAustralian-born, and overseas-born children. Bull World <strong>Health</strong> Organ 1997;75(3):197.787. Ronksley PE, Brien SE, Turner BJ, Mukamal KJ, Ghali WA. Association of alcohol consumption withselected cardiovascular disease outcomes: a systematic review and meta-analysis. BMJ 2011;342:d671.788. Chikritzhs T, Fillmore K, Stockwell T. A healthy dose of scepticism: Four good reasons to think again aboutprotective effects of alcohol on coronary heart disease. Drug Alcohol Rev 2009;28(4):441–44.789. Stockwell T, Greer A, Fillmore K, Chikritzhs T, C. Z. <strong>Health</strong> benefits of moderate alcohol consumption:How good is the science? BMJ 2012;344(e2276).790. Calabria B, Doran CM, Vos T, Shakeshaft AP, Hall W. Epidemiology of alcohol related burden of diseaseamong Indigenous Australians. Aust N Z J Public <strong>Health</strong> 2010;34:S47–S51.791. Chikritzhs TN, Jonas HA, Stockwell TR, Heale PF, Dietze PM. Mortality and life-years lost due to alcohol:a comparison of acute and chronic causes. Med J Aust 2001;174(6):281–84.792. Collins DJ, Lapsley HM. The costs of tobacco, alcohol and illicit drug abuse to Australian society in2004/05. Canberra: Commonwealth Department of <strong>Health</strong> and Ageing, 2008. http://www.health.gov.au/internet/drugstrategy/publishing.nsf/Content/mono64793. Xiao J, Rowe T, Somerford P, Draper G, Martin J. Impact of alcohol on the population of Western Australia.In: Epidemiology Branch DoHW, editor. 2008.794. National <strong>Health</strong> and Medical Research Council. Australian guidelines to reduce health risks from drinkingalcohol. Canberra: Commonwealth of Australia; 2009.795. Banwell C. How many standard drinks are there in a glass of wine? Drug Alcohol Rev 1999;18(1):99–101.796. Arriola L, Martinez-Camblor P, Larranaga N, Basterretxea M, Amiano P, Moreno-Iribas C et al. Alcohol intakeand the risk of coronary heart disease in the Spanish EPIC cohort study. Heart 2010;96(2):124–30.797. Simons LA, McCallum J, Friedlander Y, Simons J. Alcohol intake and survival in the elderly: a 77 monthfollow-up in the Dubbo study. Aust N Z J Med 1996;26(5):662–70.798. Cullen KJ, Knuiman MW, Ward NJ. Alcohol and mortality in Busselton, Western Australia. Am J Epidemiol1993;137(2):242–8.799. Costanzo S, Di Castelnuovo A, Donati MB, Iacoviello L, de Gaetano G. Alcohol consumption and mortalityin patients with cardiovascular disease: a meta-analysis. J Am Coll Cardiol 2010;55(13):1339–47.800. Roerecke M, Rehm J. Ischemic heart disease mortality and morbidity rates in former drinkers:a meta-analysis. Am J Epidemiol 2011;173(3):245–58.801. Schooling CM, Wenjie S, Ho SY, Chan WM, Tham MK, Ho KS et al. Moderate alcohol use and mortalityfrom ischaemic heart disease: a prospective study in older Chinese people. PLoS One 2008;3(6).802. Sierksma A, van der Gaag MS, Kluft C, Hendriks HF, Hendriks HFJ. Moderate alcohol consumptionreduces plasma C-reactive protein and fibrinogen levels; a randomized, diet-controlled intervention study.Eur J Clin Nutr 2002;56(11):1130–6.ReferencesNational <strong>Health</strong> and Medical Research Council193
803. Badia E, Sacanella E, Fernandez-Sola J, Nicolas JM, Antunez E, Rotilio D et al. Decreased tumor necrosisfactor-induced adhesion of human monocytes to endothelial cells after moderate alcohol consumption.Am J Clin Nutr 2004;80(1):225–30.804. Hansen AS, Marckmann P, Dragsted LO, Finne Nielsen IL, Nielsen SE, Gronbaek M. Effect of red wine andred grape extract on blood lipids, haemostatic factors, and other risk factors for cardiovascular disease.Eur J Clin Nutr 2005;59(3):449–55.805. Tsang C, Higgins S, Duthie GG, Duthie SJ, Howie M, Mullen W et al. The influence of moderate redwine consumption on antioxidant status and indices of oxidative stress associated with CHD in healthyvolunteers. Br J Nutr 2005;93(2):233–40.806. Avellone G, Di Garbo V, Campisi D, De Simone R, Raneli G, Scaglione R et al. Effects of moderate Sicilianred wine consumption on inflammatory biomarkers of atherosclerosis. Eur J Clin Nutr 2006;60(1):41–7.807. Addolorato G, Leggio L, Ojetti V, Capristo E, Gasbarrini G, Gasbarrini A. Effects of short-term moderatealcohol administration on oxidative stress and nutritional status in healthy males. Appetite 2008;50(1):50–56.808. Beulens JWJ, van den Berg R, Kok FJ, Helander A, Vermunt SHF, Hendriks HFJ. Moderate alcoholconsumption and lipoprotein-associated phospholipase A2 activity. Nutr Metab Cardiovasc Dis2008;18(8):539–44.809. Tousoulis D, Ntarladimas I, Antoniades C, Vasiliadou C, Tentolouris C, Papageorgiou N et al. Acuteeffects of different alcoholic beverages on vascular endothelium, inflammatory markers and thrombosisfibrinolysis system. Clinical Nutrition 2008;27(4):594–600.810. Costanzo S, Di Castelnuovo A, Donati MB, Iacoviello L, de Gaetano G. Cardiovascular and overallmortality risk in relation to alcohol consumption in patients with cardiovascular disease. Circulation2010;121(17):1951.811. Bagnardi V, Zatonski W, Scotti L, La Vecchia C, Corrao G. Does drinking pattern modify the effect of alcoholon the risk of coronary heart disease? Evidence from a meta-analysis. J Epidemiol Community <strong>Health</strong>2008;62(7):615.812. Ma XJ, Jia WP, Hu C, Zhou J, Lu HJ, Zhang R et al. [Genetic characteristics of familial type 2 diabetespedigrees: a preliminary analysis of 4468 persons from 715 pedigrees]. Zhonghua Yi Xue Za Zhi2008;88(36):2541–3.813. Taylor B, Irving HM, Baliunas D, Roerecke M, Patra J, Mohapatra S et al. Alcohol and hypertension:gender differences in dose–response relationships determined through systematic review and metaanalysis. Addiction 2009;104(12):1981–90.814. Savica V, Bellinghieri G, Kopple JD. The effect of nutrition on blood pressure. Annu Rev Nutr 2010;30:365–401.815. Hackam DG, Khan NA, Hemmelgarn BR, Rabkin SW, Touyz RM, Campbell NR et al. The 2010 CanadianHypertension Education Program recommendations for the management of hypertension: part 2 –therapy. Can J Cardiol 2010;26(5):249–58.816. National Stroke Foundation. Clinical guidelines for acute stroke management. Melbourne: National StrokeFoundation, 2007. http://www.nhmrc.gov.au/_files_nhmrc/file/publications/synopses/cp109.pdfhttp://www.strokefoundation.com.au/news/welcome/clinical-guidelines-for-acute-stroke-management817. Allen NE, Beral V, Casabonne D, Kan SW, Reeves GK, Brown A et al. Moderate alcohol intake and cancerincidence in women. J Natl Cancer Inst 2009;101(5):296–305.818. Terry MB, Zhang FF, Kabat G, Britton JA, Teitelbaum SL, Neugut AI et al. Lifetime alcohol intake and breastcancer risk. Ann Epidemiol 2006;16(3):230–40.819. Petri AL, Tjonneland A, Gamborg M, Johansen D, Hoidrup S, Sorensen TI et al. Alcohol intake, typeof beverage, and risk of breast cancer in pre- and postmenopausal women. Alcoholism Clin Exp Res2004;28(7):1084–90.194EAT FOR HEALTH – australian dietary guidelinesNational <strong>Health</strong> and Medical Research Council
820. Newcomb PA, Nichols HB, Beasley JM, Egan K, Titus-Ernstoff L, Hampton JM et al. No differencebetween red wine or white wine consumption and breast cancer risk. Cancer Epidemiol BiomarkersPrev 2009;18(3):1007–10.821. Li Y, Baer D, Friedman GD, Udaltsova N, Shim V, Klatsky AL et al. Wine, liquor, beer and risk of breastcancer in a large population. Eur J Cancer 2009;45(5):843–50.822. Deandrea S, Talamini R, Foschi R, Montella M, Dal Maso L, Falcini F et al. Alcohol and breast cancer riskdefined by estrogen and progesterone receptor status: a case-control study. Cancer Epidemiol BiomarkersPrev 2008;17(8):2025–8.823. Bessaoud F, Daurès JP. Patterns of alcohol (especially wine) consumption and breast cancer risk: a casecontrolstudy among a population in Southern France. Annals of Epidemiology 2008;18(6):467–75.824. Fuchs CS, Willett WC, Colditz GA, Hunter DJ, Stampfer MJ, Speizer FE et al. The influence of folateand multivitamin use on the familial risk of colon cancer in women. Cancer Epidemiol Biomarkers Prev2002;11(3):227.825. Bongaerts BW, de Goeij AF, van den Brandt PA, Weijenberg MP. Alcohol and the risk of colon and rectalcancer with mutations in the K-ras gene. Alcohol 2006;38(3):147–54.826. Purdue MP, Hashibe M, Berthiller J, La Vecchia C, Dal Maso L, Herrero R et al. Type of alcoholic beverageand risk of head and neck cancer--a pooled analysis within the INHANCE Consortium. Am J Epidemiol2009;169(2):132–42.827. Liang W, Chikritzhs T, Pascal R, Binns CW. Mortality rate of alcoholic liver disease and risk ofhospitalization for alcoholic liver cirrhosis, alcoholic hepatitis and alcoholic liver failure in Australia between1993 and 2005. Int Med J 2011;41(1a):34–41.828. Rehm J, Taylor B, Mohapatra S, Irving H, Baliunas D, Patra J et al. Alcohol as a risk factor for liver cirrhosis:a systematic review and meta analysis. Drug and Alcohol Review 2010;29(4):437–45.829. Stampfer MJ, Kang JH, Chen J, Cherry R, Grodstein F. Effects of moderate alcohol consumption oncognitive function in women. N Engl J Med 2005;352(3):245–53.830. Solfrizzi V, D’Introno A, Colacicco AM, Capurso C, Del Parigi A, Baldassarre G et al. Alcohol consumption,mild cognitive impairment, and progression to dementia. Neurology 2007;68(21):1790–9.831. Ruitenberg A, van Swieten JC, Witteman JC, Mehta KM, van Duijn CM, Hofman A et al. Alcoholconsumption and risk of dementia: the Rotterdam Study. Lancet 2002;359(9303):281–6.832. Luchsinger JA, Tang MX, Siddiqui M, Shea S, Mayeux R. Alcohol intake and risk of dementia. J Am GeriatrSoc 2004;52(4):540–6.833. Letenneur L, Larrieu S, Barberger-Gateau P. Alcohol and tobacco consumption as risk factors of dementia:a review of epidemiological studies. Biomed Pharmacother 2004;58(2):95–99.834. Harper C. The neuropathology of alcohol-specific brain damage, or does alcohol damage the brain? JNeuropathol Exp Neurol 1998;57(2):101.835. Deng J, Zhou DH, Li J, Wang YJ, Gao C, Chen M. A 2-year follow-up study of alcohol consumption and riskof dementia. Clin Neurol Neurosurg 2006;108(4):378–83.836. Brown SA, Tapert SF. Adolescence and the trajectory of alcohol use: basic to clinical studies. Annals NYAcad Sci 2004;1021(1):234–44.837. Cargiulo T. Understanding the health impact of alcohol dependence. Am J <strong>Health</strong> Syst Pharm 2007;64(5Suppl 3):S5–11.838. Chen CY, Storr CL. Alcohol use and health-related quality of life among youth in Taiwan. J Adol <strong>Health</strong>2006;39(5):752. e9–52. e16.839. Deas D, Brown ES. Adolescent substance abuse and psychiatric comorbidities. J Clin Psychiatry2006;67(7):e02.ReferencesNational <strong>Health</strong> and Medical Research Council195
840. Turner RJ, Gil AG. Psychiatric and substance use disorders in South Florida: racial/ethnic and gendercontrasts in a young adult cohort. Arch Gen Psychiatry 2002;59(1):43.841. National <strong>Health</strong> and Medical Research Council. Australian alcohol guidelines: <strong>Health</strong> risks and benefits.Canberra: Commonwealth of Australia, 2001.842. Truswell AS. Australian experience with the Wernicke-Korsakoff syndrome. Addiction 2000;95(6):829–32.843. Rolland S, Truswell AS. Wernicke-Korsakoff syndrome in Sydney hospitals after 6 years of thiaminenrichment of bread. Public <strong>Health</strong> Nutr 1998;1(2):117–22.844. Edenberg HJ. The genetics of alcohol metabolism: role of alcohol dehydrogenase and aldehydedehydrogenase variants. Alcohol Res <strong>Health</strong> 2007;30(1):5–13.845. Whitfield JB, Martin NG. Alcohol consumption and alcohol pharmacokinetics: interactions within thenormal population. Alcoholism: Clin Exp Res 1994;18(2):238–43.846. Li T-K, Beard JD, Orr WE, Kwo PY, Ramchandani VA. Gender and ethnic differences in alcohol metabolism.Alcoholism Clin Exp Res 1998;22(3):771–72.847. Bellis MD, Narasimhan A, Thatcher DL, Keshavan MS, Soloff P, Clark DB. Prefrontal cortex, thalamus, andcerebellar volumes in adolescents and young adults with adolescent onset alcohol use disorders andcomorbid mental disorders. Alcohol Clin Exp Res 2005;29(9):1590–600.848. White AM, Swartzwelder HS. Hippocampal function during adolescence: a unique target of ethanoleffects. Annals NY Acad Sci 2004;1021(1):206–20.849. Brinton EA. Effects of ethanol intake on lipoproteins and atherosclerosis. Curr Opin Lipidol 2010;21(4):346–51.850. American Diabetes Association. Nutrition recommendations and interventions for diabetes: a positionstatement of the American Diabetes Association. Diabetes Care 2007;30(Suppl 1):S48–65.851. CMP Medica. MIMS Annual 2007. St Leonards, NSW: CMP Medica, 2007.852. Lee Y, Back JH, Kim J, Kim SH, Na DL, Cheong HK et al. Systematic review of health behavioral risks andcognitive health in older adults. Int Psychogeriatr 2010;22(2):174–87.853. Arntzen K, Schirmer H, Wilsgaard T, Mathiesen E. Moderate wine consumption is associated withbetter cognitive test results: a 7 year follow up of 5033 subjects in the Tromsø Study. Acta NeurologicaScandinavica 2010;122:23–29.854. Australian Institute of <strong>Health</strong> and Welfare. 2007 National Drug Strategy Household Survey: Detailedfindings. Cat. no. PHE 107. Canberra: Australian Institute of <strong>Health</strong> and Welfare, 2008.855. Australian Bureau of Statistics. Apparent consumption of alcohol, Australia, 2008-09. Cat. no. 4307.0.55.001.Canberra: Australian Bureau of Statistics, 2010.856. National Preventative <strong>Health</strong> Taskforce. Australia: the healthiest country by 2020. A discussion paper.Canberra: Commonwealth of Australia; 2008.857. Giglia R, Binns C. Alcohol and lactation: a systematic review. Nutr Diet 2006;63(2):103–16.858. Giglia RC, Binns CW, Alfonso HS, Scott JA, Oddy WH. The effect of alcohol intake on breastfeedingduration in Australian women. Acta Paediatr 2008;97(5):624–9.859. Aira M, Hartikainen S, Sulkava R. Community prevalence of alcohol use and concomitant use ofmedication—a source of possible risk in the elderly aged 75 and older? Int J Geriatr Psychiatry2005;20(7):680–85.860. Fletcher PC, Hirdes JP. Risk factors for accidental injuries within senior citizens’ homes: analysis of theCanadian survey on ageing and independence. J Gerontol Nurs 2005;31(2):49.861. Mukamal K, Robbins J, Cauley J, Kern L, Siscovick D. Alcohol consumption, bone density, and hip fractureamong older adults: the cardiovascular health study. Osteoporosis int 2007;18(5):593–602.196EAT FOR HEALTH – australian dietary guidelinesNational <strong>Health</strong> and Medical Research Council
862. Australian Institute of <strong>Health</strong> and Welfare. The problem of osteoporotic hip fracture in Australia.Canberra: Australian Institute of <strong>Health</strong> and Welfare, 2010. http://www.aihw.gov.au/publicationdetail/?id=6442468333&tab=2863. Mutch R, Peadon E, Elliott E, C. B. Need to establish a national diagnostic capacity for foetal alcoholspectrum disorders. Journal of Paediatrics and Child <strong>Health</strong> 2009;45(79-81).864. Kirby T. Blunting the legacy of alcohol abuse in Western Australia. The Lancet 2012;379:207-8.865. Cheyne EH, Sherwin RS, Lunt MJ, Cavan DA, Thomas PW, Kerr D. Influence of alcohol on cognitiveperformance during mild hypoglycaemia; implications for Type 1 diabetes. Diabet Med 2004;21(3):230–7.866. Tolman KG, Dalpiaz AS. Treatment of non-alcoholic fatty liver disease. Ther Clin Risk Manag2007;3(6):1153–63.867. Ferreira SE, de Mello MT, Pompeia S, de Souza-<strong>For</strong>migoni ML. Effects of energy drink ingestion on alcoholintoxication. Alcohol Clin Exp Res 2006;30(4):598–605.868. Price SR, Hilchey CA, Darredeau C, Fulton HG, Barrett SP. Energy drink co administration is associatedwith increased reported alcohol ingestion. Drug and Alcohol Review 2010;29(3):331–33.869. Verster JC, Aufricht C, Alford C. Energy drinks mixed with alcohol: misconceptions, myths and facts.International Journal of General Medicine 2012;5:187-98.870. de Haan L, de Haan HA, van der Palen J, Olivier B, Verster JC. Effects of consuming alcohol mixed withenergy drinks versus consuming alcohol only on overall alcohol consumption and negative alcohol-relatedconsequences. International Journal of General Medicine 2012;5 953-60.871. World <strong>Health</strong> Organization. Exclusive breastfeeding statement. 2011. Available from: http://www.who.int/nutrition/topics/exclusive_breastfeeding/en/872. World <strong>Health</strong> Organization. International code of marketing of breast-milk substitutes. Geneva: World<strong>Health</strong> Organization, 1981. http://www.who.int/nutrition/publications/code_english.pdf873. Commonwealth Department of <strong>Health</strong> and Ageing. Australian National Breastfeeding Strategy 2010-2015.In: Commonwealth Department of <strong>Health</strong> and Ageing, editor. Canberra: Australian <strong>Health</strong> Ministers’Conference; 2009.874. Ip S, Chung M, Raman G, Chew P, Magula N, DeVine D et al. Breastfeeding and maternal and infant healthoutcomes in developed countries. Evid Rep Technol Assess (Full Rep) 2007(153):1–186.875. American Academy of Pediatrics. Pediatric Nutrition Handbook. Fifth ed. Kleinman RE, editor. WashingtonDC: American Academy of Pediatrics, 2004. 1178 p. http://books.google.com.au/books?id=LNtsAAAAMAAJ&q=Pediatric+Nutrition+Handbook.+Fifth.+2004.&dq=Pediatric+Nutrition+Handbook.+Fifth.+2004.&hl=en&ei=XcySTdSsDs_IcYHZwIkH&sa=X&oi=book_result&ct=result&resnum=2&ved=0CDMQ6AEwAQ876. Prentice A. Constituents of human milk. Food Nutr Bull 1996;17:305–12.877. Centre for Epidemiology and Research. 2005-2006 Report on child health from the New South WalesPopulation <strong>Health</strong>y Survey. Sydney: NSW Department of <strong>Health</strong>, 2008. Available from: http://www.health.nsw.gov.au/pubs/2008/pdf/childreport0506.pdf878. Akre J. Infant feeding. The physiological basis. Bull World <strong>Health</strong> Organ 1989(67 Suppl):1–108.879. Kramer M, Kakuma R. Optimal duration of exclusive breastfeeding. Cochrane Database Syst Rev2002(1):CD003517.880. Horta BL, Bahl R, Martines JC, Victora CG. Evidence on the long-term effects of breastfeeding.Geneva: World <strong>Health</strong> Organization, 2007.881. Anderson J, Malley K, Snell R. Is 6 months still the best for exclusive breastfeeding and introduction ofsolids? A literature review with consideration to the risk of the development of allergies. BreastfeedingRev 2009;17(2):23.ReferencesNational <strong>Health</strong> and Medical Research Council197
882. Kramer MS, Matush L, Vanilovich I, Platt RW, Bogdanovich N, Sevkovskaya Z et al. Effects of prolongedand exclusive breastfeeding on child height, weight, adiposity, and blood pressure at age 6.5 y: evidencefrom a large randomized trial. Am J Clin Nutr 2007;86(6):1717.883. Agostoni C, Decsi T, Fewtrell M, Goulet O, Kolacek S, Koletzko B et al. Complementary feeding: acommentary by the ESPGHAN Committee on Nutrition. J Pediatr Gastroenterol Nutr 2008;46(1):99.884. World <strong>Health</strong> Organization. Equity, social determinant and public health programmes. Blas E, Kurup AS,editors. Geneva: World <strong>Health</strong> Organization, 2010.885. Prescott SL, Smith P, Tang M, Palmer DJ, Sinn J, Huntley SJ et al. The importance of early complementaryfeeding in the development of oral tolerance: concerns and controversies. Pediatr Allergy Immunol2008;19(5):375–80.886. Scott JA, Binns CW, Graham KI, Oddy WH. Predictors of the early introduction of solid foods in infants:results of a cohort study. BMC Pediatr 2009;9:60.887. Australian Institute of <strong>Health</strong> and Welfare. Australian National Infant Feeding Survey: Indicator results.In: AIHW, editor. Canberra 2011.888. Britton C, McCormick FM, Renfrew MJ, Wade A, King SE. Support for breastfeeding mothers. CochraneDatabase Syst Rev 2007(1):CD001141.889. Chung M, Raman G, Trikalinos T, Lau J, Ip S. Interventions in primary care to promote breastfeeding: anevidence review for the U.S. Preventive Services Task <strong>For</strong>ce. Ann Intern Med 2008;149(8):565–82.890. Hector D, King L. Interventions to encourage and support breastfeeding. NSW Public <strong>Health</strong> Bull2005;16(3-4):56–61.891. Landers M, Hughes R, Graham K. The Darling Downs Breastfeeding Study. Toowoomba: Darling DownsPublic <strong>Health</strong> Unit, 1998.892. Scott J, Binns C. Breastfeeding: are boys missing out? Birth (Berkeley, Calif) 1999;26(4):276.893. Scott JA, Aitkin I, Binns CW, Aroni RA. Factors associated with the duration of breastfeeding amongstwomen in Perth, Australia. Acta Paediatr 1999;88(4):416–21.894. Scott JA, Landers MCG, Hughes RM, Binns CW. Psychosocial factors associated with the abandonmentof breastfeeding prior to hospital discharge. J Human Lact 2001;17(1):24.895. Simopoulos AP, Oliveira J, Desai ID. Behavioral and metabolic aspects of breastfeeding: internationaltrends. Basel: S Karger AG, 1995.896. Kramer MS, Guo T, Platt RW, Shapiro S, Collet JP, Chalmers B et al. Breastfeeding and infant growth:biology or bias? Pediatrics 2002;110(2 Pt 1):343–7.897. Kramer MS, Chalmers B, Hodnett ED, Sevkovskaya Z, Dzikovich I, Shapiro S et al. Promotion ofBreastfeeding Intervention Trial (PROBIT): a randomized trial in the Republic of Belarus. J Am Med Assoc2001;285(4):413–20.898. Dewey KG. Growth characteristics of breast-fed compared to formula-fed infants. Biol Neonate1998;74(2):94–105.899. Demmelmair H, von Rosen J, Koletzko B. Long-term consequences of early nutrition. Early Hum Dev2006;82(8):567–74.900. Harder T, Bergmann R, Kallischnigg G, Plagemann A. Duration of breastfeeding and risk of overweight:a meta-analysis. Am J Epidemiol 2005;162(5):397–403.901. White House Task <strong>For</strong>ce on Childhood Obesity. Solving the problem of childhood obesity within ageneration: report to the President. Washington, DC.: 2010. Available from: http://www.letsmove.gov/pdf/Task<strong>For</strong>ce_on_Childhood_Obesity_May2010_FullReport.pdf902. Kuti O, Adeyemi AB, Owolabi AT. Breast-feeding pattern and onset of menstruation among Yoruba mothersof South-west Nigeria. Eur J Contracept Reprod <strong>Health</strong>care 2007;12(4):335–39.198EAT FOR HEALTH – australian dietary guidelinesNational <strong>Health</strong> and Medical Research Council
903. Romero-Gutiérrez G, Vaca-Ortiz N, Ponce-Ponce de Leon A, López-Martínez MG. Actual use of thelactational amenorrhoea method. Eur J Contracept Reprod <strong>Health</strong>care 2007;12(4):340–44.904. Türk R, Terzio lu F, Ero lu K. The use of lactational amenorrhea as a method of family planning in easternTurkey and influential factors. J Midwifery Womens <strong>Health</strong> 2010;55(1):e1–e7.905. Ip S, Chung M, Raman G, Trikalinos TA, Lau J. A summary of the Agency for <strong>Health</strong>care Research andQuality’s evidence report on breastfeeding in developed countries. Breastfeed Med 2009;4 Suppl 1:S17–30.906. Oddy WH. The long-term effects of breastfeeding on asthma and atopic disease. Adv Exp Med Biol2009;639:237–51.907. McGuire W, Anthony M. Donor human milk versus formula for preventing necrotising enterocolitis inpreterm infants: systematic review. Arch Dis Childhood Fetal Neonatal Edition 2003;88(1):F11.908. Barclay AR, Russell RK, Wilson ML, Gilmour WH, Satsangi J, Wilson DC. Systematic review: the role ofbreastfeeding in the development of pediatric inflammatory bowel disease. J Pediatr 2009;155(3):421–6.909. Quigley M, Hockley C, Carson C, Kelly Y, Renfrew M, Sacker A. Breastfeeding is associated with improvedchild cognitive development: evidence from the UK Millennium Cohort Study. J Epidemiol Community<strong>Health</strong> 2009;63(Suppl 2):8.910. Medeiros APM, Ferreira JTL, Felício CM. Correlation between feeding methods, non-nutritive sucking andorofacial behaviors. Pró-Fono Revista de Atualização Científica 2009;21(4):315–19.911. Allen J, Hector D. Benefits of breastfeeding. N S W Public <strong>Health</strong> Bull 2005;16(3-4):42–6.912. Sobhy SI, Mohame NA. The effect of early initiation of breast feeding on the amount of vaginal blood lossduring the fourth stage of labor. J Egypt Public <strong>Health</strong> Assoc 2004;79(1-2):1–12.913. Chantry CJ, Auinger P, Byrd RS. Lactation among adolescent mothers and subsequent bone mineraldensity. Arch Pediatr Adolesc Med 2004;158(7):650.914. Dursun N, Ak n S, Dursun E, Sade I, Korkusuz F. Influence of duration of total breast-feeding on bonemineral density in a Turkish population: does the priority of risk factors differ from society to society?Osteoporosis international 2006;17(5):651–55.915. Centre for Epidemiology and Research. 2007-2008 Report on child health from the New South Walespopulation health survey. In: NSW Department of <strong>Health</strong>, editor. Sydney 2010.916. Graham KI SJ, Binns CW, Oddy WH. National targets for breastfeeding at hospital discharge have beenachieved in Perth. Acta Paediatr 2005;94(3):352-56.917. House of Representatives Standing Committee on <strong>Health</strong> and Ageing. The best start – Report onthe inquiry into the health benefits of breastfeeding. Canberra: Commonwealth of Australia, 2007.http://www.aph.gov.au/house/committee/haa/breastfeeding/report/fullreport.pdf918. Kuan LW, Britto M, Decolongon J, Schoettker PJ, Atherton HD, Kotagal UR. <strong>Health</strong> system factorscontributing to breastfeeding success. Pediatrics 1999;104(3):e28.919. Hall Moran V, Edwards J, Dykes F, Downe S. A systematic review of the nature of support for breast-feedingadolescent mothers. Midwifery 2007;23(2):157–71.920. Volpe EM, Bear M. Enhancing breastfeeding initiation in adolescent mothers through the BreastfeedingEducated and Supported Teen (BEST) Club. J Human Lact 2000;16(3):196.921. Baxter J, Cooklin AR, Smith J. Which mothers wean their babies prematurely from full breastfeeding?An Australian cohort study. Acta Paediatr 2009;98(8):1274–77.922. Cooklin AR, Donath SM, Amir LH. Maternal employment and breastfeeding: results from the longitudinalstudy of Australian children. Acta Paediatr 2008;97(5):620–3.923. Amir LH, Donath SM. Socioeconomic status and rates of breastfeeding in Australia: evidence from threerecent national health surveys. Med J Aust 2008;189(5):254–6.ReferencesNational <strong>Health</strong> and Medical Research Council199
924. Labbok MH, Clark D, Goldman AS. Breastfeeding: maintaining an irreplaceable immunological resource.Nat Rev Immunol 2004;4(7):565–72.925. Scott J, Landers M, Hughes RM, Binns C. Factors associated with breastfeeding at discharge and durationof breastfeeding. J Paediatrics Child <strong>Health</strong> 2001;37(3):254–61.926. Duong DV, Binns CW, Lee AH. Breast-feeding initiation and exclusive breast-feeding in rural Vietnam.Public <strong>Health</strong> Nutr 2004;7(6):795–9.927. Kaewsarn P, Moyle W. Breastfeeding duration of Thai women. Aust Coll Midwives Inc J 2000;13(1):21–6.928. Li L, Zhang M, Scott JA, Binns CW. Factors associated with the initiation and duration of breastfeeding byChinese mothers in Perth, Western Australia. J Hum Lact 2004;20(2):188–95.929. Utaka H, Li L, Kagawa M, Okada M, Hiramatsu N, Binns C. Breastfeeding experiences of Japanesewomen living in Perth, Australia. Breastfeed Rev 2005;13(2):5–11.930. Xu F, Qiu L, Binns CW, Liu X. Breastfeeding in China: a review. Int Breastfeed J 2009;4:6.931. Binns CW, Gilchrist D, Woods B, Gracey M, Scott J, Smith H et al. Breastfeeding by Aboriginal mothers inPerth. Nutr Diet 2006;63(1):8–14.932. World <strong>Health</strong> Organization. Acceptable medical reasons for use of breastmilk substitutes. Geneva: World<strong>Health</strong> Organization, 2009. http://whqlibdoc.who.int/hq/2009/WHO_FCH_CAH_09.01_eng.pdf933. Guise JM, Palda V, Westhoff C, Chan BK, Helfand M, Lieu TA. The effectiveness of primary care-basedinterventions to promote breastfeeding: systematic evidence review and meta-analysis for the USPreventive Services Task <strong>For</strong>ce. Ann Fam Med 2003;1(2):70–8.934. Baby Friendly <strong>Health</strong> Initiative. The ten steps to successful breastfeeding. 2011 (cited 29 March 2011).http://www.bfhi.org.au/text/bfhi_ten_steps.html.http://www.patonsyarns.com/pattern.ph935. Abrahams SW, Labbok MH. Exploring the impact of the Baby-Friendly Hospital Initiative on trends inexclusive breastfeeding. Int Breastfeed J 2009;4(11).936. Broadfoot M et al. The Baby Friendly Hospital Initiative and breast feeding rates in Scotland. Arch Dis ChildFetal Neonatal Ed 2005:F114-16.937. Merten S, Dratva J, Ackermann-Liebrich U. Do baby-friendly hospitals influence breastfeeding duration ona national level? Pediatrics 2005;116(5):e702-08.938. Binns C, Scott J. Breastfeeding: reasons for starting, reasons for stopping and problems along the way.Breastfeed Rev 2002;10(2):13–19.939. Australia New Zealand Food Authority. Food safety standards: costs and benefits. An analysisof the regulatory impact of the proposed national food safety reforms Canberra: Australia NewZealand Food Authority, 1999. http://www.foodstandards.gov.au/scienceandeducation/publications/foodsafetystandardscostsandbenefits/940. Bacterial toxins, National Food Safety database [database on the Internet]. 2001. Available from:www.foodsafety.ufl.edu/consumer/nc/nc816a.htm.941. Food Standards Australia New Zealand. Date marking: user guide to Standard 1.2.5, Date Marking ofPackaged Food. In: FSANZ, editor. Canberra 2010.200EAT FOR HEALTH – australian dietary guidelinesNational <strong>Health</strong> and Medical Research Council
942. Käferstein F, Abdussalam M. Food safety in the 21st century. Bull World <strong>Health</strong> Organ 1999;77(4):347.943. Desmarchelier PM. Foodborne disease: emerging problems and solutions. Med J Aust 1996;165(11-12):668–71.944. Nyachuba DG. Foodborne illness: is it on the rise? Nutr Rev 2010;68(5):257–69.945. The OzFoodNet Working Group. Monitoring the incidence and causes of diseases potentially transmittedby food in Australia: Annual report of the OzFoodNet Network 2009. Communicable Diseases Intelligence2010;32(4).946. Abelson P, <strong>For</strong>bes MP, Hall G, Economics A, <strong>Health</strong> ADo, Ageing. The annual cost of foodborne illness inAustralia. Canberra: Department of <strong>Health</strong> and Ageing, 2006.947. Crerar SK, Dalton CB, Longbottom HM, Kraa E. Foodborne disease: current trends and future surveillanceneeds in Australia. Med J Aust 1996;165:672–5.948. Redmond EC, Griffith CJ. Consumer food handling in the home: a review of food safety studies. J FoodProt 2003;66(1):130–61.949. Australia New Zealand Communicable Diseases Network. <strong>For</strong>tnightly notifiable diseases tables:Communicable Diseases Intelligence, 1999.950. Redmond EC, Griffith CJ. The importance of hygiene in the domestic kitchen: implications for preparationand storage of food and infant formula. Perspectives in Public <strong>Health</strong> 2009;129(2):69–76.951. State Government of Victoria. Food safety at home. In: Department of <strong>Health</strong> Victoria, editor. Melbourne,Victoria.2011.952. Merry G. Food poisoning prevention. Sydney: Palgrave Macmillan Australia, 1997.953. Sprenger RA. Hygiene for management: a text for food hygiene courses. South Yorkshire UK Highfield, 1998.954. US Department of Agriculture. Kitchen companion: your safe food guide. Washington, DC.: USDepartment of Agriculture; 2008.955. Brewer MS. Food storage, food spoilage and foodborne illness. 1991 (cited). www.aces.uiuc.edu/~fshn/extension/food_storage.html, .http://www.patonsyarns.com/pattern.ph956. Almanza BA, Namkung Y, Ismail JA, Nelson DC. Clients’ safe food-handling knowledge and risk behavior ina home-delivered meal program. J Am Diet Assoc 2007;107(5):816–21.957. Kendall PA, Hillers VV, Medeiros LC. Food safety guidance for older adults. Clin Infect Dis2006;42(9):1298–304.958. US Food Safety and Inspection Service. Safe food to go. In: Department of Agriculture, editor. Washington,DC 1997.959. Cates SC, Carter-Young HL, Conley S, O’Brien B. Pregnant women and listeriosis: preferred educationalmessages and delivery mechanisms. J Nutr Educ Behav 2004;36(3):121–7.960. Food And Agriculture Organization of the United Nations and the World <strong>Health</strong> Organization. InternationalConference on Nutrition: World Declaration and Plan of Action for Nutrition. Geneva: Food And AgricultureOrganization of the United Nations and the World <strong>Health</strong> Organization, 1992.961. Lester IH. Australia’s food and nutrition. Canberra: Australian Government Publishing Service, 1994.962. Australia PHAo. <strong>Health</strong> inequities policy. Canberra: Public <strong>Health</strong> Association of Australia, 2009.963. Atlantis E, Barnes EH, Ball K. Weight status and perception barriers to healthy physical activity and dietbehavior. Int J Obes (Lond) 2008;32(2):343–52.964. Baker EA, Schootman M, Barnidge E, Kelly C. The role of race and poverty in access to foods that enableindividuals to adhere to dietary guidelines. Prev Chronic Dis 2006;3(3):A76.ReferencesNational <strong>Health</strong> and Medical Research Council201
965. Bodnar LM, Siega-Riz AM. A diet quality index for pregnancy detects variation in diet and differences bysociodemographic factors. Public <strong>Health</strong> Nutr 2002;5(6):801–9.966. Cassady D, Jetter KM, Culp J. Is price a barrier to eating more fruits and vegetables for low-incomefamilies? J Am Diet Assoc 2007;107(11):1909–15.967. Giskes K, Turrell G, van Lenthe FJ, Brug J, Mackenbach JP. A multilevel study of socio-economicinequalities in food choice behaviour and dietary intake among the Dutch population: the GLOBE study.Public <strong>Health</strong> Nutr 2006;9(1):75–83.968. Giskes K, Van Lenthe FJ, Brug J, Mackenbach JP, Turrell G. Socioeconomic inequalities in food purchasing:the contribution of respondent-perceived and actual (objectively measured) price and availability of foods.Prev Med 2007;45(1):41–8.969. Kolodinsky J, Harvey-Berino JR, Berlin L, Johnson RK, Reynolds TW. Knowledge of current dietaryguidelines and food choice by college students: better eaters have higher knowledge of dietary guidance.J Am Dietetic Assoc 2007;107(8):1409–13.970. Inglis V, Ball K, Crawford D. Why do women of low socioeconomic status have poorer dietary behavioursthan women of higher socioeconomic status? A qualitative exploration. Appetite 2005;45(3):334–43.971. McNaughton SA, Ball K, Crawford D, Mishra GD. An index of diet and eating patterns is a valid measureof diet quality in an Australian population. J Nutr 2008;138(1):86–93.972. Nelson M, Dick K, Holmes B. Food budget standards and dietary adequacy in low-income families.Proc Nutr Soc 2002;61(4):569–77.973. Sanchez A, Norman GJ, Sallis JF, Calfas KJ, Cella J, Patrick K. Patterns and correlates of physical activityand nutrition behaviors in adolescents. Am J Prev Med 2007;32(2):124–30.974. Story M, Neumark-Sztainer D, French S. Individual and environmental influences on adolescent eatingbehaviors. J Am Diet Assoc 2002;102(3 Suppl):S40–51.975. Turrell G, Kavanagh AM. Socio-economic pathways to diet: modelling the association between socioeconomicposition and food purchasing behaviour. Public <strong>Health</strong> Nutr 2006;9(3):375–83.976. Turrell G, Hewitt B, Patterson C, Oldenburg B. Measuring socio-economic position in dietary research:is choice of socio-economic indicator important? Public <strong>Health</strong> Nutr 2003;6(2):191–200.977. Collins CE, Young AF, Hodge A. Diet quality is associated with higher nutrient intake and self-rated healthin mid-aged women. J Am Coll Nutr 2008;27(1):146–57.978. Dynesen AW, Haraldsdottir J, Holm L, Astrup A. Sociodemographic differences in dietary habits describedby food frequency questions--results from Denmark. Eur J Clin Nutr 2003;57(12):1586–97.979. Hearty AP, McCarthy SN, Kearney JM, Gibney MJ. Relationship between attitudes towards healthyeating and dietary behaviour, lifestyle and demographic factors in a representative sample of Irish adults.Appetite 2007;48(1):1–11.980. Oldroyd J, Burns C, Lucas P, Haikerwal A, Waters E. The effectiveness of nutrition interventions ondietary outcomes by relative social disadvantage: a systematic review. J Epidemiol Community <strong>Health</strong>2008;62(7):573–9.981. Power EM. Determinants of healthy eating among low-income Canadians. Can J Public <strong>Health</strong> 2005;96Suppl 3:S37–42, S42–8.982. Wong KC, Coveney J, Ward P, Muller R, Carter P, Verity F et al. Availability, affordability and quality of ahealthy food basket in Adelaide, South Australia. Nutr Diet 2011;68(1):8–14.983. Statistics ABo. National Aboriginal and Torres Strait Islander Survey 1994. In: ABS, editor. Canberra:Commonwealth of Australia; 1994.984. Andrieu E, Darmon N, Drewnowski A. Low-cost diets: more energy, fewer nutrients. Eur J Clin Nutr2006;60(3):434–6.202EAT FOR HEALTH – australian dietary guidelinesNational <strong>Health</strong> and Medical Research Council
985. Centre for Epidemiology and Research. 2007 report on adult health from the New South Wales Population<strong>Health</strong> Survey. Sydney: NSW Department of <strong>Health</strong>, 2008b.986. Department of Human Services. Victorian Population <strong>Health</strong> Survey 2007. Melbourne: Department ofHuman Services, 2008.987. Burns C. A review of the literature describing the link between poverty, food insecurity and obesity withspecific reference to Australia. Melbourne: Victorian <strong>Health</strong> Promotion Foundation, 2004.988. Australian Institute of <strong>Health</strong> and Welfare. Aboriginal and Torres Strait Islander <strong>Health</strong> PerformanceFramework, 2006 report: detailed analyses. . In: AIHW, editor. Canberra: AIHW; 2007.989. Australian Bureau of Statistics. Consumer price index, Australia, March 2011 - Cat. no. 6401.0. 2011 (cited2011). http://www.abs.gov.au/AUSSTATS/abs@.nsf/DetailsPage/6401.0Mar%202011?OpenDocument.http://www.patonsyarns.com/pattern.ph990. Baghurst KI. Social status, nutrition and the cost of healthy eating. In: Baghurst KI, Binns C, eds. <strong>Dietary</strong>guidelines for Australian adults. Canberra: National <strong>Health</strong> and Medical Research Council, 2003.991. Sanchez-Villegas A, Martinez JA, Prattala R, Toledo E, Roos G, Martinez-Gonzalez MA. A systematic reviewof socioeconomic differences in food habits in Europe: consumption of cheese and milk. Eur J Clin Nutr2003;57(8):917–29.992. Vos T. The burden of disease and injury in Aboriginal and Torres Strait Islander peoples 2003. Brisbane:University of Queensland Centre for Burden of Disease and Cost-Effectiveness, 2007.993. Carson B, Dunbar T, Chenhall RD. Social determinants of Indigenous health. Sydney: Allen & UnwinAcademic, 2007.994. Torzillo PJ, Pholeros P, Rainow S, Barker G, Sowerbutts T, Short T et al. The state of health hardware inAboriginal communities in rural and remote Australia. Aust N Z J Public <strong>Health</strong> 2008;32(1):7–11.995. Australian Bureau of Statistics, Australian Institute of <strong>Health</strong> and Welfare. The health and welfare ofAustralia’s Aboriginal and Torres Strait Islander peoples Canberra: Australian Institute of <strong>Health</strong> andWelfare, 2008. Available from: http://www.aihw.gov.au/publication-detail/?id=6442468085996. Ruben AR, Walker AC. Malnutrition among rural aboriginal children in the Top End of the Northern Territory.Med J Aust 1995;162(8):400.997. Sayers SM, Mackerras D, Singh G, Bucens I, Flynn K, Reid A. An Australian Aboriginal birth cohort:a unique resource for a life course study of an Indigenous population. A study protocol. BMC Int <strong>Health</strong>Hum Rights 2003;3(1):1.998. Northern Territory Government. Department of <strong>Health</strong> and Community Services: Annual Report 2006-2007.Casuarina: Department of <strong>Health</strong> and Community Services, 2007. Available from: http://www.health.nt.gov.au/library/scripts/objectifyMedia.aspx?file=pdf/10/05.pdf&siteID=1&str_title=DHCS+Annual+Report+2006-2007.pdf999. Northern Territory Government. Northern Territory Market Basket Survey 2008. Darwin: Northern TerritoryDepartment of <strong>Health</strong> and Families; 2008.1000. Mackerras DE, Reid A, Sayers SM, Singh GR, Bucens IK, Flynn KA. Growth and morbidity in children inthe Aboriginal birth cohort study: the urban-remote differential. Med J Aust 2003;178(2):56–60.1001. Vanlint SJ, Morris HA, Newbury JW, Crockett AJ. Vitamin D insufficiency in Aboriginal Australians.Women 2011;100:120.1002. Coyne T, Darnton-Hill I. Australian Aborigines’ nutrition and changing disease patterns. New Doctor1979;12:32–7.1003. Naughton JM, O’Dea K, Sinclair AJ. Animal foods in traditional Australian aboriginal diets: polyunsaturatedand low in fat. Lipids 1986;21(11):684–90.1004. O’Dea K. Traditional diet and food preferences of Australian Aboriginal hunter-gatherers. Philos Trans R SocLond B Biol Sci 1991;334(1270):233–40; discussion 40–1.ReferencesNational <strong>Health</strong> and Medical Research Council203
1005. Shannon C. Acculturation: Aboriginal and Torres Strait Islander nutrition. Asia Pac J Clin Nutr 2002;11 Suppl 3:S576–8.1006. Lee A. Transition of Australian Aboriginal diet and nutritional health. World Rev Nutr Diet 1996;79:1–52.1007. Booth S, Smith A. Food security and poverty in Australia-challenges for dietitians. Aust J NutritionDietetics 2001;58(3):150–56.1008. House of Representatives Standing Committee on Aboriginal and Torres Strait Islander affairs. Everybody’sbusiness: remote Aboriginal and Torres Strait community stores. Canberra: Commonwealth of Australia,2009. http://www.aph.gov.au/house/committee/ATSIA/communitystores/http://www.aph.gov.au/house/committee/ATSIA/communitystores/report.htm1009. Leonard D, Beilin R, Moran M. Which way kaikai blo umi? Food and nutrition in the Torres Strait. Aust JPublic <strong>Health</strong> 1995;19(6):589–95.1010. Meedeniya J, Smith A, Carter P. Food supply in rural South Australia: a survey on food cost, quality andvariety. 2000.1011. Beaumont S. Tasmanian food price, availability, and quality survey. Hobart: Tasmanian Department ofCommunity and <strong>Health</strong> Services, 1998.1012. Bowcock R. Kimberley Market Basket Survey. Derby: Kimberley Public <strong>Health</strong>, 1999.1013. Price R, McComb J, Grieve H, Graham E. Surveys of food availability, quality and price in rural andremote communities of the Alice Springs and Barkly district: April and May 1998. Darwin: Territory<strong>Health</strong> Service, 1998.1014. Sullivan H, Gracey M, Hevron V. Food costs and nutrition of Aborigines in remote areas of northernAustralia. Med J Aust 1987;147(7):334–7.1015. Cutter T. Nutrition and food habits of the central Australian Aboriginal. The nutrition of Aborigines inrelation to the ecosystem of central Australia. Melbourne: CSIRO, 1978: 63–70.1016. House of Representatives. Inquiry into community stores in remote Aboriginal and Torres Strait Islandercommunities 2009. Canberra: Commonwealth of Australia; 2009.1017. Altman J. Hunter-gatherers today: An Aboriginal economy in north Australia. Canberra: AustralianInstitute of Aboriginal Studies, 1987.1018. Devitt J. Traditional Aboriginal preferences in a changed context. Central Australian Rural Practitioners’Association Newsletter 1991;14:38–41.1019. Rae C, Lamprell V, Lion R, Rae A. The role of bushfoods in contemporary Aboriginal diets. Proc Nut SocAus 1982;7:45–9.1020. Browne J, Laurence S, Thorpe S. Acting on food insecurity in urban Aboriginal and Torres Strait Islandercommunities: Policy and practice interventions to improve local access and supply of nutritious food.Melbourne: Victorian Aboriginal Community Controlled <strong>Health</strong> Organisation, 2009. Available from:http://www.healthinfonet.ecu.edu.au/health-risks/nutrition/reviews/other-reviews1021. Guest CS, O’Dea K. Diabetes in aborigines and other Australian populations. Aust J Public <strong>Health</strong>1992;16(4):340–9.1022. Doyle J, Reilly R, Cincotta M, Firebrace B, Rowley K. Developing nutrition and physical activity guidelinesand interventions for Aboriginal and Torres Strait Islander communities. Shepparton: Onemda Vic<strong>Health</strong>Koori <strong>Health</strong> Unit, 2007.1023. Clough AR, Rowley K, O’Dea K. Kava use, dyslipidaemia and biomarkers of dietary quality in Aboriginalpeople in Arnhem Land in the Northern Territory (NT), Australia. Eur J Clin Nutr 2004;58(7):1090–93.1024. Chan LCK, Ware RS, Kesting J, Marczak M, Good D, Shaw JTE. Association between anthropometricmeasures of obesity and cardiovascular risk markers in a self-selected group of indigenous Australians.Journal of Cardiovascular Risk 2007;14(4):515.204EAT FOR HEALTH – australian dietary guidelinesNational <strong>Health</strong> and Medical Research Council
1025. Lee A, Bonson A, Yarmirr D, O’Dea K, JD M. Sustainability of a successful health and nutrition program ina remote Aboriginal community. MJA 1995;162(12):632–35.1026. Rowley KG, Daniel M, Skinner K, Skinner M, White GA, O’Dea K. Effectiveness of a community directed‘healthy lifestyle’program in a remote Australian Aboriginal community. Aust N Z J Public <strong>Health</strong>2000;24(2):136–44.1027. Johannes RE, MacFarlane JW. Traditional fishing in the Torres Strait islands. Cleveland, Queensland:CSIRO Division of Fisheries, Marine Laboratories, 1991.1028. Haynes D M-WK, Kwan D. Trace metal concentrations in Torres Strait green turtle (Chelonia mydas)tissues, 1997–1998. . Report prepared for the Torres Strait Regional Authority, 2001.1029. Australian Bureau of Statistics. Australian social trends 2010 (cited). www.abs.gov.au/AUSSTATS/abs@.nsf/Lookup/4102.0Main+Features30Mar+2010.http://www.patonsyarns.com/pattern.ph1030. Australian Bureau of Statistics. Census provides an updated picture of the average Australian [Media factsheet]. 2007 (cited). www.abs.gov.au/ausstats/abs@.nsf/7d12b0f6763c78caca257061001cc588/96e08af8f4178a45ca257306000d4fd4!OpenDocument.http://www.patonsyarns.com/pattern.ph1031. Cancer Council NSW. NSW healthy food basket cost, availability and quality survey. Sydney: CancerCouncil NSW, 2007. http://www.cancercouncil.com.au/editorial.asp?pageid=23891032. National <strong>Health</strong> and Medical Research Council. The core food groups: the scientific basis for developingnutrition education tools. Canberra: Commonwealth of Australia, 1995. http://www.nhmrc.gov.au/publications/synopses/n16covr.htm1033. National <strong>Health</strong> and Medical Research Council. Implementing the dietary guidelines for Australians.Report on the subcommittee on nutrition education. Canberra1989.1034. Cashel K LJ. NUTTAB89-Nutrient Data Table for Use in Australia [Floppy Disc]. In: Department ofCommunity Services and <strong>Health</strong>, editor. Canberra 1989.1035. National <strong>Health</strong> and Medical Research Council. Recommended dietary intakes for use in Australia. Canberra:Commonwealth of Australia, 1991. http://www.nhmrc.gov.au/publications/synopses/n6syn.htm1036. Sobolewski R CJ, Mackerras D. Which Australian food composition database should I use? Nutr Dietetics2010;67:37-40.1037. Food Standards Australia and New Zealand. AUSNUT 2007. 2007 (updated September 2011; citedSeptember 2011). http://www.foodstandards.gov.au/consumerinformation/ausnut2007/.http://www.patonsyarns.com/pattern.ph1038. National Public <strong>Health</strong> Partnership. National Aboriginal and Torres Strait Islander nutrition strategy andaction plan 2000-2010. 2001.1039. Food Standards Australia and New Zealand. NUTTAB 2010. 2010 (updated September 2011; citedSeptember 2011). http://www.foodstandards.gov.au/consumerinformation/nuttab2010/.http://www.patonsyarns.com/pattern.ph1040. Larsen K, Ryan C, Abraham AB. Sustainable and secure food systems for Victoria: What do we know?What do we need to know? Melbourne: University of Melbourne, 2008.1041. Lang T. Reshaping the food system for ecological public health. Journal of Hunger & EnvironmentalNutrition 2009;4(3-4):315-35.1042. Riley H & Buttress JL. A UK public health perspective: What is a healthy sustainable diet? British NutritionFoundation Nutrition Bulletin 2011; 36:426-31.1043. Vieux F, Darmon N, Touazi D, Soler LG. Greenhouse gas emissions of self-selected individual diets inFrance: Changing the diet structure or consuming less? Ecological Economics 2012;75:91-101.1044. Edwards P, Roberts I. Population adiposity and climate change. International Journal of Epidemiology2009; 38 (4):1137-40.ReferencesNational <strong>Health</strong> and Medical Research Council205
1045. Golley RK, Hendrie GA, McNaughton SA. Scores on the dietary guideline index for children and adolescentsare associated with nutrient intake and socio-economic position but not adiposity. The Journal of Nutrition2011;141:1340-47.1046. World <strong>Health</strong> Organisation/Food and Agriculture Organisation. Diet, nutrition and the prevention ofchronic diseases: Report of the joint WHO/FAO Expert Consultation. Geneva: 2003. Available from:http://whqlibdoc.who.int/trs/who_trs_916.pdf1047. Parfitt J, Barthel M, Macnaughton S. Food waste within food supply chains: quantification and potential forchange to 2050. Phil Trans R Soc B 2010;365:3065-81.1048. Wallgren C, Höjer M. <strong>Eat</strong>ing energy-Identifying possibilities for reduced energy use in the future foodsupply system. Energy Policy 2009;37(12):5803-13.1049. Carlsson-Kanyama A, Boström-Carlsson K. Energy use for cooking and other stages in the life cycle offood. Stockholm, Sweden: Stockhoms Universitet, 2001.1050. Baker D, Fear J, Denniss R. What a waste-an analysis of household expenditure on food: Policy BriefNo. 6,. The Australian Institute.; 2009.1051. <strong>For</strong>esight. The future of food and farming. London: The Government Office for Science; 2011.1052. Foster C, Green K, Bleda M, Dewick P, Evans B, Flynn A et al. Environmental impacts of food production andconsumption: A report to the department of environment, food and rural affairs. London: DEFRA, 2006.1053. Food Ethics Council. Sustainable behaviour - if we really cared, wouldn’t we pay more? Business <strong>For</strong>umMeeting; 13th September 2007.1054. Bunn D, Feenstra GW, Lynch L, Sommer R. Consumer Acceptance of Cosmetically Imperfect Produce.Journal of Consumer Affairs 1990;2:268-79.1055. Australia State of the Environment Report. Independent report to the Australian Government Ministerfor Sustainability, Environment, Water, Population and Communities. In: Department of Sustainability,Environment, Water, Population, and Communities, editors. Canberra 2011.1056. Burlingame B, Dernini S. Sustainable diets and biodiversity: Directions and solutions for policy, researchand action: United Nations Food and Agriculture Organization.; 2012.1057. PMSEIC. Australia and food security in a changing world. In: The Prime Minister’s Science Engineeringand Innovation Council, editor. Canberra 2010.1058. Huang MH, Rust RT. Sustainability and consumption. J of the Acad Mark Science 2011;39:40-54.1059. Department of Agriculture, Fisheries, and <strong>For</strong>estry. National Food Plan. 2012 (cited). www.daff.gov.au/nationalfoodplan/national-food-plan.http://www.patonsyarns.com/pattern.ph1060. IOM (Institute of Medicine) and NRC (National Research Council). Exploring health and environmentalcosts of food: Workshop summary. Washington DC,: The National Academies Press, 2012.1061. 1Ridoutt BG, Sanguansri P, Freer M, Harper GS. Water footprint of livestock; comparison of sixgeographically defined beef production systems. International Journal of Lifecycle Assessment2012;17:165-75.1062. Lenzen M et al. Environmental impact assessment including indirect effects - a case study using inputoutputanalysis. Environmental Impact Assessment Review 2003;23(3):263-82.1063. Closs DJ, Speier C, Meacham N. Sustainability to support end-to-end value chains: the role of supply chainmanagement. Journal of the Academy of Marketing Science 2011;39:101-16.1064. Hult GTM. Market-focused sustainability: market orientation plus! Journal of the Academy of MarketingScience 2011;39:1-6.1065. Jackson T. Prosperity without growth? A transition to a sustainable economy. London, UK: SustainableDevelopment Commission; 2009.206EAT FOR HEALTH – australian dietary guidelinesNational <strong>Health</strong> and Medical Research Council
1066. Natural Resource Management Ministerial Council 2010. Australia’s Biodiversity Conservation Strategy2010-2030. In: Department of Sustainability, Environment, Water, Population, and Communities, editors.Canberra 2010.1067. Department of Sustainability, Environment, Water, Popualtion and Communities. Fact Sheet: Measuringsustainability program. In: SEWPaC, editor. Canberra 2012.1068. CSIRO. Sustainability. 2012 (cited). www.csiro.au/Outcomes/Environment/Population-Sustainability.aspx.http://www.patonsyarns.com/pattern.ph1069. Sheth JN, Sethia NK, Srinivas S. Mindful consumption: a consumer-centric approach to sustainability.Journal of the Acad Mark Sci 2011;39:21-39.1070. Friel S, Dangour AD, Garnett T, Lock K, Chalabi Z, Roberts I et al. Public health benefits of strategies toreduce greenhouse gas emissions: food and agriculture. Lancet 2009;374(2016-25).1071. McMichael AJ, Powles JW, Butler CD, Uauy R. Food, livestock production, energy, climate change andhealth. Lancet 2007;370:1253-63.1072. Powles J. Commentary: Why diets need to change to avert harm from global warming. Internationaljournal of epidemiology 2009;38(4):1141-42.1073. Macdiarmid J, Kyle J, Horgan GW, Loe J, Fyfe C, Johnstone A et al. Sustainable diets for the future:can we contribute to reducing greenhouse gas emissions by eating a healthy diet? Am J Clin Nutr2012;96:632-39.1074. Denney-Wilson E, Booth M, Baur L. Development of the Australian standard definition of child/adolescentoverweight and obesity. Nutr Diet 2003;60(2):74–77.1075. World <strong>Health</strong> Organization. Growth reference data for 5-19 years. 2007 (cited 30 March 2011).http://www.who.int/growthref/en/.http://www.patonsyarns.com/pattern.ph1076. WHO Statistical Information System. Children aged
1087. Lee JM, Pilli S, Gebremariam A, Keirns CC, Davis MM, Vijan S et al. Getting heavier, younger: Trajectoriesof obesity over the life course. Int J Obes (Lond) 2010;34(4):614–23.1088. Nambiar S, Truby H, Abbott RA, Davies PSW. Validating the waist height ratio and developing centiles foruse amongst children and adolescents. Acta Paediatr 2009;98(1):148–52.1089. Sanigorski A, Bell A, Kremer P, Cuttler R, Swinburn B. Reducing unhealthy weight gain in children throughcommunity capacity-building: results of a quasi-experimental intervention program, Be Active <strong>Eat</strong> Well.Int J Obesity 2008;32(7):1060–67.1090. Rasmussen-Torvik LJ, Pankow JS, Jacobs DR, Jr., Steinberger J, Moran AM, Sinaiko AR. Influence ofwaist on adiponectin and insulin sensitivity in adolescence. Obesity (Silver Spring) 2009;17(1):156–61.1091. Valery PC, Moloney A, Cotterill A, Harris M, Sinha AK, Green AC. Prevalence of obesity and metabolicsyndrome in Indigenous Australian youths. Obes Rev 2009;10(3):255–61.1092. McCarthy HD. Body fat measurements in children as predictors for the metabolic syndrome: focus onwaist circumference. Proc Nutr Soc 2006;65(04):385–92.1093. Watts K, Bell LM, Byrne SM, Jones TW, Davis EA. Waist circumference predicts cardiovascular risk inyoung Australian children. J Paediatr Child <strong>Health</strong> 2008;44(12):709–15.1094. Garnett SP, Baur LA, CT C. Waist-to-height ratio: a simple option for determining excess central adiposityin young people. Int J Obes (Lond) 2008;32(6):1028-30.1095. McCarthy HD, M A. A study of central fatness using waist-to-height ratios in UK children and adolescentsover two decades supports the simple message-- ‘keep your waist circumference to less than half yourheight’. Int J Obes (Lond) 2006;30(6):988-92.1096. Taylor RW, Williams SM, Grant AM, Taylor BJ, A G. Predictive ability of waist-to-height in relationto adiposity in children is not improved with age and sex-specific values. Obesity (Silver Spring)2011;19(5):1062-8.1097. Ashwell M, Gunn P, S G. Waist-to-height ratio is a better screening tool than waist circumference andBMI for adult cardiometabolic risk factors: systematic review and meta-analysis. Obesity Reviews2012;13(3):275-86.1098. Eisenmann JC, Welk GJ, Ihmels M, Dollman J. Fatness, fitness, and cardiovascular disease risk factorsin children and adolescents. Med Sci Sports Exerc 2007;39(8):1251.1099. Telford RD, Cunningham RB, Daly RM, Reynolds GJ, Lafferty AR, Gravenmaker KJ et al. Discordanceof international adiposity classifications in Australian boys and girls - the LOOK study. Ann Hum Biol2008;35(3):334–41.1100. Dhaliwal SS, Welborn TA. Central obesity and multivariable cardiovascular risk as assessed by theFramingham prediction scores. Am J Cardiol 2009;103(10):1403–7.1101. Welborn TA, Dhaliwal SS. Preferred clinical measures of central obesity for predicting mortality. Eur J ClinNutr 2007;61(12):1373–9.1102. Department of <strong>Health</strong> and Ageing. Physical activity guidelines. 2010 (cited 29 March 2011).http://www.health.gov.au/internet/main/publishing.nsf/content/health-pubhlth-strateg-phys-act-guidelines.http://www.patonsyarns.com/pattern.ph1103. Australian Government Department of <strong>Health</strong> and Ageing. National Physical Activity <strong>Guidelines</strong> for Adults.2005 (cited). http://www.health.gov.au/internet/main/publishing.nsf/content/phd-physical-activity-adultspdf-cnt.htmhttp://www.patonsyarns.com/pattern.ph1104. Miller YD, Dunstan DW. The effectiveness of physical activity interventions for the treatment of overweightand obesity and type 2 diabetes. J Sci Med Sport 2004;7(1 Suppl):52–9.1105. Genkinger JM, Platz EA, Hoffman SC, Comstock GW, Helzlsouer KJ. Fruit, vegetable, and antioxidantintake and all-cause, cancer, and cardiovascular disease mortality in a community-dwelling population inWashington County, Maryland. Am J Epidemiol 2004;160(12):1223.208EAT FOR HEALTH – australian dietary guidelinesNational <strong>Health</strong> and Medical Research Council
1106. Liu Y, Sobue T, Otani T, Tsugane S. Vegetables, fruit consumption and risk of lung cancer amongmiddle-aged Japanese men and women: JPHC study. Cancer Causes Control 2004;15(4):349–57.1107. Smith-Warner SA, Spiegelman D, Yaun SS, Albanes D, Beeson WL, van den Brandt PA et al. Fruits,vegetables and lung cancer: a pooled analysis of cohort studies. Int J Cancer 2003;107(6):1001–11.1108. Wright ME, Park Y, Subar AF, Freedman ND, Albanes D, Hollenbeck A et al. Intakes of fruit, vegetables,and specific botanical groups in relation to lung cancer risk in the NIH-AARP Diet and <strong>Health</strong> Study.Am J Epidemiol 2008;168(9):1024–34.1109. Boyle P, Levin B. World Cancer Report 2008. World Cancer Report 2008.1110. van Duijnhoven FJB, Bueno-De-Mesquita HB, Ferrari P, Jenab M, Boshuizen HC, Ros MM et al. Fruit,vegetables, and colorectal cancer risk: the European Prospective Investigation into Cancer and Nutrition.Am J Clin Nutr 2009;89(5):1441.1111. Lee JE, Mannisto S, Spiegelman D, Hunter DJ, Bernstein L, van den Brandt PA et al. Intakes of fruit,vegetables, and carotenoids and renal cell cancer risk: a pooled analysis of 13 prospective studies.Cancer Epidemiol Biomarkers Prev 2009;18(6):1730–9.1112. Dolwick Grieb SM, Theis RP, Burr D, Benardot D, Siddiqui T, Asal NR. Food groups and renal cell carcinoma:results from a case-control study. J Am Diet Assoc 2009;109(4):656–67.1113. Weikert S, Boeing H, Pischon T, Olsen A, Tjonneland A, Overvad K et al. Fruits and vegetables and renalcell carcinoma: findings from the European prospective investigation into cancer and nutrition (EPIC).Int J Cancer 2006;118(12):3133–39.1114. Rashidkhani B, Lindblad P, Wolk A, Rashidkhani B, Lindblad P, Wolk A. Fruits, vegetables and risk of renalcell carcinoma: a prospective study of Swedish women. Int J Cancer 2005;113(3):451–5.1115. World Cancer Research Fund, American Institute for Cancer Research. Food, nutrition, and the preventionof cancer: a global perspective. Washington DC: American Institute for Cancer Research, 1997.1116. Stewart BW, Kleihues P. World Cancer Research Report. Lyon: International Agency for Research onCancer, 2003. http://www.iarc.fr/en/publications/pdfs-online/wcr/2003/index.php1117. Boffetta P, Couto E, Wichmann J, Ferrari P, Trichopoulos D, Bueno-de-Mesquita HB et al. Fruit and vegetableintake and overall cancer risk in the European Prospective Investigation into Cancer and Nutrition (EPIC).J Natl Cancer Inst 2010;102(8):529.1118. Liang W, Binns CW. Fruit, vegetables, and colorectal cancer risk: the European Prospective Investigationinto Cancer and Nutrition. Am J Clin Nutr 2009;90(4):1112.1119. Miura K, Greenland P, Stamler J, Liu K, Daviglus ML, Nakagawa H et al. Relation of vegetable, fruit, andmeat intake to 7-year blood pressure change in middle-aged men: the Chicago Western Electric Study.Am J Epidemiol 2004;159(6):572–80.1120. Freedman ND, Park Y, Subar AF, Hollenbeck AR, Leitzmann MF, Schatzkin A et al. Fruit and vegetableintake and head and neck cancer risk in a large United States prospective cohort study. Int J Cancer2008;122(10):2330–6.1121. Ahn YS, Jy W, Harrington WJ, Shanbaky N, Fernandez LF, Haynes DH. Increased platelet calcium inthrombosis and related disorders and its correction by nifedipine. Thromb Res 1987;45(2):135–43.1122. Alberola A, Clarke CS, Haynes DA, Pascu SI, Rawson JM. Crystal structures and magnetic propertiesof a sterically encumbered dithiadiazolyl radical, 2,4,6-(F3C)3C6H2CNSSN. Chem Commun (Camb)2005(37):4726–8.1123. Atkins GJ, Bouralexis S, Evdokiou A, Hay S, Labrinidis A, Zannettino AC et al. Human osteoblasts areresistant to Apo2L/TRAIL-mediated apoptosis. Bone 2002;31(4):448–56.1124. Sunny L, Sunny L. A low fat diet rich in fruits and vegetables may reduce the risk of developing prostatecancer. Asian Pac J Cancer Prev 2005;6(4):490–6.ReferencesNational <strong>Health</strong> and Medical Research Council209
1125. Ello-Martin JA, Roe LS, Ledikwe JH, Beach AM, Rolls BJ. <strong>Dietary</strong> energy density in the treatment ofobesity: a year-long trial comparing 2 weight-loss diets. Am J Clin Nutr 2007;85(6):1465–77.1126. Whybrow S, Harrison CLS, Mayer C, Stubbs RJ. Effects of added fruits and vegetables on dietary intakesand body weight in Scottish adults. Br J Nutr 2006;95(3):496–503.1127. Vrieling A, Verhage BAJ, van Duijnhoven FJB, Jenab M, Overvad K, Tjønneland A et al. Fruit and vegetableconsumption and pancreatic cancer risk in the European Prospective Investigation into Cancer andNutrition. Int J Cancer 2009;124(8):1926–34.1128. Larsson SC, Bergkvist L, Wolk A. Fruit and vegetable consumption and incidence of gastric cancer:a prospective study. Cancer Epidemiol Biomarkers Prev 2006;15(10):1998–2001.210EAT FOR HEALTH – australian dietary guidelinesNational <strong>Health</strong> and Medical Research Council
Notes
Notes
www.nhmrc.gov.auwww.eatforhealth.gov.auGPO Box 1421, Canberra ACT 260116 Marcus Clarke Street, Canberra City ACTT. 13 000 NHMRC (13 000 64672) or +61 2 6217 9000 F. 61 2 6217 9100 E. nhmrc@nhmrc.gov.au