LOCAL WATER UTILITIES ADMINISTRATIONBALANCE SHEETDecember 31, <strong>2009</strong>(With Comparative Figures for 2008)(in Philippine Pesos)(as restated )Notes <strong>2009</strong> 2008ASSETSCurrent AssetsCash and cash equivalents 2, 3 920,911,227 1,650,526,074Receivables, net 2, 4 3,166,010,825 1,691,527,915Supplies inventory 5 3,015,912 3,092,915Other current assets 2, 6 100,430,432 105,525,719Total Current Assets 4,190,368,396 3,450,672,623Non-Current AssetsLong-term receivables, net 7 12,092,371,447 12,610,641,898Long-term investments 8 843,731,598 396,890,811Property and equipment, net 9 181,498,370 145,915,695Other non-current assets 10 253,392,772 171,284,131Total Non-Current Assets 13,370,994,187 13,324,732,535TOTAL ASSETS 17,561,362,583 16,775,405,158LIABILITIES AND EQUITYCurrent LiabilitiesAccounts payable 11 637,270,243 100,873,222Payables to government agencies 12 85,279,774 587,497,051Other current liabilities 2,13 2,029,604,154 1,142,860,875Total Current Liabilities 2,752,154,171 1,831,231,148Non-Current LiabilitiesLoans Payable, Government of the Phils 2, 14 2,372,837,063 2,594,688,000Loans Payable - Foreign, net of current portion 2, 15 5,452,169,682 5,763,459,807Loans Payable, Local 2, 16 516,626,666 608,280,000Deferred Credits 17 715,655,452 409,837,203Total Non-Current Liabilities 9,057,288,863 9,376,265,010TOTAL LIABILITIES 11,809,443,034 11,207,496,158EQUITY 5,751,919,549 5,567,909,000TOTAL LIABILITIES AND EQUITY 17,561,362,583 16,775,405,158See accompanying Notes to Financial Statements.26 Local Water Utilities Administration
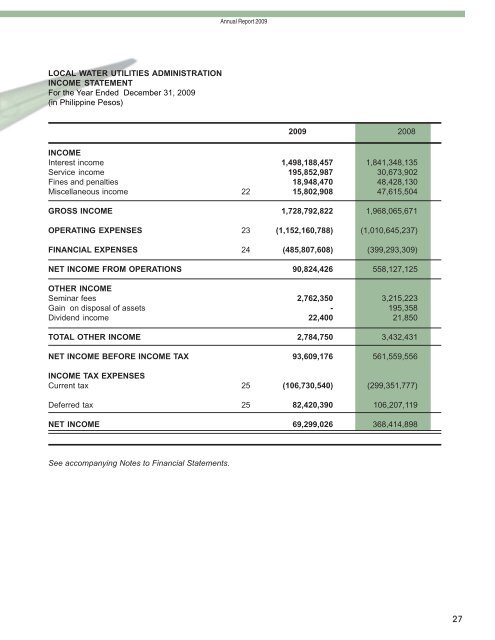
<strong>Annual</strong> <strong>Report</strong> <strong>2009</strong>LOCAL WATER UTILITIES ADMINISTRATIONINCOME STATEMENTFor the Year Ended December 31, <strong>2009</strong>(in Philippine Pesos)<strong>2009</strong> 2008INCOMEInterest income 1,498,188,457 1,841,348,135Service income 195,852,987 30,673,902Fines and penalties 18,948,470 48,428,130Miscellaneous income 22 15,802,908 47,615,504GROSS INCOME 1,728,792,822 1,968,065,671OPERATING EXPENSES 23 (1,152,160,788) (1,010,645,237)FINANCIAL EXPENSES 24 (485,807,608) (399,293,309)NET INCOME FROM OPERATIONS 90,824,426 558,127,125OTHER INCOMESeminar fees 2,762,350 3,215,223Gain on disposal of assets - 195,358Dividend income 22,400 21,850TOTAL OTHER INCOME 2,784,750 3,432,431NET INCOME BEFORE INCOME TAX 93,609,176 561,559,556INCOME TAX EXPENSESCurrent tax 25 (106,730,540) (299,351,777)Deferred tax 25 82,420,390 106,207,119NET INCOME 69,299,026 368,414,898See accompanying Notes to Financial Statements.27