download the full article here - EISRJC
download the full article here - EISRJC
download the full article here - EISRJC

Create successful ePaper yourself
Turn your PDF publications into a flip-book with our unique Google optimized e-Paper software.
Table of Contents1.Web-Enhanced Learning In Medical Clerkship…………Carl Froilan D. Leochico, PTRP, and John Anthony A. Domantay,MD, FPSP, PhD …2912. Pathology Of Gout In Growing Layers Attributed To High Calcium AndProtein Diet……Ibrahim M. Eldaghaye, Mohamed A. Hamid, Sayed R. El-Attarand Abdoalwahab M. Kammon ...2973 Contribution Of Smoke-Belching Vehicles To The Green House GasesConcentration In The City Of Dipolog………….Bernard G. Gilaga and Rowell B. Pallega4. Estimation Of Greenhouse Gas (Ghg) Emission Level From Waste AndGarbage Disposed In The Coastal Barangays Of Dapitan City: ImplicationsTo Their Waste Management Practices………….S. Campiseño and R. Laranjo...303…3095. Induced Forces In Polymer Blends Versus Temperature………….S. El Fassi, M. Benhamou, H. Ridouane, M. El Yaznasni …3156. Lifestyles Of City Barangay Residents Associated To Climate Change………….Daylinda Luz R. Laput and Jay D. Telen…3347. Estimating The Health And Economic Vulnerabilities Of The IndigenousPeople (Ip) In Zamboanga Del Norte To The Effects Of Climate Change………..W. Nabua, N. Bureros and J. Aquino …3458. Harmful Algal Bloom Occurrence In Murcielagos Bay Amidst ClimateChange………….J. Aquino, B. Flores and M. Naguit…3589. Hydrobiological Assessment Of Liboran River, Dapitan City…………….S. Campiseño, E. Campiseño, M.R. Naguit & B. Flores …36610. Direct And Indirect Economic Impact Of Climate Change On TheProvincial Tourism, Agriculture And Commercial Sectors Of ZamboangaDel Norte…………………… W. D. Carreon and J.S. R. Campiseño …377
E-International Scientific Research JournalISSN: 2094-1749 Volume: 2 Issue: 4, 2010AbstractWEB-ENHANCED LEARNING INMEDICAL CLERKSHIPCarl Froilan D. Leochico, PTRP, and John Anthony A. Domantay, MD, FPSP, PhDIntroduction: With <strong>the</strong> advent of modern technology, different schools, including medicalschools in <strong>the</strong> Philippines, are shifting towards <strong>the</strong> use of technological advancements as partof <strong>the</strong>ir academic curricula. Before significant steps can be initiated towards <strong>the</strong> design andimplementation of an e-learning medical website, it is imperative to assess <strong>the</strong> readiness andacceptance of various stakeholders regarding <strong>the</strong> innovative concept. Methods: A crosssectionalstudy design was used. Questionnaires were administered to fourth year medicalstudents of SLU-COM, various medical educators in affiliated training hospitals, and <strong>the</strong>College Dean. Data analyses (t-test, f-test, chi-square test) were done using MS Office Excel2003, with level of significance set at 0.05. Results: Instrument was reliable with a Cronbach’scoefficient alpha of 0.85. Only 53 clinical clerks were obtained as respondents. Majority of<strong>the</strong>m were females (70%) and had an average household monthly income (53%), but all had anaccess to computer (100%). An average of 47 clerks (89%) answered “yes” (implying access)to all items in <strong>the</strong> Resources part. T<strong>here</strong> was no significant difference in <strong>the</strong> access toresources among <strong>the</strong> fifteen different items (x 2 = 5.418). Out of 4, respondents had <strong>the</strong>following means: skill of 3.47, accepted teaching-learning techniques of 3.12, and preferredmedical website contents of 3.30. Generally, significant differences were found between malesand females in all aspects, except for resources. Conclusion: The clinical clerks were veryready for e-learning based on high level of resources and skills, and showed moderate level ofacceptance for e-learning as a teaching-learning approachKeywords: e-learning, web-enhance learningIntroductionIn preparation of its students for entry into actual practice of <strong>the</strong> field, <strong>the</strong> medicalschool provides a suitable environment, w<strong>here</strong> one can develop a strong, working foundationof current medical knowledge, skills, and attitudes. The training a medical student undergoes islong and tedious before he can be awarded <strong>the</strong> prestigious title of “Doctor of Medicine(M.D.).” After earning a bachelor’s degree in arts or sciences that takes about four to fiveyears, depending on <strong>the</strong> pre-medical course, <strong>the</strong> physician-to-be takes his first step in <strong>the</strong>medical school, which entails ano<strong>the</strong>r three years of intensive classroom-based lectures, andone year of rigorous hospital- and community-based training (clerkship). Followinggraduation, he continues his medical education as a post-graduate intern as a prerequisite intaking <strong>the</strong> Physician Licensure Examinations, <strong>the</strong> benchmark of <strong>the</strong> beginning of his medicalcareer. He wants to be trained with <strong>the</strong> most effective and latest instructional strategies so tha<strong>the</strong> can pave his way towards his goal of becoming a competent and holistic doctor, competitivelocally and globally. It is in this light that medicine students should be given <strong>the</strong> utmostassistance to guide <strong>the</strong>m in <strong>the</strong>ir journey.Medical schools across <strong>the</strong> world have taken advantage of educational technology, suchas custom-designed course websites. In 2000, a group of European medical universities291
E-International Scientific Research JournalISSN: 2094-1749 Volume: 2 Issue: 4, 2010collaborated in designing a pilot project, entitled “Tuning educational structures in Europe,”which intended to adopt Virtual Learning Environment (VLE) and Managed LearningEnvironment (MLE) as teaching-learning strategies to cater to <strong>the</strong> students of <strong>the</strong> currentgeneration (WHO-WFME, 2005).Fur<strong>the</strong>rmore, in Sou<strong>the</strong>ast Asia, <strong>the</strong>re are currently 261 recognized medical schools thatprovide education parallel to developed countries by using <strong>the</strong> latest technology on <strong>the</strong>ir way togrowth, change, and development. Indeed, universities and o<strong>the</strong>r institutions of hig<strong>here</strong>ducation are increasingly turning to e-learning, as a vehicle for quality assurance. Fortunately,after grueling efforts and critical decisions, all accredited medical schools said that <strong>the</strong>y “havebenefited from quality assurance measures and standards, and in consequence producedphysicians of better quality” (WHO-WFME, 2005).E-learning, also known as evolving, enhanced, or extended learning, which is <strong>the</strong> use ofmulti-channeled technology in learning opportunities (Logan, n.d.), has long penetrated <strong>the</strong>culture of <strong>the</strong> Philippines, particularly in <strong>the</strong> field of education. Now in a climate of borderlessteaching and learning, many schools have taken on <strong>the</strong> challenge of integrating e-learning into<strong>the</strong>ir curricula in response to “continual developments in information and communicationtechnology, a shift in learner expectation, changing demographics of learners, and rapiddevelopment of subject knowledge…” (Engelbrecht, 2003). For instance, through UST’sBlackboard Learning System, called “e-leap,” and SLU’s Learning Management System,called “mySLU,” universities are gradually bringing e-learning into <strong>the</strong> mainstream of <strong>the</strong>ireducational programs.However, “<strong>the</strong>re is no point in using new technology unless it generates moreproductive learning experiences for students” (McKeachie, 1999). Moreover,in order to avoid waste of efforts, time, and money, it is imperative to highlight “<strong>the</strong>importance of mental readiness, right attitude, and appropriate training on computingknowledge and skills of students before implementing <strong>the</strong> integration of technology in anyeducational system” (Bahari and Hamed, 2009). Moreover, teachers know very well thatmotivation and interest are integral factors that influence <strong>the</strong> way information is used andcritically evaluated by <strong>the</strong> students. Hence, <strong>the</strong> preferred design of <strong>the</strong> course, comfort withonline technologies, skills, and motivation of <strong>the</strong> learner are all essential in creating asuccessful online learning environment (Song et al., 2004; Santhanam and Leach, 2000).The aim of <strong>the</strong> study, <strong>the</strong>refore, was to determine <strong>the</strong> level of readiness for, and level ofacceptance of web-enhanced learning among clinical clerks and <strong>the</strong>ir medical educators.Specifically, <strong>the</strong> present study wants to answer <strong>the</strong> following questions:1. What is <strong>the</strong> level of readiness for e-learning based on access to resources among<strong>the</strong> following respondent groups, namely: (a) clerks, (b) senior resident physicians, trainingofficers, and department heads, and (c) Dean of SLU College of Medicine (SLU-COM)?2. Are <strong>the</strong>re significant differences in <strong>the</strong> level of readiness for e-learning based onaccess to resources among <strong>the</strong> respondent groups in terms of <strong>the</strong> following: (a) gender, (b)socio-economic status, (c) respondent groups, (d) computer ownership, and (e) field ofspecialization (only for medical educators)?3. What is <strong>the</strong> level of readiness for e-learning based on <strong>the</strong> presence of technicalskills among <strong>the</strong> aforementioned respondent groups?4. Are <strong>the</strong>re significant differences in <strong>the</strong> level of readiness for e-learning based on<strong>the</strong> presence of technical skills among <strong>the</strong> respondent groups in terms of <strong>the</strong> following: (a)gender, (b) socio-economic status, (c) respondent groups, (d) computer ownership, and (e) fieldof specialization (only for medical educators)?292
E-International Scientific Research JournalISSN: 2094-1749 Volume: 2 Issue: 4, 20105. What is <strong>the</strong> level of acceptance of e-learning based on preferred teachinglearningtechniques among <strong>the</strong> respondent groups?6. Are <strong>the</strong>re significant differences in <strong>the</strong> level of acceptance of e-learning basedon preferred teaching-learning techniques among <strong>the</strong> respondent groups in terms of <strong>the</strong>following: (a) gender, (b) socio-economic status, (c) respondent groups, (d) computerownership, and (e) field of specialization (only for medical educators)?7. What are <strong>the</strong> most preferred contents of a customized e-learning medicalwebsite according to <strong>the</strong> different respondent groups?8. Are <strong>the</strong>re significant differences in <strong>the</strong> preferred customized e-learning medicalwebsite contents among <strong>the</strong> respondent groups in terms of <strong>the</strong> following: (a) gender, (b) socioeconomicstatus, (c) respondent groups, (d) computer ownership, and (e) field of specialization(only for medical educators)?MethodsA cross-sectional study was conducted on all regular fourth year medical studentsenrolled in SLU-COM during <strong>the</strong> school year 2009 to 2010, as well as <strong>the</strong>ir medical educators(senior resident physicians, training officers, and department heads of affiliated hospitals, and<strong>the</strong> College Dean).The questionnaire, entitled “E-learning Readiness and Acceptance Evaluation,” wasformulated through various readings on related literature. It consisted of two major parts. Thefirst part was meant to obtain demographic data. The second part consisted of three Constructs,namely, Resources, Skills, and Preferences.The face and content validity of <strong>the</strong> research instrument was established after scrutinyand critique by <strong>the</strong> Dean of <strong>the</strong> College of Medicine. A pre-test was conducted to establishreliability of <strong>the</strong> questionnaire using Cronbach’s coefficient alpha. Data analyses were doneusing Microsoft Office Excel 2003. The level of significance was set at 0.05.Treatment of DataWith a variety of data types per Construct, different evaluation schemes were designed,as modified from related studies.Construct 1: Resources. In order to establish <strong>the</strong> level of access to technology of <strong>the</strong>general population, <strong>the</strong> total count of “yes” per item on resources was obtained, and summedup. T<strong>here</strong>after, <strong>the</strong> level of readiness was evaluated using <strong>the</strong> grouped frequency distribution:Total Score Level of Readiness 12 – 15 Very Ready8 – 11 Moderately Ready4 – 7 Slightly Ready0 – 3 Not ReadyChi-square test was done to determine <strong>the</strong> relationship among different Resources items, andamong variables (e.g., gender, and income) in terms of over-all access to resources.Construct 2: Skills. General computer technical skills were assessed based on <strong>the</strong>following levels, patterned after a study done by Mercado (2009): 4 – Very Good Skills, 3 –Good Skills, 2 – Poor Skills, and 1 – No Skills. Each level of skills reflected a correspondinglevel of readiness.Construct 3: Preferences. The preferred teaching-learning techniques and perceivedpossible contents of a customized e-learning medical website were obtained. The levels ofpreference were described in <strong>the</strong> following manner: 4 – Very Much Preferred, 3 – Preferred, 2– Slightly Preferred, and 1 – Not Preferred. The levels of acceptance of e-learning werereflected solely by <strong>the</strong>ir corresponding levels of teaching-learning technique preferences.293
E-International Scientific Research JournalISSN: 2094-1749 Volume: 2 Issue: 4, 2010Preferences for various contents of an e-learning medical website only determined <strong>the</strong>predilection of <strong>the</strong> respondents, and were not used to determine <strong>the</strong> level of acceptance of e-learning approach in particular.The arithmetic weighted means for all Constructs were computed for qualitativeinterpretation, as reflected in Table 1.Significant Differences among Variables. The levels of readiness and acceptance, and<strong>the</strong> preferences for possible website contents varied according to socio-economic status,respondent groups, and field of specialization, which were treated using one-way analysis ofvariance (ANOVA). Meanwhile, significant differences in gender and computer ownershipwere analyzed using t-test for independent samples, except in <strong>the</strong> Resources construct, w<strong>here</strong>inx 2 was obtained.Results and DiscussionA pre-test, which involved irregular clinical clerks (10), was done to establishinstrument reliability, which yielded a Cronbach’s coefficient alpha of 0.85, which wasdeemed reliable since it was greater than 0.70. For <strong>the</strong> actual study, among <strong>the</strong> targetrespondents, only <strong>the</strong> clinical clerks were able to return accomplished questionnaires. O<strong>the</strong>rtarget respondent groups (medical educators) were not able to return any questionnaire owingto <strong>the</strong>ir busy schedule and varied priorities; such was one of <strong>the</strong> limitations of <strong>the</strong> study.The demographic characteristics of <strong>the</strong> study population were summarized in Table 2.Since <strong>the</strong> respondents were all clerks, <strong>the</strong> variables field of specialization and respondent groupwere not anymore considered as confounding variables. Having average household monthlyincome, <strong>the</strong> respondents generally were at least in <strong>the</strong> middle class of <strong>the</strong> society; hence, allstudents had an easy access to computers, whe<strong>the</strong>r personal (owned) or shared, especiallywhen <strong>the</strong> need arises in school or hospital.Level of E-learning Readiness in terms of Resources. It was established using chisquare(one-way) that <strong>the</strong>re were no significant differences in <strong>the</strong> access to resources among allitems in <strong>the</strong> Resources Construct (computed x 2 5.418 > critical value 23.685), as presented inTable 3A. After counting all “yes” per Resource question, and summing <strong>the</strong>m up for a total of15 items, an average of 13.15 was obtained and given an equivalent level of readiness as “veryready” according to <strong>the</strong> established grouped frequency distribution (please refer to Methods).T<strong>here</strong>fore, it was justified to follow <strong>the</strong> grouped frequency distribution method to establish <strong>the</strong>level of readiness since all items did not vary significantly as to <strong>the</strong> presence of access amongrespondents. This means that <strong>the</strong> resources asked in <strong>the</strong> Resources construct were homogenous,implying each item was generalizable or indeed related to all o<strong>the</strong>r items in <strong>the</strong> Construct.None<strong>the</strong>less, it was discovered that while majority had adequate materials (e.g., fast processor,functioning hardware, and up-to-date software) needed for an e-learning environment, <strong>the</strong>re arestill 13 (~25%) out of 53 students who usually get disconnected when accessing <strong>the</strong> internet,which must be probed fur<strong>the</strong>r and addressed in <strong>the</strong> future (Tables 3B and 3C).T<strong>here</strong> were no found significant differences between gender and <strong>the</strong> access to resources(Table 3B). Similarly, an above average, average, or below average household monthly incomedid not vary in terms of access to resources (Table 3C), implying that <strong>the</strong>ir access to resourceswas nei<strong>the</strong>r restricted nor fur<strong>the</strong>red by <strong>the</strong>ir economic status; all had equal footing. Hence, asan over-all implication, an environmental scanning of resources was accomplished by <strong>the</strong>present study, w<strong>here</strong>in <strong>the</strong> survey revealed that <strong>the</strong> clerks had general access to generalcomputer hardware and software, and <strong>the</strong> internet, which are all prerequisites in considering e-learning as a teaching-learning method. T<strong>here</strong>fore, based solely on access to resources, <strong>the</strong>ywere very ready for an e-learning environment.294
E-International Scientific Research JournalISSN: 2094-1749 Volume: 2 Issue: 4, 2010Level of E-learning Readiness in terms of Skills. Table 4A showed that <strong>the</strong> clerksgenerally had very good skills (VGS) in terms of general computer technical proficiency, withan equivalent level of readiness of “very ready” (Table 1). The clerks were highly skilled inoperating <strong>the</strong> software and hardware of <strong>the</strong> computer, and in generally finding <strong>the</strong>ir wayaround <strong>the</strong> World Wide Web. However, skills have yet to be developed in applying coursematerials, and in managing <strong>the</strong>ir time to accommodate e-learning into <strong>the</strong>ir schedule (Table4A).Significant differences were found between males and females in terms of skills.Generally, males were more skilled than females (Table 4B), owing to <strong>the</strong> technical andmanual inclination more favored by and suited for males than females, who were less “tech-y.”However, <strong>the</strong>re were no significant differences among <strong>the</strong> three levels of household monthlyincome (Table 4C), implying that skills were not dependent on <strong>the</strong>ir economic status.Level of E-learning Acceptance in terms of Preference for Modern Teaching-LearningTechniques. The clinical clerks preferred only to a moderate degree <strong>the</strong> modern teachinglearningtechniques as part of clerkship, as reflected by a mean of 3.12 out of 4 (Table 5A).Hence, <strong>the</strong>y have only moderately accepted e-learning as a future innovation in <strong>the</strong> curriculum(Table 1). Fur<strong>the</strong>r studies should be done to assess <strong>the</strong> reasons behind such occurrence.Never<strong>the</strong>less, highest mean preference was found in applying common internet applications toassist in <strong>the</strong> learning process; thus respondents generally favored <strong>the</strong> use of technology as partof <strong>the</strong>ir school life. However, <strong>the</strong> results showed that a majority still favored traditionalmethods (e.g., listening to a lecture) over modern ones (e.g., surfing <strong>the</strong> net to understand andretain information), which must fur<strong>the</strong>r be expanded and explained in <strong>the</strong> future.Similar to skills, significant differences were found between genders, but not amongincome levels. Males had higher preference for modern techniques of learning than females,who were less “gadget-y” and “tech-y” (Table 5B). This predisposition was definitely notaffected by economic status (Table 5C).Preference for Various Medical Website Contents. In general, <strong>the</strong> respondents assertedvery high preference for <strong>the</strong> website contents listed on <strong>the</strong> questionnaire. They found relativelygreater preferences for having <strong>download</strong>/ upload options, and online reviewers and exams thanhaving videoconferences and online advertisements (Table 6A). These preferences weresignificantly varied between genders possibly for <strong>the</strong> similar aforementioned reasons, but werenot affected by varied economic status (Tables 6B and 6C).Conclusion and RecommendationsIn <strong>the</strong> present world of modern technology, various electronic innovations haveenormously increased one’s ability to progress in his field or profession. Relevantly, <strong>the</strong>seadvancements have also established <strong>the</strong>ir place in contemporary educational practice. Theycontinue to become an integral part of <strong>the</strong> teaching and learning process, and serve as “enginesof change” in classrooms and schools (Norton, 2003). Change towards human and societaldevelopment is an essential purpose of integrating technology into <strong>the</strong> educational system. Theuse of <strong>the</strong>se modern tools, such as e-learning, must indeed serve as man’s instrument forattaining a higher quality of education.In anticipation of an e-learning initiative in SLU College of Medicine, <strong>the</strong> present studyestablished that <strong>the</strong> clinical clerks were very ready for such endeavor, as reflected by <strong>the</strong>ir highlevel of access to computer and internet-related resources, and high level of technical skills.However, <strong>the</strong> research has not probed into reasons behind <strong>the</strong> moderate acceptance of clerkstowards e-learning as a teaching-learning technique. In <strong>the</strong> occasion that planning for e-learning has begun, <strong>the</strong> various contents that <strong>the</strong> clerks had very much preferred in this study295
E-International Scientific Research JournalISSN: 2094-1749 Volume: 2 Issue: 4, 2010could be considered in designing and customizing a medical website suited for <strong>the</strong> futureclerks of <strong>the</strong> College.Lastly, in <strong>the</strong> light of <strong>the</strong> limitations of <strong>the</strong> study (e.g., time constraints, lack ofquestionnaire returns, and lack of o<strong>the</strong>r respondent groups), it was highly recommended thatsimilar researches be done to involve a large population so conclusions can be generalizableand more valid, such that medical educators could also be surveyed and considered. Moreover,learning styles and multiple intelligences could be added as confounding variables. It couldalso be interesting to correlate <strong>the</strong> state of access to resources and <strong>the</strong> respondents’ level ofskills. All <strong>the</strong>se could be most helpful during <strong>the</strong> significant first steps towards integrating ane-learning environment to improve <strong>the</strong> clerkship curriculum and academic performance ofstudents in Saint Louis University - College of Medicine.ReferencesBahari, P., and Hamed, S. (2009). Using web-based resources in learning: Factors that affectdegree students’ readiness. Retrieved April 24, 2010 from:http://www.scribd.com/doc/13407731/Using-Webbased-Resources-in-Learning-Factors-That-Affect-Degree-Students-ReadinessDomantay, J. A. (2002). Towards quality medical education: diagnosis of a medical school.(Doctoral dissertation, Saint Louis University).Engelbrecht, E. (2003). A look at e-learning models: Investigating <strong>the</strong>ir value for developingan e-learning strategy. Retrieved April 26, 2010 from:http://www.unisa.ac.za/contents/faculties/service_dept/bld/progression/docs/engelbrecht.pdfLogan, R. (n.d.) E-learning and knowledge management. Retrieved May 2, 2010 from:http://www.managersforum.com/eLearning/McKeachie, W. J. (1999). Teaching tips: Strategies, research, and <strong>the</strong>ory for college anduniversity teachers (10th ed.). Boston, MA: Houghton Mifflin Company.Mercado, C. A. (2009). Readiness-based strategies of an e-learning environment at <strong>the</strong> SaintLouis University Graduate Program. (Doctoral dissertation proposal, Saint Louis University).Norton, P., and Wiburg, K.M. (2003). Teaching with technology: designing opportunities tolearn, 2nd ed. Belmont, California: Wadsworth/ Thomson Learning.Song, L., Singleton, E. S., Hill, J. H., and Koh, M. H. (2004). Improving online learning:Student perceptions of useful and challenging characteristics. Retrieved April 24, 2010 from:http://www.scribd.com/doc/13407731/Using-Webbased-Resources-in-Learning-Factors-That-Affect-Degree-Students-ReadinessWHO-WFME Task Force on Accreditation. (2005). Accreditation of medical educationinstitutions: report of a technical meeting, Schaeffergården, Copenhagen, Denmark, 4-6October 2004. Retrieved April 28, 2010, from World Health Organization website:www.who.int/hrh/documents/WFME_report.pdf296
E-International Scientific Research JournalISSN: 2094-1749 Volume: 2 Issue: 4, 2010PATHOLOGY OF GOUT IN GROWING LAYERSATTRIBUTED TO HIGH CALCIUMAND PROTEIN DIETIbrahim M. Eldaghayes 1* , Mohamed A. Hamid 2 , Sayed R. El-Attar 3and Abdoalwahab M. Kammon 21 Department of Microbiology and Parasitology, 2 Department of Poultry and Fish Diseases,3 Department of Pathology and Clinical Pathology, Faculty of Veterinary Medicine, Al-FatehUniversity, P.O.Box 13662, Tripoli, Libya.AbstractAn outbreak of gout was investigated in a growing layers farm of 45000 birds locatedin Tripoli, Libya. Mortality was commenced at 39 days-old reaching to a total of 489 birdswithin 10 days. Post mortem was conducted and kidney tissue samples were fixed in 10%neutral formalin prior to processing. Feed samples were sent to <strong>the</strong> Animal NutritionDepartment for analysis which revealed 23.47% crude protein and 3.5% calcium. Gross lesionscomprised of deposition of chalky white material covering <strong>the</strong> pericardium and enlargedkidneys with necrotic foci, hemorrhage and nephrosis. Most of birds showed swollen ureter ofone or both sides. Histopathologically, severe damage of tubules characterized by moderate tosevere tubular dilation and necrosis and central bluish gouty deposition surrounded byradiations of needle like urate crystals followed by granulomatous reaction of lymphocytes,macrophages and fibroblasts. The collecting renal tubules, urinephric ducts and ureters werealso filled by gouty deposits with epi<strong>the</strong>lial hyperplastic changes and chronic inflammatorycellular reaction in <strong>the</strong>ir walls. The interstitial tissue showed edema, congestion, hemorrhageand lymphomononuclear cell infiltration. This gout outbreak in growing layers is attributed tohigh concentration of crude protein and calcium in diet.Keywords: Gout, Layers, Calcium, ProteinIntroductionGout is one of <strong>the</strong> important disorders associated with kidney damage in birds. The causes of gout aremany as kidney damage occurs due to multi-etiological factors which can broadly categorized asnutritional and metabolic causes, infectious causes and o<strong>the</strong>r causes like mycotoxins. Higher levels ofdietary proteins cause excess uric acid production (Li et al., 1998). Dietary protein plays an importantrole in <strong>the</strong> development and progression of kidney injury. An increase in dietary protein can cause anincrease in kidney size and glomerular filtrate rate (GFR), with subsequent glomerular injury,accumulation of mesangial deposits, and, eventually, glomerulosclerosis (Khan and Alden 2001). Birdsare uricotelic and lack uricase; <strong>the</strong> enzyme which converts uric acid to less harmful substances.Impairment of kidney function results in excessive accumulation of uric acid in tissues. Uric acid itselfis not toxic but precipitated crystals can cause severe mechanical damage to tissues like kidneys, heart,lungs, intestine (visceral gout) and also in <strong>the</strong> joints (articular gout). Visceral and articular gouts havebeen reported in pheasants, Japanese quail, ducks, aviary birds and chickens (Fitz-Coy et al., 1988;Nayak et al., 1988; Rao et al., 1993). Experimentally, <strong>the</strong> combined effects of high dietary calcium andprotein concentrations on <strong>the</strong> induction of visceral gout in growing birds of a layer strain was297
E-International Scientific Research JournalISSN: 2094-1749 Volume: 2 Issue: 4, 2010investigated (Guo et al., 2005) and a typical visceral gout was induced by <strong>the</strong> high calcium and proteindiet.The present paper describes pathological investigation into an outbreak of gout in growinglayer chickens.Materials and MethodsMortality was recorded in growing layers farm of 45000 birds located in Tripoli, Libya.Mortality associated with gout was commenced at 39 days-old reaching to a total of 489 birdswithin 10 days. Dead chickens were brought to <strong>the</strong> Department of Poultry and Fish Diseases,Faculty of Veterinary Medicine, Tripoli, Libya for diagnosis. Post mortem was conducted andtissue pieces from affected kidneys were fixed in 10% neutral formalin prior to processing.After overnight washing in running water and dehydration in ascending grades of alcohol, <strong>the</strong>tissues were embedded in paraffin and 5 µ thick sections were cut and stained withhaematoxylin and eosin (H&E) as per <strong>the</strong> method of Luna (1968). Feed samples were sent to<strong>the</strong> Animal Nutrition Department, Faculty of Veterinary Medicine, Tripoli, Libya for analysis.Results and DiscussionThe total mortality of approximately 1.1% (489 out of 45000) within 10 days observedin present outbreak was almost similar to <strong>the</strong> general incidence of 2-15% in layers associatedwith gout (Sonmez 1992). Mortality of 18.77% was reported in Kashmir favorella poultry overa period of 6 months which was attributed to 16.39% crude protein in poultry feed (Mir et al.,2005). In ano<strong>the</strong>r report, 181 of 300 broilers died over a 29 day period due to high protein diet(Nayak et al., 1988).In present study, <strong>the</strong> gross and histopathological changes were suggestive of visceralgout due to high protein feed which was confirmed by 23.47% crude protein in feed and highcalcium 3.5% (Table 1). Gross lesions comprised of deposition of chalky white materials onpericardial sac and enlargement of kidneys with necrotic foci and hemorrhage (Figure 1). Mostof birds showed swelling of ureter of one or both sides (Figure 2). Histopathologically, severedamage of tubules characterized by moderate to severe tubular dilation and necrosis andcentral bluish gouty depositions (Figure 3) surrounded by radiations of needle like uratecrystals (Figure 4) followed by granulomatous reaction of lymphocytes, macrophages andfibroblasts with haemorrhages (Figure 5). The collecting renal tubules, urinephric ducts andureters were also filled by gouty deposits with epi<strong>the</strong>lial hyperplastic changes and chronicinflammatory cellular reaction in <strong>the</strong>ir walls (Figure 6). The interstitial tissue showed edema,congestion, hemorrhage and lymphomononuclear cell infiltration (Figure 7). Glomerularchanges included thickening of Bowman’s capsule and proliferative glomerulonephritis(Figure 8).These lesions were in consistence with <strong>the</strong> earlier study by Nayak et al. (1988) whoreported white chalky masses in <strong>the</strong> liver, kidney, visceral organs and joints. Histologicalchanges of kidney comprised of cell infiltration, destruction of both glomeruli and tubules withurate crystal deposits. The remainder of <strong>the</strong> kidney parenchyma was degenerative, necrotic andhaemorrhagic. Mubaraka and Sharkawy (1999) described microscopic changes of gout inducedin laying pullets by sodium bicarbonate toxicity which revealed significant urate depositsassociated with tubular necrosis.In addition to kidney, o<strong>the</strong>r visceral organs are commonly affected by gout. Mir et al.(2005) reported an outbreak of gout attributed to disproportionate Ca : P ratio (3.5 : 1) and16.39% crude protein. Grossly, dry platery patches of white chalky urate deposits wereobserved on <strong>the</strong> breast muscles, neck and on serosal surfaces of pericardium, peritoneum,mesentery, proventriculus, gizzard, testes, ovaries, over <strong>the</strong> abdomen and chest wall. The298
E-International Scientific Research JournalISSN: 2094-1749 Volume: 2 Issue: 4, 2010urates were observed on kidneys, in <strong>the</strong> pericardial sac and over <strong>the</strong> pericardium, on liver,spleen, lungs and air sacs. Nephropathy, observed consistently, was characterized by unilateralenlargement of kidneys, most prominently of <strong>the</strong> cranial lobe, which bulged out of <strong>the</strong> bonydepression. The kidney lobes of <strong>the</strong> contralateral side were atrophied, especially <strong>the</strong> caudallobes. Occasionally, <strong>the</strong> cranial lobes of both <strong>the</strong> kidneys were enlarged. Ureters of ei<strong>the</strong>r sidewere found to be distended with retained semifluid to semisolid chalky white urates, givingcord-like appearance to ureters. Histopathological examination revealed urate deposits in <strong>the</strong>kidneys, liver, spleen, lungs and joints resulting in severe damage. Kidney parenchyma wasatrophied and revealed degenerative and necrotic changes associated with haemorrhagesinvolving glomeruli, cortical and medullary tubules, collecting ducts and medullary tracts.Glomerular changes included atrophy, distortion and segmentation. The tubules showeddegeneration and desquamation. Uric acid deposits replacing parenchyma was surrounded byinflammatory cells including heterophils initially, followed by lymphocytes, macrophages andgiant cells along with fibroplasias. Collecting ducts and medullary tracts also revealed presenceof urate crystals and numerous heterophils.In a recent study, Al-Hamadani and Mohammed (2009) reported lesions of kidney in layers thatmay be caused by multiple agents. These lesions were variable from visceral gout that characterizedgrossly by precipitation of urate salts to enlargement of kidney with congestion and hemorrhage orpaleness. Histological examination of kidney showed swelling and degeneration of epi<strong>the</strong>lial cell ofrenal tubules (Nephrosis) that caused stenosis of blood vessels and infiltration of mononuclearinflammatory cells, in addition to desquamation of epi<strong>the</strong>lial cell of renal tubules with dilation of somerenal tubules and hemorrhage in <strong>the</strong> interstitial tissue of kidney. O<strong>the</strong>r cases showed necrosis of renaltubules epi<strong>the</strong>lium, necrosis of glomerular renal tuft and dilation of bowman's space. T<strong>here</strong> wereprecipitation of urate salts in <strong>the</strong> lumen of renal tubules and <strong>the</strong>se cases observed mostly in peak ofproduction.Although most of poultry feed producers are following <strong>the</strong> requirements suggested by NRC(1994), <strong>the</strong>se requirements have been considered low nowadays due to continued increase in growthrate of birds and <strong>the</strong> demand for increasing <strong>the</strong> daily recommended intake of vitamin requirements for<strong>the</strong> consumers (Lesson 2007). But re-evaluation of dietary protein and vitamin specifications has to beworked out taking into consideration <strong>the</strong> difference in requirements between poultry breeds.It is concluded that growing layers are susceptible to high protein and calcium diets. The studystressed <strong>the</strong> need to evaluate <strong>the</strong> concentrations of all feed components in poultry feed.Table 1. Result of feed sample analyses*Fiber % Fat % Protein % Calcium % Ash % Moisture %4.43 2.82 23.47 3.5 6.58 10.23*Average of different feed samples taken from <strong>the</strong> same feed source of <strong>the</strong> affected farm.299
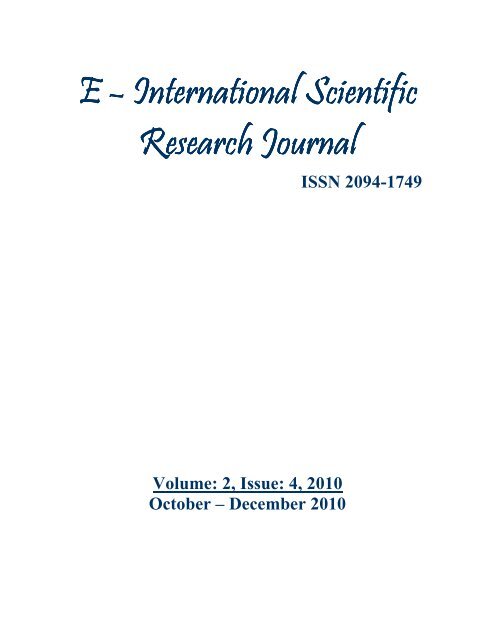
E-International Scientific Research JournalISSN: 2094-1749 Volume: 2 Issue: 4, 2010Figure legendFig. 1. Deposition of chalky white materials on pericardial sac (arrow) and enlargement of kidneys withnecrotic foci (arrow)Fig. 2. Swelling of ureter of one side (arrow) and enlargement of kidneysFig. 3. Section of kidney showing severe damage of tubules characterized by moderate to severe tubulardilation and necrosis and central bluish gouty depositions (arrows). H&E ×40Fig. 4. Section of kidney showing interstitial radiations of needle like urate crystals (arrow). H&E ×40Fig. 5. Section of kidney showing granulomatous reaction of lymphocytes, macrophages and fibroblastswith haemorrhages. H&E ×40Fig. 6. Section of kidney showing accumulation of gouty deposits in <strong>the</strong> collecting renal tubules,urinephric ducts and ureters with epi<strong>the</strong>lial hyperplastic changes and chronic inflammatory cellularreaction <strong>the</strong>ir walls (arrow). H&E ×20.Fig. 7. Section of kidney showing edema, congestion, hemorrhage and lymphomononuclear cellinfiltration in <strong>the</strong> interstitial tissue. H&E ×20Fig. 8. Section of kidney showing thickening of Bowman’s capsule and proliferativeglomerulonephritis (arrow). H&E ×20300
E-International Scientific Research JournalISSN: 2094-1749 Volume: 2 Issue: 4, 2010301
E-International Scientific Research JournalISSN: 2094-1749 Volume: 2 Issue: 4, 2010ReferencesAl-Hamadani, A.H. and M.H. Mohammed, 2009. The relationship between <strong>the</strong> lesions ofkidneys and <strong>the</strong> different production stages in layers. Iraqi Veterinary Journal, 23(1): 211-217.Fitz-Coy, S.H., S.A. Edgar and F.J. Hoerr, 1988. An outbreak of urolithiasis in single combWhite Leghorn pullets. Avian Diseases, 32: 563-566.Guo, X., K. Huang and J. Tang, 2005. Clinicopathology of gout in growing layersby high calcium and high protein diets. British Poultry Science, 46(5): 641-646.inducedKhan, K.M. and C.L. Alden, 2001. Kidney. In: Hashek W M, Rousseaux C G and Wallig M A(ed) 2001. Handbook of Toxicologic Pathology. Academic Press, San Diego, CA. pp 255-336.Lesson S., 2007. Vitamin requirements: is <strong>the</strong>re basis for re-evaluation dietary specifications?World Poultry Science Journal, 63: 255-266.Li, X.M., M.X. Deng, Q.Y. Li, R.Y. Jia and J. Wang, 1998. Experimental study on <strong>the</strong> clinicalpathology of urate deposition in chickens. Chinese Journal of Veterinary Science, 18: 49-51.Luna, L.G., 1968. In Manual of histological staining methods of Armed Forces Institute ofPathology, 3 rd edn. Mc Graw Hill book Co. New YorkMir M.S., M.M. Darzi, A.A. Khan, N.A. Ganaie, S. Gupta, N. Nashiruddullah and S.A. Kamil,2005. Investigationof an outbreak of gout in Kashmir favorella poultry. Indian Journal ofVeterinary Pathology, 29(1): 35-37.Mubaraka, M. and A.A. Sharkawy, 1999. Toxopathology of gout induced in laying pullets bysodium bicarbonate toxicity. Environmental Toxicology and Pharmacology, 7(4): 227-236.National Research Council, 1994. Nutrient Requirements of Poultry. 8 th ed. Natl. Acad. Sci.,Washington.Nayak, N.C., T. Chakrabarti and A. Chakrabarti, 1988. An outbreak of gout in poultry in WestBengal. Indian Veterinary Journal, 65: 1080-1081.Rao, B.T., H.J. Das and R.D. Sharma, 1993. An outbreak of gout in East Godavari district,Andhra Pradesh. Poultry Advisor, 26: 43-45.Sonmez, G., 1992. Organ distribution and interrelationship of lesions in laying hens with goutand urolithiasis. Veteriner-Fakultesi-Dergisi, -Uludog -Universitesi, 11: 81-92.302
E-International Scientific Research JournalISSN: 2094-1749 Volume: 2 Issue: 4, 2010CONTRIBUTION OF SMOKE-BELCHING VEHICLESTO THE GREEN HOUSE GASES CONCENTRATIONIN THE CITY OF DIPOLOGBernard G. Gilaga 1 and Rowell B. Pallega 21 College of Criminology, JRMSU-Dipolog Campus, Dipolog City, ZDN2 College of Criminology, JRMSU- Main Campus, Dapitan City, ZDNAbstractAmong 212 nations in <strong>the</strong> world, <strong>the</strong> Philippines is ranked 48 th in terms of carbonemission in <strong>the</strong> transportation sector. The study sought to determine and estimate <strong>the</strong> amountof gaseous pollutants emitted by <strong>the</strong> vehicles in Dipolog City in relation to <strong>the</strong> overall gaseouspollutants of <strong>the</strong> Philippines. Results revealed an annual gaseous pollutant contribution of1,072929.597%V for carbon monoxide and 501,282,073.1 ppm for hydrocarbon emissionwhich, toge<strong>the</strong>r, roughly explain 6% of <strong>the</strong> country’s overall GHG (Green house gases) outputper year. Considering that <strong>the</strong>re are 122 cities in <strong>the</strong> Philippines, <strong>the</strong> 6% GHG contribution ofDipolog City is considered well beyond <strong>the</strong> normal threshold. The study also identified someof <strong>the</strong> factors leading to this inordinate amount of GHG output of <strong>the</strong> city, such as, but notlimited to: (a) strict implementation of <strong>the</strong> standards for vehicle emission levels prior torenewal of registration, and (b) strict monitoring and implementation of <strong>the</strong> anti-smokebelching law or <strong>the</strong> Clean Air Act (RA 8749).Keywords: emission, hydrocarbon, carbon monoxide, RA 8749, greenhouse gasesIntroductionThe Philippines is ranked 48th among <strong>the</strong> 212 carbon emitter nations from <strong>the</strong>transportation sector with an average of 68,328 metric tons of carbon emission annually. On<strong>the</strong> verge of escalating environmental crises brought by <strong>the</strong> GHG, countries worldwide throughinternational agreements such as, <strong>the</strong> UN Convention and <strong>the</strong> Kyoto Protocol, agreed to reduceGHG emissions all over <strong>the</strong> world. The Philippines is one of <strong>the</strong> countries which believes thatall countries can, and must, cooperate to address climate change through mitigation byadapting <strong>the</strong>se agreements. In response to <strong>the</strong> call to mitigate <strong>the</strong> effects of climate change,RA 8749, known as <strong>the</strong> Philippine Air Act was passed in 1999. The law requires emissiontesting for all cars registered annually. The law aimed to ensure substantial improvement in airquality for <strong>the</strong> health safety and welfare of <strong>the</strong> public and pursue a policy of balancingdevelopment and environmental protection. It also sets a maximum limits for all majorpollutants found in auto exhausts as follows: For light duty vehicles, <strong>the</strong> CO emission is 2.72303
E-International Scientific Research JournalISSN: 2094-1749 Volume: 2 Issue: 4, 2010g/km, 0.97g/km for HC & NO and o.14 g/km for PM for compression-ignition engines only.For heavy duty vehicles <strong>the</strong> exhaust emission limit are 4.5 g/k/Wh for CO, 1.1 g/k/Wh for HC,for NO x is 8 g/k/Wh and .36 g/k/Wh for PM is allowed. And in <strong>the</strong> case of 85 kW or lessengines, <strong>the</strong> limit value for particular emissions is increased by multiplying <strong>the</strong> quoted limit bya coefficient of 1.7. (RA 8749, 1999).The law fur<strong>the</strong>r provides that <strong>the</strong> fuel evaporatedemission for spark-ignition engines shall not exceed 2.0 gm hydrocarbons per test and it shallnot allow any emission of gases from crankcase ventilation system into <strong>the</strong> atmosp<strong>here</strong>.Dipolog City is a growing city in <strong>the</strong> south with a population of 131,016, growing at arate of 2.4% per annum. Vehicular traffic is becoming congested due to <strong>the</strong> increasing numbersof motor vehicles attendant to <strong>the</strong> needs of a fast growing urban city. Consequently, <strong>the</strong> city’sair quality over <strong>the</strong> years had been observed to deteriorate. T<strong>here</strong> is now an urgent need toascertain just how much <strong>the</strong> city’s vehicular traffic has contributed to air pollution and,subsequently ascertain compliance to <strong>the</strong> provisions of RA 8749.This work aimed to determine <strong>the</strong> average amount of gaseous pollutants emitted by <strong>the</strong>transportation sector in Dipolog City which can guide policymakers and environmentalists in<strong>the</strong>ir efforts to minimize emission of hazardous gases from motor vehicles.Research Method and DesignSecond information such as volume of traffic in <strong>the</strong> three entry points in Dipolog Cityand types of motor vehicle were ga<strong>the</strong>red from <strong>the</strong> department of Public Works and Highwayswhile emission test results were obtained from <strong>the</strong> Land Transportation Office. Date ga<strong>the</strong>redwere summarized as to <strong>the</strong> average volume of motor vehicles per day and motor vehicles werecategorized according to utilization and fuel used. Gasoline emission test results only includehydrocarbons (HC) in ppm and carbon monoxide (CO) in percent by volume (%/v) while fordiesel emission test was in terms of opacity. Opacity is <strong>the</strong> degree to which smoke blocks light.It is expressed as <strong>the</strong> absorption coefficient “k” (1/k). Average amount of HC, CO and opacityper vehicle type was calculated and used to estimate <strong>the</strong> average emission per day and per year.Motor Vehicles were classified as follows; motor tricycles (motorcycles and tricycles);passenger Car (multicab and o<strong>the</strong>r light public motor vehicles weighing › 1500kg.); passengerutility (public motor vehicles with <strong>the</strong> average weight ‹1500kg.), goods utility vehicles (thosevehicles that transport goods); small bus, large bus; rigid trucks 2 axles; rigid trucks 3+axles;truck semi-trailer 3 & 4 axles; truck semi trailers 5+ axels; and truck trailers 4 axels.ResultsTraffic Volume. As revealed in Table 1, motor-tricycles has <strong>the</strong> largest volume(1323.55 +144.94 motor-tricycles per day), followed by <strong>the</strong> passenger car(660.12+33.41passenger car/day) and public utility (254.86+30.77 public utility/day). Motortricycles,passenger cars, passenger utility and goods utility are known to use gasoline,although <strong>the</strong>re were also passenger cars, passenger utility and goods utility which used diesel.304
E-International Scientific Research JournalISSN: 2094-1749 Volume: 2 Issue: 4, 2010Table 1. Daily average number of motor vehicles running around Dipolog City.Types of Motor vehicle Daily Average of Motor Vehicle SDMotor-Tricycle 1323.547619 144.9392Passenger Car 660.1190476 33.40793Passenger Utility 254.8571429 30.76997Goods Utility 194.9761905 23.2282Small Bus 54.14285714 3.641871Large Bus 33.07142857 2.443542Rigid Trucks 2 axles 173.1428571 23.38792Rigid Trucks 3+ axles 34.64285714 11.53835Truck Semi-Trailer 3&4 axles 2.857142857 1`.064706Truck Semi-Trailer 5+ axles 0.119047619 0.125988Truck Trailers 4 axles 0 0Truck Trailers 5+ axles 0.023809524 0.062994Total 2731.5 242.7633Greenhouse Gases Emission of Gasoline and Diesel Powered Vehicles. Based on <strong>the</strong>emission test results (Table 2), <strong>the</strong> motor-tricycle (n= 45) which is a gasoline fueled vehiclehas <strong>the</strong> highest hydrocarbon emission, HC (844+707.61) and carbon monoxide (1.33+0.796).This is followed by passenger car (HC=262+139.5; CO=0.941+0.726), passenger utility car(HC =167.33+120.12, CO =0.391+0.484) and good utility car (HC=209.2+140.25 CO=0.656+0.688).For <strong>the</strong> diesel powered vehicles, opacity was <strong>the</strong> only parameter available. It refers to<strong>the</strong> degree to which smoke blocks light. It is expressed as <strong>the</strong> absorption coefficient “k” (1/m).Nowadays, opacity is <strong>the</strong> basis for measuring <strong>the</strong> amount of smoke coming from a dieselpoweredvehicle. It should be noted that an engine that smokes is emitting numerous toxiccompounds, particulate matter and oxides of nitrogen and sulfur that can adversely affectpublic health and <strong>the</strong> environment. As shown in Table 2, a passenger car has an opacitycoefficient, 1.201+0.462 k.305
E-International Scientific Research JournalISSN: 2094-1749 Volume: 2 Issue: 4, 2010Table 2 Average amount of green house gases emitted per vehicle type.Motor Vehicle TypeHC CO Opacity(ppm) % kA. GasolineMotor-Tricycle 844+707.61 1.33+0.796 -Passenger car (n=15) 262+139.5 0.941+0.726 -Passenger Utility 167.33+120.12 0.391+0.484 -Goods Utility 209.2+140.25 0.656+0.688 -B.DieselPassenger car - - 1.201+0.462Passenger Utility - - 0.68+0.376Goods Utility - - 1.093+0.368Small Bus - - -Large Bus - - -Rigid Trucks 2 axles - - 1.114+0.47Rigid Trucks 3+ axles - - 0.812+0.486Using <strong>the</strong> emission data obtained, <strong>the</strong> daily average amount of hydrocarbon, carbon monoxideand o<strong>the</strong>r greenhouse gases emitted per vehicle type were calculated. As shown in table 3, <strong>the</strong>motor-tricycle consistently has <strong>the</strong> greatest amount of hydrocarbon and carbon monoxideemission per day. With regard to <strong>the</strong> opacity measure, all diesel vehicles had values below <strong>the</strong>standard k = 2.5. Table 3 also presents <strong>the</strong> daily average and annual amount of CO and HCemitted by <strong>the</strong> motor vehicle in Dipolog City. The type of motor vehicle that contributes moreCO and HC is <strong>the</strong> Motor-Tricycle with <strong>the</strong> daily average gas contribution of 1760.318333 %Vand 1117074.19ppm, followed by <strong>the</strong> Public Cars and Public Utility. The total daily amount ofCO of <strong>the</strong> gasoline fueled vehicles in Dipolog City is 2939.533143% and <strong>the</strong> total HC is1373375.543 ppm.Table 3. Average annual amount of CO and HC emitted by <strong>the</strong> motor vehiclesTypesofMotorVehicleAverageof COAverageof HCAverageDailyVehicleTotalDailyAmount ofCOTotal DailyAmount ofHCEstimatedTotalAnnualAmount ofCOEstimatedTotalAnnualAmount ofHCMT 1.33 844 1323.55 1.76X10 10 1117074.19 6.42X10 12 407732079.5PC 1.201 262 660.12 1.24X10 10 172951.1905 4.54X10 12 63127184.52PU 0.68 167 254.86 5.8X10 9 42561.14286 1.88X10 12 15534817.14GU 1.093 209.2 194.98 8.68X10 9 40789.01905 3.17X10 12 14887991.95TOTAL 4.4X10 10 1373375.543 1.60X10 13 501282073.1306
E-International Scientific Research JournalISSN: 2094-1749 Volume: 2 Issue: 4, 2010DiscussionThe preponderance of motorized tricycles in <strong>the</strong> city of Dipolog contributes largely to<strong>the</strong> GHG noted. However, for a city of this size, motorized tricycles should have been limitedto small arterial roads with limited distance and should be banned from plying along main cityroads (RA 8749). A reduction in <strong>the</strong> number of motorized tricycles in <strong>the</strong> City of Dipolog cancontribute significantly to a reduced GHG emission for <strong>the</strong> city 1.76/4.6 =40% reduction.A comparison with <strong>the</strong> estimated value of carbon monoxide contributed or emitted by<strong>the</strong> motor vehicle in Dipolog City (1.60x10 13 ppb per year) showed that it is greater than <strong>the</strong>monthly tropospheric carbon monoxide reading by <strong>the</strong> NASA Terra Satellite (April 2010). Itshould be noted that <strong>the</strong> estimate was based on <strong>the</strong> actual results of car emission test, hence <strong>the</strong>greater values. Moreover, CO when released to <strong>the</strong> atmosp<strong>here</strong> is eventually oxidized tocarbon dioxide through natural processes and concentration is both short-lived in <strong>the</strong>atmosp<strong>here</strong> and spatially variable which explain <strong>the</strong> great difference between <strong>the</strong> annual CO inconcentration (actual emission test result) and tropospheric CO concentration. However, thisestimate can be grossly understated.Older vehicles tend to be less efficient than <strong>the</strong> newer ones. We conjecture that thiscould be one reason for <strong>the</strong> inordinate amount of gaseous pollutants noted in <strong>the</strong> city.However, when we tested for statistical significance of <strong>the</strong> difference between <strong>the</strong> COemissions of older and newer vehicles we found a minimal mean difference of 0.8026 resultingin a t-value of t=0.716 (p>.05). What this implies is that as per records, no statistical evidenceexists to show that older vehicles are less efficient than newer ones. However, this is certainlycontrary to scientific results, and so, we deduce that this is probably due to a serious underreporting of <strong>the</strong> carbon emissions for older vehicles (ei<strong>the</strong>r intentionally or nonintentionally).The City of Dipolog should be contributing less than 1% of <strong>the</strong> country’s GHG outputannually, but our results indicated that it is in fact contributing 600 times more (6%). Ofcourse, Metro Manila contributes 20% GHG but this can be easily explained by <strong>the</strong> shownvolume of traffic in this area. In Dipolog we established that <strong>the</strong> CO emissions are mainlyattributed to <strong>the</strong> motorized tricycles plying <strong>the</strong> city roads.Policy ImplicationsAnalysis of <strong>the</strong> fuel-burning emissions of vehicles in <strong>the</strong> City of Dipolog show that,under grossly understated data, <strong>the</strong> city contributes at least 6% of <strong>the</strong> country’s total emission.This can be considered high (and even higher if data were correctly stated by <strong>the</strong> testingcenters).These results have far-reaching implications on <strong>the</strong> implementation of RA 8749 or <strong>the</strong>Clean Air Act of 1997:The mechanism of implementation of RA 8749, particularly at <strong>the</strong> Emission TestingCenters to be reviewed and zealously guarded. In particular <strong>the</strong>re are implications to <strong>the</strong>accreditation process adopted by <strong>the</strong> LTO for <strong>the</strong>se testing centers.Since it has been established that older vehicles tend to be quite inefficient in terms ofcomplete combustion, <strong>the</strong>re is a need to define which vehicles should be allowed to register in307
E-International Scientific Research JournalISSN: 2094-1749 Volume: 2 Issue: 4, 2010<strong>the</strong> Philippines in mores advanced countries, for instance, vehicles that are more than five (5)years old are automatically phased out (Japan, Land Transport Ministry, 2005).Importation policies for vehicle surpluses should similarly be reviewed in particular,tax penalties for buying surplus vehicles can be set higher in order to discourage localconsumers from patronizing <strong>the</strong> products.ConclusionThe City of Dipolog contributes a significant portion to <strong>the</strong> country’s annual COemission, and inordinately so (>6%). Such a huge annual CO emission can be attributed to <strong>the</strong>main factors that obtain in <strong>the</strong> city: (a.) presence of fuel inefficient motorized tricycles whichconstitute <strong>the</strong> bulk of public transport in <strong>the</strong> city, and (b.) huge number of older vehicle typeswhich are also inefficient in burning fuel. Serious under reporting of <strong>the</strong> CO emissions of oldervehicle types lead to <strong>the</strong> conclusion that <strong>the</strong> implementation of RA 8749 or <strong>the</strong> Clean Air Actleaves much to be desired in <strong>the</strong> city.References;D. Ka<strong>the</strong>rine, et. al (2007). Organic & Biochem. 5 th Ed. Mc. Graw Hill.N. Y.Department of Transportation and Communication Land Transportation Office. DipologDistrict Office. Upper Turno,Dipolog CityIntergovernmental Panel on Climate Change (2006). Volume 2 Energy. National GreenhouseGas InventoriesKuzma, Jan W & Bohnenblust S. (2003). Basic Statistics for <strong>the</strong> Health Science 5 th ed. MCGraw-Phil Int’l Ed. SingaporeMorris H., et. al. (2005). General Organic & Biochemistry 8 th ed. John Wiley & Sons, Inc.Neilk Weaver (2002). Gasoline Toxicology. Implications for Human Health. The AmericanPetroleum Institute. Washington, DC.Philippine Clean Air Act of 1999 and Republic Act 8749Japan Land Transport Ministry (2005)308
E-International Scientific Research JournalISSN: 2094-1749 Volume: 2 Issue: 4, 2010ESTIMATION OF GREENHOUSE GAS (GHG)EMISSION LEVEL FROM WASTE AND GARBAGEDISPOSED IN THE COASTAL BARANGAYS OFDAPITAN CITY: IMPLICATIONS TO THEIR WASTEMANAGEMENT PRACTICESAbstractS. Campiseño and R. LaranjoJose Rizal Memorial State University – Main Campus, Dapitan CityJose Rizal Memorial State University – Main Campus, Dapitan CityWastes and garbage disposed of by <strong>the</strong> coastal barangays of Dapitan City wereanalyzed as to volume, composition and manner of disposal in order to estimate <strong>the</strong>approximate level of daily greenhouse gas (GHG) emissions using an international conversionfactor by <strong>the</strong> International Panel on Climate Change (IPCC) conversion manual. The wastemanagement practices of <strong>the</strong> barangays were likewise determined since <strong>the</strong>se determine to alarge extent <strong>the</strong> volume of GHG emitted through household wastes. Results revealed thatroughly 43.8 kilo-tons of CO2, 2.52 kilo-tons of methane and .515 kilo-tons of nitreous oxideper year are derived from <strong>the</strong> household wastes alone owing to <strong>the</strong>ir poor waste managementpractices. If open burning and o<strong>the</strong>r improper waste disposal practices were strictly prohibitedand violators apprehended, <strong>the</strong> greenhouse gas emissions can be reduced by as much as 50%of <strong>the</strong>ir current levels.Keywords: biomass conversion factor, greenhouse gas, waste managementIntroductionMuch of <strong>the</strong> accumulation of greenhouse gases in <strong>the</strong> atmosp<strong>here</strong> can be attributed to<strong>the</strong> activities of man: from <strong>the</strong> mundane household wastes to <strong>the</strong> wastes generated by largeindustrial plants. The manner in which <strong>the</strong>se wastes are disposed of also determine <strong>the</strong> amountof harmful gases, notably carbon dioxide and methane, that <strong>the</strong>se wastes give off. Opendumping and burning are two(2) of <strong>the</strong> more seriously damaging manner of waste disposal thatgreatly contribute to rise in global temperature (IPCC, 2009).The lack of environmentally friendly, sustainable and affordable waste managementhas led to open dumping and open burning of solid wastes in many parts of <strong>the</strong> world. Opendumping encourages scavenging for recyclable materials that pose real health hazards to <strong>the</strong>community. On <strong>the</strong> o<strong>the</strong>r hand, open burning results in particulate matters or black carbon in<strong>the</strong> higher altitudes of <strong>the</strong> earth , w<strong>here</strong> ice is common, resulting in greater absorption of <strong>the</strong>sun’s energy thus trapping heat in <strong>the</strong> earth’s atmosp<strong>here</strong>. Global warming results from <strong>the</strong>excess heat trapped in <strong>the</strong>se areas causing ice to melt and consequently, producing variouskinds of aberrant wea<strong>the</strong>r patterns.309
E-International Scientific Research JournalISSN: 2094-1749 Volume: 2 Issue: 4, 2010In Dapitan City, solid wastes are regularly collected by a garbage truck and dumped inan open landfill in a remote barangay of <strong>the</strong> City. However, many residences and severalcommercial establishments still practice open dumping and open burning (right in <strong>the</strong>irbackyards). Around 10% of homes have nei<strong>the</strong>r toilet facilities nor sewage treatment. Somehave concentrations of septic tanks or cesspools that leak large amounts of wastes into <strong>the</strong>shallow waters of Liboran and Dapitan Rivers. Both rivers drain into Dapitan Bay w<strong>here</strong> liquidand solid wastes from residences, fishponds and agricultural lands are spilled. The Pulauanwharf poses yet ano<strong>the</strong>r source of wastes from both <strong>the</strong> inhabitants and <strong>the</strong> casual travellersand tourists.The present study attempts to determine <strong>the</strong> volume of solid and liquid wastes producedby residents of coastal barangays in Dapitan City on a daily basis and assess <strong>the</strong>ir wastemanagement practices. An analytic procedure of factor conversion (from waste biomass to oneof <strong>the</strong> harmful GHG) is adopted from <strong>the</strong> IPCC (2006) conversion manual in order todetermine how much GHG is actually produced by <strong>the</strong> residents sans good waste managementprograms. Ultimately, it is hoped that once <strong>the</strong> residents realize <strong>the</strong> magnitude of harm that anun-managed waste disposal system can result on <strong>the</strong> earth’s climate, <strong>the</strong>y will voluntarilyfollow <strong>the</strong> waste disposal ordinance of <strong>the</strong> City of Dapitan.Research Method and DesignThe study followed <strong>the</strong> descriptive-analytical procedure in obtaining and analyzing <strong>the</strong>information necessary to achieve <strong>the</strong> purported objectives:Research Locale. The study was conducted in Dapitan Bay particularly on <strong>the</strong>northwestern stretch of nine(9) barangays: Bucana, Sicayab, Canlucani, Poblacion, Polo, SanPedro, San Vicente, Taguilon, and Tag-ulo (map shown). It is noted that <strong>the</strong>re are existinglocal ordinances for waste management in <strong>the</strong>se nine barangays.Waste Identification and Analysis. The nine (9) barangays have a total of 880households of which 275 households were randomly chosen (roughly 31% of <strong>the</strong> total numberof households). The waste disposal practices of <strong>the</strong> households chosen for <strong>the</strong> study are shownin Table 1:Table 1: Waste Management Practices of Sample HouseholdsWaste Disposal Practice Number PercentageLittering 50 18.18Open Dumping 60 21.82Open Burning 70 25.45Composting 10 0.01Landfilling/Collection 50 18.18Recycling/Re using/Segregation 25 9.09Selling 20 7.27Total 275 100%310
E-International Scientific Research JournalISSN: 2094-1749 Volume: 2 Issue: 4, 2010These information will be important when we apply <strong>the</strong> IPCC-approved conversionfactors for biomass to GHG outputs. Meanwhile, it is important to note that only 18.18% of <strong>the</strong>households actually follow <strong>the</strong> Ordinance for Waste Management (Collection and Landfilling)with waste segregation policy (9.09%) for a total of 27.27% law-abiding households in <strong>the</strong>study (less than one third of <strong>the</strong> households follow <strong>the</strong> law on waste management).IPCC-Approved Conversion Factors.The IPCC approved in 2006 <strong>the</strong> following conversion factors for converting wastebiomass to approximate greenhouse gas output:Table 2: Biomass Conversion Factors for Household WastesSource Description CO2Outputg/kgWood/Paper/Yard Combustion 950Trimmings/Textiles Non-Combustion 570Biodegradables/Common Combustion 900TrashNon-Combustion 540Plastics/Styrofoams/ Combustion 200RubberNon-Combustion 0Aluminum/Steel/Tin/ Combustion NACopper/Cans/Bottles Non-Combustion NABatteries/Old Machines Combustion NANon-Combustion NASource: Canadian National Inventory Report, 2006 as Approved by IPCCMethaneg/kg.05.08.10.175000NANANANANitreous Oxideg/kg.02.03.08.131000NANANANAThe wastes generated by <strong>the</strong> households were identified by volume and by type dailyfor seven days. The average of each type of waste material was <strong>the</strong>n obtained. The volume ofwaste (by type) was <strong>the</strong>n converted into <strong>the</strong> corresponding GHG using <strong>the</strong> conversion factorsabove. A typical example is illustrated below for clarity:Type of waste: Wood/Paper/Yard Trimmings/TextilesMean Volume Per Day : 38 kgsEquivalent GHG Output by Burning (Combustion):CO2 = 36100 gms (36.1 kg), Methane = .76 gm, Nitreous Oxide = .76 gm(Using Conversion Factors Above)Contingency Analysis. The GHG outputs were <strong>the</strong>n fur<strong>the</strong>r analyzed by looking into<strong>the</strong> typical waste disposal practice of each barangay and <strong>the</strong>ir corresponding GHG outputs(low/high) in order to assess how <strong>the</strong> GHG outputs relate with <strong>the</strong> corresponding wastedisposal practices of <strong>the</strong> barangays. That is, we wanted to know <strong>the</strong> extent to which <strong>the</strong> wastedisposal practice influenced <strong>the</strong> harmful gas emissions of <strong>the</strong> barangays. The analysis was donethrough a simple chi-square test.311
E-International Scientific Research JournalISSN: 2094-1749 Volume: 2 Issue: 4, 2010ResultsTable 3 shows <strong>the</strong> mean volume of wastes produced by <strong>the</strong> barangays over a seven-dayobservation period classified by type and by disposal method. Note that <strong>the</strong>re were someuncertainties noted as to <strong>the</strong> responses of <strong>the</strong> key informants with respect to <strong>the</strong> waste disposalpractices. The researchers triangulated <strong>the</strong> responses by asking at least two o<strong>the</strong>r members of<strong>the</strong> households (independently of <strong>the</strong> main informant). If two of <strong>the</strong> three informants agreed on<strong>the</strong> manner in which <strong>the</strong>ir garbage are disposed, <strong>the</strong>n that particular waste disposal practice isnoted in <strong>the</strong> table below. The two o<strong>the</strong>r members of <strong>the</strong> household interviewed were those whowere less likely to lie (i.e. no motive to lie).Table 3: Volume of Wastes by Type of WastesSource Description MeanVolumePer DayWood/Paper/YardTrimmings/TextilesBiodegradables/Common TrashCombustionNon-CombustionCombustionNon-Combustion20185083StandardError of<strong>the</strong> Mean3.502.005.252.50RemarksUncertainties inresponses maybe present-Plastics/Styrofoams/RubberCombustionNon-Combustion5331.254.50-Aluminum/Steel/Tin/Copper/Cans/BottlesCombustionNon-Combustion03806.70 -Batteries/Old Machines Combustion 10 2.50 -Non-CombustionTable 4 shows <strong>the</strong> net GHG output based on <strong>the</strong> average daily output of each type ofwaste and each type of waste disposal (combustion and non-combustion):Table 4: Total GHG Ouput Per Type of Waste/GarbageWaste CO 2GramsMethaneGramsNitreousoxideGramsWood/Paper/Yard Trimmings/Textiles 29260 2.44 0.94Biodegradables/Common Trash 89820 19.11 14.79Plastics/Styrofoams/Rubber 1000 2500 500Aluminum/Steel/Tin/Copper/Cans/Bottles 0 0 0Batteries/Old Machines 0 0 0TOTAL 120080 2521.55 515.73312
E-International Scientific Research JournalISSN: 2094-1749 Volume: 2 Issue: 4, 2010DiscussionsThe average daily GHG emissions from <strong>the</strong> barangays show an output of about 120 kgof CO2, 2.52 kg of methane and 0.515 kg of nitreous oxide per day. Over a regular one-yearperiod <strong>the</strong>se translate to : 43.80 kilo-tons of CO2, 0.92 kilo-ton of methane and 0.20 kilo-ton ofnitreous oxide just for <strong>the</strong> nine barangays of Dapitan City. We can extrapolate on <strong>the</strong> figures ifwe consider <strong>the</strong> entire city and its designated landfill area. The figures could easily inflate by afactor of 10 i.e. roughly 438 kilo-tons of CO2, 25.2 kilo-tons of methane and 5.15 kilo-tons ofnitreous oxide. With <strong>the</strong> growing population of <strong>the</strong> City (estimated at roughly 2.6% perannum), <strong>the</strong> corresponding volume of garbage and wastes will double within <strong>the</strong> next 15 yearsand, hence, so will <strong>the</strong> emission of harmful GH gases into <strong>the</strong> atmosp<strong>here</strong>.However, much of this volume of GH gases can be attributed to <strong>the</strong> poor wastemanagement practices of <strong>the</strong> households in <strong>the</strong> barangays. For instance, if open burning isstrictly prohibited, <strong>the</strong> average daily GH emissions can be reduced by as much as 25% andwith o<strong>the</strong>r mitigating practices such as closed composting and waste segregation, <strong>the</strong> GHemissions can be fur<strong>the</strong>r reduced to 50% of its current levels. Stricter implementation ofordinances and laws governing waste management and disposal needs to be observed if <strong>the</strong>situation is to be arrested within <strong>the</strong> next few years.One possible reason for <strong>the</strong> ra<strong>the</strong>r loose implementation and ad<strong>here</strong>nce of people toproper waste management ordinances is <strong>the</strong>ir lack of understanding and appreciation of <strong>the</strong>selaws. For instance, <strong>the</strong> harmful gases emitted from ei<strong>the</strong>r natural process or by burning <strong>the</strong>wastes are not seen as harmful by <strong>the</strong> ordinary citizen. In fact, in <strong>the</strong> old belief and tradition,burning of such wastes is considered a good practice for driving away mosquitoes. Drivingaway harmful mosquitoes for <strong>the</strong>m is a far more urgent matter than lessening <strong>the</strong> release ofharmful greenhouse gases into <strong>the</strong> atmosp<strong>here</strong>. The issue really boils down to satisfying apresent need (protecting ones health) versus mitigating a slow, gradual and largely unnoticedclimate change. For this reason, an effective educational intervention program will have to becrafted simultaneously focusing on (a.) addressing <strong>the</strong>ir health concerns such as driving awaymosquitoes and bugs, and (b.) <strong>the</strong> harmful effects of greenhouse gases to <strong>the</strong> ozone layer. If<strong>the</strong>se issues are clarified and well-understood by <strong>the</strong> citizens of <strong>the</strong> City, <strong>the</strong>n compliance to<strong>the</strong> waste management ordinances will be greatly enhanced.The greenhouse gas contribution of open dumping of iron, steel, old machines andbatteries could not be quantified in <strong>the</strong> present study since no conversion factors are availablein <strong>the</strong> literature. However, we suspect that <strong>the</strong>se waste materials deteriorate over time throughnatural processes and also give off a significant amount of harmful greenhouse gases in <strong>the</strong>atmosp<strong>here</strong> knowing that iron and o<strong>the</strong>r such metals react with free oxygen and nitrogen in <strong>the</strong>atmosp<strong>here</strong>. This, of course, will be a matter for <strong>the</strong> chemists and environmentalists to dealwith in future studies. We none<strong>the</strong>less wish to stress <strong>the</strong> urgency of such a quantificationprocedure since more and more of this type of waste products are being produced at <strong>the</strong>household level e.g. discarded cellular phones, radio batteries, and o<strong>the</strong>rs.Finally, more than 95% of <strong>the</strong> greenhouse gas emissions from <strong>the</strong> household wastes iscarbon dioxide (CO2). This gas is naturally needed by plants for <strong>the</strong>ir photosyn<strong>the</strong>tic processeswith oxygen as a by-product. Thus, if more plants and trees were planted in <strong>the</strong> backyards of<strong>the</strong>se households, <strong>the</strong>n <strong>the</strong> amount of CO2 directly released to <strong>the</strong> atmosp<strong>here</strong> could be fur<strong>the</strong>rreduced. Perhaps, this can be implemented as part of <strong>the</strong> waste management protocols that willbe crafted by <strong>the</strong> City Officials.313
E-International Scientific Research JournalISSN: 2094-1749 Volume: 2 Issue: 4, 2010In <strong>the</strong> end, reducing <strong>the</strong> greenhouse gas emissions from household wastes boils downto <strong>the</strong> design and strict implementation of a city waste management program.ConclusionsHousehold wastes and garbage when improperly disposed of contribute a significantamount of harmful greenhouse gases to <strong>the</strong> atmosp<strong>here</strong>. The amount of GHG can be drasticallyreduced (by at least 50%) if proper waste management programs are implemented by <strong>the</strong> City.Likewise, since we found that over 95% of <strong>the</strong> greenhouse gas emissions from <strong>the</strong> householdwastes and garbage is carbon dioxide (CO2), planting of trees in <strong>the</strong> backyards of <strong>the</strong>sehouseholds can help in drastically reducing <strong>the</strong> free CO2 directly released to <strong>the</strong> atmosp<strong>here</strong> by<strong>the</strong>ir current practices. Proper implementation of waste management programs also implies that<strong>the</strong> citizens be properly educated about <strong>the</strong> value of good waste disposal practices as <strong>the</strong>serelate to <strong>the</strong> mitigation efforts to combat climate change and also, to safeguard <strong>the</strong> health of <strong>the</strong>people in <strong>the</strong> community.AcknowledgmentThe authors wish to thank Dr. Roberto N. Padua for <strong>the</strong> expert advice on <strong>the</strong>quantification aspect of this study and an anonymous referee for <strong>the</strong> helpful suggestions toimprove this paper.ReferencesCicin-Sain, Biliana, et al. (2002). “A Guide to Oceans, Coasts and Islands at <strong>the</strong> World Summiton Sustainable Development”Congress of <strong>the</strong> Philippines, Republic Act no. 9003: Ecological Solid Waste Management Actof 2000. Manila: January 26, 2001.Jaques A. 1992. Canada’s Greenhouse Gas Emissions: Estimates for 1990. EnvironmentalProtection, Conservation and Protection, Environment Canada. December. EPS 5/AP/4.Ramos, R.P. (2003). “Waste Management in Developing Countries: A Case Study of <strong>the</strong> Toxicand Hazardous Waste in <strong>the</strong> Philippines “ (Paper Presented and Published in <strong>the</strong>Environmental Research Event (EERE) Conference, Mowlaei, Rose and Lamborn (eds.).SGA Energy (2000). Emission Factors and Uncertainties for CH 4 and N 2 O from FuelCombustion. Unpublished report prepared by SGA Energy Limited for <strong>the</strong> Greenhouse GasDivision, Environment Canada. August.U.S. Environmental Protection Agency (1998). Guidance for Landfilling Wastes inEconomically Developing Countries. Office of Research and Development, Washington D.C.,EPA-600/R-98-040.United States Environmental Protection Agency. 1996. Compilation of Air Pollutant EmissionFactors. Vol. I, Stationary Point and Area Sources, AP 42, 5th Edition,National Inventory Report (1990-2007): Greenhouse Gas Sources and Sinks in Canada.Emission ratio for N 2 O is 0.017% CO 2 . Section A3.4 in Annex 3.314
E-International Scientific Research JournalISSN: 2094-1749 Volume: 2 Issue: 4, 2010INDUCED FORCES IN POLYMER BLENDSVERSUS TEMPERATURES. El Fassi, M. Benhamou, H. Ridouane, M. El YaznasniPolymer Physics and Critical Phenomena LaboratorySciences Faculty Ben M’sik, P.O. Box 7955, Casablanca, MoroccoAbstractWe re-examine <strong>the</strong> computation of <strong>the</strong> induced force experienced by colloidal p<strong>article</strong>simmersed in a binary mixture, made of two chemically incompatible polymers of highmolecular-weight.Such a force originates from <strong>the</strong> strong fluctuations of composition near <strong>the</strong>critical temperatureT c, and <strong>the</strong> fact that one polymer of <strong>the</strong> mixture prefers to be attracted bycolloids (critical adsorption). More precisely, we aim at a quantitative investigation of <strong>the</strong>temperature effect on <strong>the</strong> force expression, when one is far fromT c. To achieve calculations,we use <strong>the</strong> standard4ϕ -<strong>the</strong>ory, w<strong>here</strong> <strong>the</strong> field ϕ represents <strong>the</strong> composition fluctuation(order parameter). Combining this <strong>the</strong>ory with <strong>the</strong> standard cumulant method, we first findthat <strong>the</strong> effective pair-potential is <strong>the</strong> sum of two contributions, which are directly proportionalto <strong>the</strong> bulk two-point correlation functions constructed with fields ϕ and2ϕ , respectively.Second, taking advantage of <strong>the</strong> exactly known (mean-field) correlation functions, wedemonstrate that <strong>the</strong> expected force can be expressed in term of <strong>the</strong> modified Bessel functionsK 1 (z) and K 2 (z). Third, we show that <strong>the</strong> reduced induced force, D F(r) / kB T , is auniversal two-factor scaling function of <strong>the</strong> dimensionless variablesr / D andξ/ D, w<strong>here</strong> r is<strong>the</strong> inter p<strong>article</strong>-distance, ξ is <strong>the</strong> <strong>the</strong>rmal correlation length of <strong>the</strong> free polymer mixture andD is <strong>the</strong> scale-distanceD = d0N , w<strong>here</strong> d0is <strong>the</strong> p<strong>article</strong>s diameter and N <strong>the</strong>polymerization degree of chains. The essential conclusion is that, for high or low temperatures,<strong>the</strong> induced force becomes less important than that at <strong>the</strong> critical one.Keywords: Polymer blends, Colloids, Phase separation, Induced force, Temperature effects.IntroductionThe induced force generated by fluctuations of some physical entity is one of <strong>the</strong> mostfundamental discoveries of <strong>the</strong> last century. Already in 1948, Casimir predicted <strong>the</strong> attraction315
E-International Scientific Research JournalISSN: 2094-1749 Volume: 2 Issue: 4, 2010between two parallel perfectly conducting plates at zero temperature [1]. This attractionoriginates from <strong>the</strong> vacuum quantum fluctuations of <strong>the</strong> electromagnetic field confinedbetween <strong>the</strong>se plates. From an experimental point of view, <strong>the</strong> electromagnetic induced forcehas been measured between metal surfaces in a series of recent experiments [2-5].The same effect also appears in o<strong>the</strong>r areas of physics. Indeed, in <strong>the</strong>ir short <strong>the</strong>oreticalnote, Fisher and de Gennes [6] pointed out that a similar effect can be present in <strong>the</strong> context ofStatistical Mechanics and Condensed Matter Physics. More precisely, this effect is in<strong>here</strong>nt tothose critical systems, such as a fluid near <strong>the</strong> liquid-gas critical point, a binary liquid (or apolymer mixture) near <strong>the</strong> demixing temperature, a liquid 4 He near <strong>the</strong> λ -transition or liquidcrystals.For <strong>the</strong>se systems, <strong>the</strong> critical fluctuations of <strong>the</strong> order parameter play an analoguerole than <strong>the</strong> vacuum quantum fluctuations, and <strong>the</strong>n give rise to long-ranged forces between<strong>the</strong> confining walls.Theoretically, <strong>the</strong> induced forces related to critical systems confined between twoparallel walls or in <strong>the</strong> presence of immersed colloidal p<strong>article</strong>s, have been <strong>the</strong> subject of agreat deal of attention [6-23]. Very recently, one has also investigated <strong>the</strong> Casimir effect incritical polymer blends or ternary polymer solutions [24-28].Experimentally, several works have been devoted to <strong>the</strong> confined critical systems [29-37]. For instance, one has studied, in some experiments [29-33], <strong>the</strong> behaviour of silica beadsof diameter of <strong>the</strong> order of 0.1m immersed in binary liquid mixtures of lutidine and water.The experiments revealed that, in <strong>the</strong> vicinity of <strong>the</strong> consolute point of <strong>the</strong> free binary liquid,one assists to a reversible flocculation of colloids in <strong>the</strong> water-rich side. In fact, thisaggregation is due to a preferential adsorption of lutidine on <strong>the</strong> surface of colloids.In this paper, we consider a low density assembly of spherical colloids, which areimmersed in a mixture of two polymers A and B of different chemical nature, at a temperaturenot necessary close to <strong>the</strong> critical oneT c . We suppose that, nearT c , <strong>the</strong> colloids adsorbpreferentially <strong>the</strong> polymer chains A as in liquid mixtures of small molecules case. As aconsequence, this preferential adsorption leads to a reversible aggregation of p<strong>article</strong>s in <strong>the</strong>non-preferred B-rich phase. This flocculation results from a long-range induced force we areinterested in. Naturally, <strong>the</strong> latter depends on <strong>the</strong> interp<strong>article</strong>-distance, <strong>the</strong> temperature and <strong>the</strong>bulk and surface universality classes. We restrict ourselves <strong>here</strong> to <strong>the</strong> surface universalityclass that corresponds to <strong>the</strong> situation of high chemical potential exchange on <strong>the</strong> surface of <strong>the</strong>316
E-International Scientific Research JournalISSN: 2094-1749 Volume: 2 Issue: 4, 2010interacting colloids. This special class is attributed to <strong>the</strong> so-called normal transition [38,39].More precisely, <strong>the</strong> purpose is <strong>the</strong> determination of <strong>the</strong> variation of <strong>the</strong> induced force betweencolloids upon distance, when one is far from <strong>the</strong> critical temperature. The computation of thisforce at <strong>the</strong> critical point has been <strong>the</strong> subject of some previous work [27]. Thus, we areinterested in how temperature can affect <strong>the</strong> value of <strong>the</strong> expected force. Manifestly, <strong>the</strong> latteris increasingly weak as one goes far fromT c . As a matter of fact, this is due to a considerablereduction of <strong>the</strong> critical fluctuations of <strong>the</strong> order parameter away from <strong>the</strong> critical point.To achieve <strong>the</strong> determination of <strong>the</strong> spatial variation of <strong>the</strong> induced force, use is madeof a field-<strong>the</strong>oretical approach based on <strong>the</strong> standard4ϕ -<strong>the</strong>ory [40,41], w<strong>here</strong> <strong>the</strong> fieldϕ accounts for <strong>the</strong> composition fluctuation (order parameter). With <strong>the</strong> help of <strong>the</strong> standardcumulant method [40,41], we first compute <strong>the</strong> resulting pair-potential from which we extract<strong>the</strong> induced force. Exact calculations reveal that <strong>the</strong> force can be expressed in term of <strong>the</strong>modified Bessel function K ν (z)[42]. In addition, when it is correctly reduced and itsvariables are suitably rescaled, <strong>the</strong> force expression shows a universal character, independentlyon <strong>the</strong> chemical nature of <strong>the</strong> two polymers and colloids.This paper is organized as follows. In <strong>the</strong> second section, we present <strong>the</strong> field modelenabling us to compute <strong>the</strong> induced force. The determination of <strong>the</strong> latter is <strong>the</strong> aim of <strong>the</strong> thirdsection. Finally, we draw some concluding remarks in <strong>the</strong> last section.Field ModelWe start with M spherical colloidal p<strong>article</strong>s immersed in a binary mixture made of twochemically incompatible polymers A and B. For simplicity, <strong>the</strong>se p<strong>article</strong>s are assumed to beidentical from a physical and geometrical point of view. We will denote by R <strong>the</strong>ir commonradius. We suppose that, near <strong>the</strong> consolute temperatureTcof <strong>the</strong> host mixture, <strong>the</strong>se p<strong>article</strong>shave tendency to attract ra<strong>the</strong>r <strong>the</strong> polymer A. This is <strong>the</strong> so-called critical adsorption[6,38,39,43-53], w<strong>here</strong> each colloid is clo<strong>the</strong>d by a layer made of monomers A. As result, <strong>the</strong>p<strong>article</strong>s located in <strong>the</strong> non-preferred B-rich phase aggregate. T<strong>here</strong>fore, <strong>the</strong>se experience along-range attractive force, which is responsible for <strong>the</strong>ir aggregation.The flocculation phenomenon can be studied through <strong>the</strong> introduction of an orderparameter or composition fluctuation. The latter is nothing else but <strong>the</strong> difference ofcompositions and of <strong>the</strong> two polymers, that is .The order parameter317
E-International Scientific Research JournalISSN: 2094-1749 Volume: 2 Issue: 4, 2010is a scalar field depending on <strong>the</strong> position vectormixture in <strong>the</strong> presence of colloids.The Hamiltonian governing <strong>the</strong> system is given byof <strong>the</strong> representative point of <strong>the</strong>W<strong>here</strong> T is <strong>the</strong> absolute temperature and <strong>the</strong> Boltzmann's constant. The first term in <strong>the</strong>right-hand side of <strong>the</strong> above equality accounts for <strong>the</strong> (reduced) bulk Hamiltonian of <strong>the</strong> hostmixture [54]w<strong>here</strong> d is <strong>the</strong> space dimensionality andrepresents <strong>the</strong> distance from <strong>the</strong>critical point. Here, denotes <strong>the</strong> Flory interaction parameter [54,55], which is inverselyproportional to temperature, and is its critical value. T<strong>here</strong>, is <strong>the</strong>coupling constant, w<strong>here</strong> N is <strong>the</strong> common polymerization degree of chains, andisa constant (a being <strong>the</strong> monomer size). The first two terms in <strong>the</strong> right-hand side of formula(1a) are just <strong>the</strong> expansion to fourth order of <strong>the</strong> standard Flory-Huggins (FH) free energy[54,55] around <strong>the</strong> critical composition, or equivalently around . T<strong>here</strong>,are <strong>the</strong> values of field on <strong>the</strong> surfaces of colloids. The quantity accounts for<strong>the</strong> elementary surface on colloid i, c stands for <strong>the</strong> surface coupling constant [38,39,56],which measures <strong>the</strong> interaction strength between polymer mixture and surfaces of colloids, andfor <strong>the</strong> (reduced) surface chemical potentials difference of <strong>the</strong> two polymers[6]. In fact, and play <strong>the</strong> role of <strong>the</strong> local magnetization and surface magnetic field in <strong>the</strong>context of magnetic materials in <strong>the</strong> presence of surfaces [38,39,56].It is easy to see that <strong>the</strong> order parameter satisfies <strong>the</strong> boundary conditions318
E-International Scientific Research JournalISSN: 2094-1749 Volume: 2 Issue: 4, 2010w<strong>here</strong> <strong>the</strong> notation means <strong>the</strong> normal derivative of field on <strong>the</strong> surface of colloid i.For small enough p<strong>article</strong>s, <strong>the</strong> Hamiltonian governing <strong>the</strong> system reduces toThis total Hamiltonian <strong>the</strong>n describes a critical binary polymer mixture in <strong>the</strong> presence of Mcolloids (boundaries). T<strong>here</strong>fore, <strong>the</strong> interactions between polymer mixture and colloidsdepend only on two surface microscopic parameters . We emphasize that <strong>the</strong> quadraticsurface term, in Eq. (2), tends to increase <strong>the</strong> temperature parameter t appearing in <strong>the</strong> bulkHamiltonian, relation (1a). This means that such a term reduces <strong>the</strong> chemical interactions in <strong>the</strong>host system. The surface linear term that breaks <strong>the</strong> symmetry is introduced in orderto take into account <strong>the</strong> preference of colloidal p<strong>article</strong>s for one polymer of <strong>the</strong> mixture. Thecritical adsorption emerges in <strong>the</strong> limit , at fixed [ 38,39].Fur<strong>the</strong>rmore, it was shown [27] that <strong>the</strong> scale-invariance leads to some relationsbetween <strong>the</strong> surface microscopic parameters and <strong>the</strong> amplitudes of composition profilesand bulk two-point correlation functions of <strong>the</strong> free mixture, constructed with <strong>the</strong> fieldcomposite operator. More precisely, it was found [27] thator <strong>the</strong>and represent <strong>the</strong> amplitudes of <strong>the</strong> mean-values of fields and relative to onesp<strong>here</strong> of radius R that is immersed in a polymer blend [27], that is319
E-International Scientific Research JournalISSN: 2094-1749 Volume: 2 Issue: 4, 2010Here, r denotes <strong>the</strong> distance from <strong>the</strong> centre of <strong>the</strong> sp<strong>here</strong>. In <strong>the</strong>se relations, and are <strong>the</strong>scaling dimensions of fields and(5)With <strong>the</strong> space dimension d, and and are <strong>the</strong> standard critical exponents of Ising-likemagnetic systems [40,41]. Using an adequate special conformal transformation, it was found[18,19] that <strong>the</strong> profiles relative to <strong>the</strong> one-sp<strong>here</strong> problem may be related to those in a halfspacebyw<strong>here</strong> z is <strong>the</strong> perpendicular distance, and and are those amplitudes appearing in Eqs.(4a) and (4b). This means that, for <strong>the</strong> determination of <strong>the</strong> value of <strong>the</strong>se amplitudes, it will besufficient to consider a polymer mixture occupying a semi-infinite space limited by a planesurface. On <strong>the</strong> o<strong>the</strong>r hand, and are <strong>the</strong> amplitudes, at small-distances compared to <strong>the</strong>bulk correlation length ξ, of <strong>the</strong> (connected) two-point correlation functions,(The subscripts b is for bulk and c for connected).We recall that, as demonstrated by de Gennes [54,57], <strong>the</strong> polymer mixtures can becorrectly described using mean-field <strong>the</strong>ory. This is true only for those polymer mixtures ofhigh-molecular-weight. Indeed, <strong>the</strong> critical region around <strong>the</strong> critical point, w<strong>here</strong> a non-320
E-International Scientific Research JournalISSN: 2094-1749 Volume: 2 Issue: 4, 2010classical behaviour is expected, is very narrow (of <strong>the</strong> order of, so-that <strong>the</strong> mean-field<strong>the</strong>ory can be applied. T<strong>here</strong>fore, close to, one observes trivial critical exponents, and inparticular,. The critical behaviour of a free binary polymer mixture emerges in<strong>the</strong> limit (4 being <strong>the</strong> critical dimension of <strong>the</strong> system), and <strong>the</strong>n, and. By a simple map between <strong>the</strong> sp<strong>here</strong> and a semi-infinite space, we obtainFor <strong>the</strong> remaining amplitudes, we simply sketch <strong>the</strong> resultsTo derive <strong>the</strong> second relation in Eq. (9), we have used <strong>the</strong> Wick <strong>the</strong>orem [40,41].Combining relations (3), (8) and (9), we find <strong>the</strong> desired expressionsThese relations show <strong>the</strong> explicit dependence of <strong>the</strong> surface microscopic parameters uponcolloids geometry, via <strong>the</strong>ir radius R, and chains characteristics, through <strong>the</strong> monomer size aand <strong>the</strong> polymerization degree N.We finish this section by <strong>the</strong> following useful remark. When one is concerned withphenomena occurring at low temperature , <strong>the</strong> field must be naturally written asw<strong>here</strong> <strong>the</strong> new field is <strong>the</strong> fluctuation of <strong>the</strong> order parameter around its bulk value321
E-International Scientific Research JournalISSN: 2094-1749 Volume: 2 Issue: 4, 2010which is <strong>the</strong> minimum of <strong>the</strong> standard FH free energy. Now, insert <strong>the</strong> decomposition (11) in<strong>the</strong> total Hamiltonian, relations (1a) and (2), and expand it to second order around , togetWith <strong>the</strong> new bulk Hamiltonianwhich is quadratic in <strong>the</strong> field . The parameters and areExplicitly, we havew<strong>here</strong> c and µ are those surface parameters defined in Eq. (10). The signs (+) and (-) are forhigh and low temperatures, respectively.The following step consists in <strong>the</strong> computation of <strong>the</strong> induced force away from <strong>the</strong>critical point. To this end, use will be made of <strong>the</strong> new Hamiltonian, relations (12) and (13).322
E-International Scientific Research JournalISSN: 2094-1749 Volume: 2 Issue: 4, 2010Induced ForcesAs we said in <strong>the</strong> beginning, <strong>the</strong> critical fluctuations of <strong>the</strong> order parameter give rise to aninduced force, which is attractive and of long-range. The determination of <strong>the</strong> distance decayof such a force will be achieved through <strong>the</strong> knowledge of <strong>the</strong> pair-potential, denoted, .Here, r is <strong>the</strong> center-to-center distance of two interacting p<strong>article</strong>s. Formally, and takingadvantage of <strong>the</strong> standard cumulant method [40,41], we show that <strong>the</strong> p-bodyinteractionenergy,, is directly proportional to <strong>the</strong> connected p-point correlation function,which is constructed with <strong>the</strong> field operatorNotice that for p = 1, <strong>the</strong> one-body potentialspatial translation symmetry. For p = 2, we get <strong>the</strong> pair-potentialis space-independent due to <strong>the</strong>Explicitly, we havew<strong>here</strong>andare <strong>the</strong> connected two-point correlation functions of fields ψand, respectively. These functions are constructed with <strong>the</strong> Boltzmann323
E-International Scientific Research JournalISSN: 2094-1749 Volume: 2 Issue: 4, 2010weight , w<strong>here</strong> is <strong>the</strong> bulk Hamiltonian, relation (12).We note that <strong>the</strong> second equality in relation (15c) results from <strong>the</strong> Wick <strong>the</strong>orem [40,41].Remark <strong>the</strong> absence of <strong>the</strong> crossed coefficientin relation (15a). Indeed, this coefficient multiplies <strong>the</strong> correlation function, which is zero, since <strong>the</strong> bulk Hamiltonian is quadratic in <strong>the</strong> field ψ. On <strong>the</strong>o<strong>the</strong>r hand, <strong>the</strong> correlation functioncan be computed exactly. Then, <strong>the</strong> result, in <strong>the</strong> mean-field limit , writes [59]w<strong>here</strong> is <strong>the</strong> modified Bessel function [42]. Here, is that amplitude appearing in Eq.(9), andis <strong>the</strong> bulk correlation length, with amplitudes (above ) and(below ). With <strong>the</strong>se considerations, we find that, near , <strong>the</strong> pair-potential writesNow, <strong>the</strong> first derivative of this potential with respect to <strong>the</strong> distance r gives <strong>the</strong> expectedinduced force,We have used some recursion formulae satisfied by <strong>the</strong> modified Bessel function [42].formBefore discussion, let us first rewrite <strong>the</strong> above expression on <strong>the</strong> following scalingwith <strong>the</strong> universal scaling functions324
E-International Scientific Research JournalISSN: 2094-1749 Volume: 2 Issue: 4, 2010and amplitudesRemark that <strong>the</strong>se amplitudes are pure numbers. T<strong>here</strong>,is <strong>the</strong> step-function. Wehave used <strong>the</strong> notation , w<strong>here</strong> is <strong>the</strong> p<strong>article</strong> diameter. Then, <strong>the</strong>length D may be viewed as a renormalized p<strong>article</strong> size.Now, let us discuss <strong>the</strong> derived expression for <strong>the</strong> induced force.Firstly, we emphasize that we have ignored higher order cumulants describing threebodyinteractions and more. In this sense, formula (18) is exact only when one is concernedwith two-body interactions. Also, in <strong>the</strong> bulk Hamiltonian, we have ignored nonquadratictermsas and , which must contribute when one performs loopexpansion[41,42],in field <strong>the</strong>ory language. These terms are discarded <strong>here</strong>, since <strong>the</strong> meanfield<strong>the</strong>ory we consider is just <strong>the</strong> zeroth order approximation of <strong>the</strong> loop expansion.Secondly, we note that, in <strong>the</strong>limit, that is when one is exactly at <strong>the</strong> consolutepoint, we recover <strong>the</strong> previous results of Ref. [27]. Indeed, in this limit, wehave .Thirdly, <strong>the</strong> contribution of <strong>the</strong> surface chemical potentials difference dominates. Thismeans that <strong>the</strong> direct interactions between <strong>the</strong> mixture and p<strong>article</strong>s play only a minor role.Fourthly, <strong>the</strong> dependence of <strong>the</strong> force on <strong>the</strong> p<strong>article</strong> size is trivial and appears through<strong>the</strong> renormalized diameter D.Fifthly, <strong>the</strong> decreasing character of <strong>the</strong> Bessel function indicates that, as it should be,<strong>the</strong> force below <strong>the</strong> consolute point is more important than above, when one is at <strong>the</strong> samedistance from . Notice thatSixthly, for all temperatures around <strong>the</strong> consolute oneand at fixed inter p<strong>article</strong>distancer, <strong>the</strong> force is less important than at. This is due to <strong>the</strong> fact that <strong>the</strong> two scalingfunctions and are bounded from above by 1, that is and ,325
E-International Scientific Research JournalISSN: 2094-1749 Volume: 2 Issue: 4, 2010for all. T<strong>here</strong>fore, <strong>the</strong> temperature has as effect to reduce <strong>the</strong> induced force, when onegoes away from <strong>the</strong> critical point.Seventhly, formula (19) tells us that <strong>the</strong> reduced force,, is a two-factor scalingfunction of <strong>the</strong> renormalized distance and <strong>the</strong> ratio . In addition, it is a universalfunction of <strong>the</strong>se variables, independently on <strong>the</strong> chemical structure of polymers and colloids.Eighthly, at fixed distance r and very close to <strong>the</strong> critical pointforce obeys an exponential decay, that is, <strong>the</strong> inducedWe have used <strong>the</strong> standard ma<strong>the</strong>matical formula [42]: . The above expression tells us that <strong>the</strong>temperature has as effect to ”screen” <strong>the</strong> induced force at . The correlation length<strong>the</strong>n plays <strong>the</strong> role of <strong>the</strong> standard Debye screening length [60], but <strong>the</strong> computed inducedforce is much smaller than <strong>the</strong> screened Coulombian one.Finally, we give an order of magnitude of <strong>the</strong> induced force. We consider <strong>the</strong>hydrogenated polyolefin-deuterated polyolefin mixture incorporating silicon p<strong>article</strong>s ofdiameter, for which <strong>the</strong> polymerization degree and critical temperature werefound to be [61] : , . We take as values for <strong>the</strong> inter p<strong>article</strong> distanceand correlation length : , . For <strong>the</strong>se values, we find that <strong>the</strong> magnitudeof <strong>the</strong> force is :. This force must be compared to that relative to<strong>the</strong> considered polymer mixture confined to two parallel plates separated by <strong>the</strong> same distance. The magnitude of <strong>the</strong> latter is . Thus, <strong>the</strong> forcebetween parallel plates is two times more important than that between a pair of colloids. Also,<strong>the</strong> same force must be compared to <strong>the</strong> electromagnetic one, which is of <strong>the</strong> order ofdyne (for ).326
E-International Scientific Research JournalISSN: 2094-1749 Volume: 2 Issue: 4, 2010In Fig.1, we report <strong>the</strong> reduced induced forces,, versus <strong>the</strong> dimension lessdistance , for two temperatures and . In Fig.2, we superpose tworeduced induced forces relative to two temperatures and away from , asfunctions of <strong>the</strong> dimensionless distance. These curves reflect <strong>the</strong> above deductions.ConclusionsWe recall that <strong>the</strong> purpose of <strong>the</strong> present paper was <strong>the</strong> determination of <strong>the</strong> spatial variation of<strong>the</strong> induced force between colloidal p<strong>article</strong>s immersed in a binary polymer mixture, attemperatures far from <strong>the</strong> critical one. The colloidal aggregation is due to a preferentialattraction of one polymer by <strong>the</strong> p<strong>article</strong>s.All calculations were done in <strong>the</strong> framework of <strong>the</strong> standard -<strong>the</strong>ory, w<strong>here</strong> <strong>the</strong> fieldis simply <strong>the</strong> composition fluctuation (order parameter). Applying this <strong>the</strong>ory and using <strong>the</strong>cumulant method, we first showed that <strong>the</strong> resulting pair-potential is <strong>the</strong> sum of twocontributions, which are proportional to bulk two-point correlation functions constructed withfields and , respectively. Second, for polymer mixtures of high molecular weight, <strong>the</strong>se(mean-field) correlation functions are known exactly, and we found that <strong>the</strong> expected force canbe expressed in term of <strong>the</strong> modified Bessel function .When it is adequately reduced, <strong>the</strong> force becomes a universal two-factor scalingfunction of <strong>the</strong> dimensionless variables and , w<strong>here</strong> r is <strong>the</strong> inter p<strong>article</strong>-distance,is <strong>the</strong> correlation length andis <strong>the</strong> renormalized diameter.We emphasize that <strong>the</strong> force expression we obtained can be extended to two p<strong>article</strong>s ofdifferent radii and . For this case, we state that <strong>the</strong> new expression would be similar tothat relative to a mono disperse colloidal system, by making <strong>the</strong> following change of <strong>the</strong>renormalized diameter : .We note that <strong>the</strong> above calculations make sense only for relatively high separations,that is for, with ∆ <strong>the</strong> surface-to-surface distance between two sp<strong>here</strong>s of <strong>the</strong> same327
E-International Scientific Research JournalISSN: 2094-1749 Volume: 2 Issue: 4, 2010radius R. When(very small-distances), however, <strong>the</strong> colloids can be viewed as twoparallel plates. For this case, <strong>the</strong> induced force decays ra<strong>the</strong>r as [25, 26].Finally, <strong>the</strong> main conclusion is that, in any case, <strong>the</strong> temperature has tendency to reduce<strong>the</strong> value of <strong>the</strong> expected force (at fixed inter p<strong>article</strong>-distance) as one moves outside <strong>the</strong>critical region.Fur<strong>the</strong>r works in relation with <strong>the</strong> subject are in progress.AcknowledgmentsWe are much indebted to Professors M. Daoud for fruitful discussions and to S. Dietrich,E.Eisenriegler and M. Krech for useful correspondences.ReferencesH.B.G.Casimir, Proc.Kon.Ned.Akad.Wetenschap B51, 793 (1948).S.K.Lamoreaux, Phys.Rev.Lett.78, 5 (1997).U.Mohideen and A. Roy, Phys.Rev.Lett.81, 4549 (1998).T.Ederth, Phys.Rev. A 62, 62104 (2000).G.Bressi et al., Phys.Rev.Lett.88, 41804 (2002).M.E.Fisher and P.-G.deGennes,C.R.Acad.Sci. (Paris) SérieB 287, 207 (1978);also, P.-G.deGennes, C.R.Acad.Sci. (Paris) II292, 701 (1981).M.Krech, TheCasimir Effect in Critical Systems, World Scientific, Singapore, (1994).M.Krech and S. Dietrich, Phys.Rev. A 46, 1886 (1992).M.Krech, Phys.Rev.E56, 1642 (1997).H.W.J.Blöte, J.L.Cardy, and M.P. Nightingale, Phys.Rev.Lett.56, 742 (1986).I. Affleck,Phys.Rev.Lett. 56, 746 (1986).J.L.Cardy,Nucl.Phys. B275, 200 (1986).T.W.Burkhardt and T.Xue, Phys.Rev.Lett. 66, 895 (1991); Nucl.Phys. B 345, 653(1991).T.W.Burkhardt and E.Eisenriegler,Nucl.Phys. B424, 487 (1994).K.Symanzik,Nucl.Phys. B190, 1 (1981).M.Krech and S. Dietrich, Phys.Rev.Lett. 66, 345 (1991); 67, 1055 (1991).E.Eisenriegler and M.Stapper,Phys.Rev. B 50, 10009 (1994).328
E-International Scientific Research JournalISSN: 2094-1749 Volume: 2 Issue: 4, 2010T.W.Burkhardt and E.Eisenriegler, Phys.Rev.Lett. 74, 3189 (1995).E.Eisenriegler and U.Ritschel, Phys.Rev. B51, 13717 (1995).K.K. Mon, Phys.Rev.Lett. 54, 2671 (1985); M.Krech, D.P.Landau, Phys.Rev. E,53, 4414(1996).E.Eisenriegler, A.Hanke, and S. Dietrich, Phys.Rev. E54, 1134 (1996).R.R.Netz, Phys.Rev.Lett. 76, 3646 (1996).F.Schlesener, A.Hanke, and S.Dietrich, J.Stat.Phys.110, 981 (2003), and references<strong>the</strong>rein.A.SaoutElhak et al., J.Chem.Phys.111, 8174(1999).R.Cherrabi et al.,Phys.Rev. E 62, 6795(2000).E.-K.Hachem, M.Benhamou, and M.Daoud, J.Chem.Phys. 116, 8168 (2002).H.Ridouane, E.-K.Hachem, and M.Benhamou, J.Chem.Phys.118, 10780 (2003).H.Ridouane, E.-K.Hachem, and M.Benhamou, Cond.Matter Phys. 7, 63 (2004).D.Beysens and D.Estève, Phys.Rev.Lett.54, 2123 (1985).V.Gurfein, D.Beysens, and F. Perrot, Phys.Rev. A 40, 2543 (1989).M.L.Broide, Y.Garrabos, and D.Beysens, Phys.Rev. E47, 3768 (1993).T. Narayanan et al., Phys.Rev. E 48, 1989 (1993).For a review, see D.Beysens et al.,J.Phys.Chem.98, 382 (1994).P.D.Gallagher, M.L.Kurnaz, and J.V. Maher,Phys.Rev. A 46, 7750 (1992).M.L.Kurnaz and J.V. Maher, Phys.Rev. E 51, 5916 (1995).H. Grüll and D.Woermann, J.Phys.Chem. 101, 814 (1997).A list of very recent experimental works can be found in : G.A.Williams, Physica C404, 415(2004).H.W.Diehl, in : Phase Transitions and Critical Phenomena, edited by C.DombandJ.L.Lebowitz, Vol. 10, Academic Press, London, (1986).S.Dietrich, in : Phase Transitions and Critical Phenomena, edited by C.Domb andJ.L.Lebowitz, Vol. 12, Academic Press, London, (1988).C.Itzykson and J.-M.Drouffe,Statistical Field Theory : 1 and 2, Cambridge UniversityPress,(1989).J.Zinn-Justin, Quantum Field Theory and Critical Phenomena, Clarendon Press,Oxford,(1989).I.S.Gradshteyn and I.M.Ryzik, Table of Integrals, Series and Products, Academic Press, NewYork, (1980).329
E-International Scientific Research JournalISSN: 2094-1749 Volume: 2 Issue: 4, 2010D.Beysens and S.Leibler, J.Phys.Lett. (Paris) 43, L-133 (1982).C. Franck and S.E.Schnatterly,Phys.Rev.Lett. 48, 763 (1982).M.Schlossman, X.-L.Wu, and C.Franck, Phys.Rev. B 31, 1478 (1985).J.A.Dixo et al.,Phys.Rev. B 31, 1509 (1985).An extensive list of very recent experiments using some new techniques can be found in:A.Hanke et al., Phys.Rev. E, 60, 5163 (1999).S. Blümel and G.H.Findenegg,Phys.Rev.Lett. 54, 447 (1985).E.Brézin and S.Leibler, Phys.Rev. B 27, 594 (1983); S.Leibler, PhD Thesis, Université ParisXI, (1984).J.Rudnik and D.Jasnow, Phys.Rev.Lett. 48, 1595 (1982).S.Leibler and L.Peliti, J.Phys. C 15, L-403 (1982).L.Peliti and S.Leibler, J.Phys. C 16, L-2635 (1983).Critical adsorption on curved objects, such as single spherical and rod-like colloidal p<strong>article</strong>s,has been investigated in : A.Hanke and S. Dietrich, Phys.Rev. E,59, 5081(1999); A.Hanke,Phys.Rev.Lett.48, 2180 (2000).P.-G.deGennes, Scaling Concepts in Polymer Physics, Cornell University Press, Ithaca,NewYork, (1979).P.J. Flory, Principles of Polymer Chemistry, Cornell University Press, Ithaca, (1953).K.Binder, in : Phase Transitions and Critical Phenomena, Vol. 8, edited by C.DombandJ.L.Lebowitz, Academic Press, London, (1983).P.-G.de Gennes, J.Phys.Lett. (Paris)38, L-441 (1977); J.-F.Joanny,J.Phys.A,11, L-177 (1978);K. Binder,J.Chem.Phys. 79, 6387 (1983).The bare surface parameters c and µ are usually assumed to be temperature independent.See Appendix B of Ref. [27].P.Debye and E. Hückel, Z. Phys.24, 185 (1923).M.Wendlandt et al.,J.Polymer Science : Part B38, 831 (2000).330
E-International Scientific Research JournalISSN: 2094-1749 Volume: 2 Issue: 4, 2010FIGURE CAPTIONSFig. 1:Reduced induced force, , upon <strong>the</strong> renormalized distance , fortwo temperatures (dashed curve) and (solid curve).Fig. 2: Reduced induced force, , upon <strong>the</strong> renormalized distance , fortwo temperatures (dashed line) and (solid line).331
E-International Scientific Research JournalISSN: 2094-1749 Volume: 2 Issue: 4, 2010FIGURES LISTDF/kB T c0 T=1,001 x Tc-1-2T=Tc-3-4-50,01 0,02 0,03 0,04 0,05 0,06r/DFigure 1332
E-International Scientific Research JournalISSN: 2094-1749 Volume: 2 Issue: 4, 2010DF/kB T c0T=1,2 x Tc-1-2T=1,1 x Tc-3-4-50,006 0,008 0,010 0,012 0,014r/DFigure 2333
E-International Scientific Research JournalISSN: 2094-1749 Volume: 2 Issue: 4, 2010LIFESTYLES OF CITY BARANGAY RESIDENTSASSOCIATED TO CLIMATE CHANGEDaylinda Luz R. Laput and Jay D. TelenResearch Director, Jose Rizal Memorial State University, Dipolog Campus, Dipolog CityDean, Student Affairs and Services, Jose Rizal Memorial State University, Main Campus,Dapitan CityAbstractThis study determines <strong>the</strong> lifestyles associated to climate change among <strong>the</strong> residents in<strong>the</strong> city barangays of Dipolog and Dapitan. Results revealed that <strong>the</strong> study is dominated withstudents and young professionals with ages 11 to 29 years old whose behaviors and practicesin <strong>the</strong> workplace, at home and workplace combined, in social and economic interactions, andin <strong>the</strong> home seemed to have mitigated and aggravated <strong>the</strong> impact on climate change. Lifestylesof respondents in <strong>the</strong> workplace ranked highest. It was also found out that <strong>the</strong>re was nodifference on <strong>the</strong> lifestyles at home, in <strong>the</strong> workplace, in social and economic interactions, in<strong>the</strong> home and workplace combined between professionals and non-professionals in Dipologand Dapitan cities. It concludes that practices of office workers and homemakers prove to haveincreased or aggravated <strong>the</strong> effect of climate change yet <strong>the</strong>y have compelling reasons to bevalue-focused in some ways like being organized, health conscious and comfortable. Itrecommends that lifestyles of residents in highly urbanized areas have to be subjected to somebehavior modifications. Private and joint adaptations have to be enforced to reduce <strong>the</strong>magnitude of harm brought about by environmental changes. And <strong>the</strong> government needs toinitiate policies on joint adaptation, to care<strong>full</strong>y design efficient responses which treat arisingproblems associated to climate change.Keywords: climate change, mitigating, aggravating lifestylesIntroductionClimate change has indeed remained a dynamic and alarming issue in almost allconventions of men, since it demands an increasing sense of urgency. Many have now felt andexperienced <strong>the</strong> impact of climate change to <strong>the</strong> environment, public health, <strong>the</strong> globaleconomy, global security, and <strong>the</strong> civil society.Convincingly, <strong>the</strong> Intergovernmental Panel on Climate Change (IPCC, 2001)enumerated some of <strong>the</strong> occurrences that indicate climate change and <strong>the</strong>se include <strong>the</strong>spreading of disease, plant and animal range shifts and population changes, coral reefbleaching, downpours, heavy snowfalls and flooding, droughts and fires. According to <strong>the</strong>m,<strong>the</strong>se are only a few of <strong>the</strong> increasing body of observations which give a collective picture of awarming world and o<strong>the</strong>r changes in <strong>the</strong> climate system.334
E-International Scientific Research JournalISSN: 2094-1749 Volume: 2 Issue: 4, 2010The excerpts of McCosker (2009) from a summary of <strong>the</strong> 2009 Copenhagen Accord onGlobal Climate Change and an examination of Australia's position on <strong>the</strong> environment,explicitly expressed that climate change is one of <strong>the</strong> greatest challenges of our time. Ourstrong political will must be emphasized to urgently combat climate change in accordance with<strong>the</strong> principle of common but differentiated responsibilities and respective capabilities.John Holdren (2007), President of <strong>the</strong> American Association for <strong>the</strong> Advancement ofScience, fur<strong>the</strong>r added that we basically have three choices - mitigation, adaptation, andsuffering. We are going to do some of each. The question is what <strong>the</strong> mix is going to be. Themore mitigation we do, <strong>the</strong> less adaptation will be required, and <strong>the</strong> less suffering <strong>the</strong>re willbe.This phenomenon could be attributed to <strong>the</strong> behaviors, practices and lifestyles of <strong>the</strong>people who have dwelt and continually exploited <strong>the</strong> natural resources and have constantlydone activities that pose threats to <strong>the</strong> environment. Only men could find ways to mitigate orperhaps totally solve <strong>the</strong>se threatening environmental conditions. Thus, this paper anchored onsome <strong>the</strong>ories that would somehow help elucidate some concepts on people’s behaviors andpractices and <strong>the</strong> consequences that <strong>the</strong>y may bring to <strong>the</strong>ir personal lives, to <strong>the</strong> lives of o<strong>the</strong>rsand to <strong>the</strong> environment as a whole. One of which is <strong>the</strong> Social Cognitive Theory of Banduraand Mischel (1999) cited by Pervin & John (2001) that emphasizes <strong>the</strong> social origins ofbehavior and <strong>the</strong> importance of cognitive thought processes in all aspects of humanfunctioning-motivation, emotion, and action. The <strong>the</strong>ory suggests that behavior can beexplained in terms of an interaction between <strong>the</strong> person and <strong>the</strong> environment. People areinfluenced by environmental forces, but <strong>the</strong>y also choose how to behave. The person is bothresponsive to situations and actively constructs and influences situations. People selectsituations as well as being shaped by <strong>the</strong>m; <strong>the</strong>y influence <strong>the</strong> behavior of o<strong>the</strong>rs as well asbeing shaped by <strong>the</strong> behavior of o<strong>the</strong>rs. According to social cognitive <strong>the</strong>ory, behavior issituation-specific and people have distinctive patterns of behaving in situations.The <strong>the</strong>ory fur<strong>the</strong>r proposes that behavior change is affected by environmentalinfluences, personal factors, and attributes of <strong>the</strong> behavior itself. Each may affect or be affectedby ei<strong>the</strong>r of <strong>the</strong> o<strong>the</strong>r two. A central tenet of social cognitive <strong>the</strong>ory is <strong>the</strong> concept of selfefficacy.A person must believe in his or her capability to perform <strong>the</strong> behavior (i.e., <strong>the</strong> personmust possess self-efficacy) and must perceive an incentive to do so (i.e., <strong>the</strong> person's positiveexpectations from performing <strong>the</strong> behavior must outweigh <strong>the</strong> negative expectations).Additionally, a person must value <strong>the</strong> outcomes or consequences that he or she believes willoccur as a result of performing a specific behavior or action.This is also supported with <strong>the</strong> <strong>the</strong>ory of reasoned action which states that individualperformance of a given behavior is primarily determined by a person's intention to perform thatbehavior. This intention is determined by two major factors: <strong>the</strong> person's attitude toward <strong>the</strong>behavior (i.e., beliefs about <strong>the</strong> outcomes of <strong>the</strong> behavior and <strong>the</strong> value of <strong>the</strong>se outcomes) and<strong>the</strong> influence of <strong>the</strong> person's social environment or subjective norm (i.e., beliefs about whato<strong>the</strong>r people think <strong>the</strong> person should do, as well as <strong>the</strong> person's motivation to comply with <strong>the</strong>opinions of o<strong>the</strong>rs). The <strong>the</strong>ory of planned behavior adds to <strong>the</strong> <strong>the</strong>ory of reasoned action <strong>the</strong>concept of perceived control over <strong>the</strong> opportunities, resources, and skills necessary to performa behavior. The concept of perceived behavioral control is similar to <strong>the</strong> concept of selfefficacy-- person's perception of his or her ability to perform <strong>the</strong> behavior. Perceivedbehavioral control over opportunities, resources, and skills necessary to perform a behavior isbelieved to be a critical aspect of behavior change processes.335
E-International Scientific Research JournalISSN: 2094-1749 Volume: 2 Issue: 4, 2010The Field Theory of Lewin (1947) cited by Smith (2001) also believed that for changeto take place, <strong>the</strong> total situation has to be taken into account. If only part of <strong>the</strong> situation isconsidered, a misrepresented picture is likely to develop. His <strong>the</strong>ory fur<strong>the</strong>r asserted thatbehavior was determined by totality of an individual’s situation. In his field <strong>the</strong>ory, a field isdefined as <strong>the</strong> totality of coexisting facts which are conceived of as mutually interdependent.Individuals were seen to behave differently according to <strong>the</strong> way in which tensions betweenperceptions of <strong>the</strong> self and of <strong>the</strong> environment were worked through. The whole psychologicalfield, or life space, within which people acted had to be viewed, in order to understandbehavior. Within this individuals and groups could be seen in topological terms (using maplikerepresentations). Individuals participate in a series of life spaces (such as <strong>the</strong> family, work,school and church), and <strong>the</strong>se were constructed under <strong>the</strong> influence of various force vectors.However, behavior modifications are possible through a <strong>the</strong>rapy program as stressed byNewton (1996). He defined behavior modification <strong>the</strong>rapy as something that seeks toextinguish or inhibit abnormal or maladaptive behavior by reinforcing desired behavior andextinguishing undesired behavior. The goal of a program of behavior modification is to changeand adjust behavior that is inappropriate or undesirable in some way. With this program, <strong>the</strong>individual would be aware of his undesirable behavior and with this awareness comes <strong>the</strong>greater goal of understanding <strong>the</strong> cause and effect of <strong>the</strong> behaviors, thus helping to affectchange.It is for this reason that <strong>the</strong> researchers believed that <strong>the</strong> lifestyle changing behaviorsand practices of <strong>the</strong> city barangay residents could be significantly associated to climate changeand hypo<strong>the</strong>sized that <strong>the</strong>re is no difference on <strong>the</strong> lifestyles at home, in <strong>the</strong> workplace, insocial and economic interactions, in <strong>the</strong> home and workplace combined between professionalsand non-professionals, hence, this study.Objectives of <strong>the</strong> StudyThe study aimed to determine <strong>the</strong> lifestyle changing behaviors and practices of citybarangay residents that mitigate or amplify <strong>the</strong> impact of climate change in <strong>the</strong>ir workplaces,social and economic interactions, and in <strong>the</strong>ir homes. It also profiled <strong>the</strong> respondents’ age andprofession to draw <strong>the</strong> demarcation line in those behaviors and practices <strong>the</strong>y commonlyadapted in <strong>the</strong> specifically given scenarios. And most importantly, this study was purposelydone to frame out sound recommendations relating to behavior modification adaptive possiblyto mitigating climate change.Research MethodThis study employed <strong>the</strong> descriptive method of research. The questionnaire, in checklistform was made by <strong>the</strong> researchers to rank common behaviors and practices in mitigating orincreasing climate change. Respondents included students and professionals in varying agesparticularly residing in <strong>the</strong> urbanized areas of Dipolog and Dapitan cities. In treating <strong>the</strong> surveydata, frequency and percentage ranking were utilized, while in determining <strong>the</strong> difference inlifestyles in <strong>the</strong> home, workplace, social and economic interactions and home and workplacecombined between professional and non-professional city residents, Friedman’s two-wayAnalysis of Variance (ANOVA) was used.336
E-International Scientific Research JournalISSN: 2094-1749 Volume: 2 Issue: 4, 2010Results and DiscussionTable 1 shows <strong>the</strong> respondents’ age. It revealed that 310 or 62% aged 11 to 29 yearsold; 113 or 22.5%, 30 to 49 years old; and 46 or 9.2%, 50 to 69 years old. This implies thatthose with behaviors and practices which mitigate or increase <strong>the</strong> impact on climate changewere people belonging to <strong>the</strong> young generation. It means that <strong>the</strong> young individuals are directlyresponsible in effecting lifestyle change to adapt with <strong>the</strong> change in climate.Table 1 Respondents’ AgeAge Bracket Frequency Percentage Rank70 years old and above 12 2.4% 550 to 69 years old 46 9.2% 330 to 49 years old 113 22.6% 211 to 29 years old 310 62% 110 years old and below 19 3.8% 4TOTAL 500 100%Table 2 presents <strong>the</strong> respondents’ profession. It showed that 257 or 51.4% studentsranked highest; followed by 206 or 41.2% professionals. Only 37 or 7.4 percent consisted of<strong>the</strong> retirees. It implies that lifestyles to mitigate climate change are concentrated amongstudents and young professionals. This means that most of those who are formally educated areadept on lifestyles associated to climate change.Table 2 Respondents’ ProfessionProfession Frequency Percentage RankStudents 257 51.4% 1Professionals 206 41.2% 2Retirees 37 7.4% 3TOTAL 500 100%Table 3 Behaviors and Practices Associating to <strong>the</strong> Impact on Climate Change at HomeLIFESTYLES ASSOCIATED TO CLIMATECHANGEA. Home F Ave. Rank Rank of Ranks1. Wears cotton clothing 272 1.79 2.52. Cleans bathroom and CR 289 2.06 93. Teaches children to live simply 220 2.02 84. Provides children valuable memories, quality time 204 2.23 10toge<strong>the</strong>r5. Makes home a place any members of <strong>the</strong> familywant to come back220 1.97 5337
E-International Scientific Research JournalISSN: 2094-1749 Volume: 2 Issue: 4, 20106. Sleeps late at night 331 1.94 47. Prefers to drink cold water 285 1.76 18. Washes dishes in running water from faucet 176 2.00 69. Hands on with children 100 2.01 710. Brushes teeth with faucet open 178 1.79 2.5Table 3 presents <strong>the</strong> behaviors and practices associating to <strong>the</strong> impact on climatechange at home. Results revealed that respondents’ preference to drink cold water ranked first;wearing cotton clothing and brushing teeth with faucet open, followed and equaled in rank;sleeping late at night, was next. This implies that respondents manifested more aggravatinglifestyles at home which means that <strong>the</strong>y contributed much to <strong>the</strong> increase in <strong>the</strong> impact ofclimate change.This coincides with <strong>the</strong> report of Rosenzweig (2008) linking humans to climate changeand she revealed that observed global-scale impacts are very likely because of human-causedwarming. According to her, humans are influencing climate through increasing greenhouse gasemissions. The warming is causing impacts on physical and biological systems that are nowattributable at <strong>the</strong> global scale.Table 4 Behaviors and Practices Associating to <strong>the</strong> Impact on Climate Change atWorkplaceLIFESTYLES ASSOCIATED TO CLIMATECHANGEB. Workplace F Ave. Rank Rank of Ranks1. Downloads files 117 1.97 82. Sends reports and files through e-mail 82 1.98 93. Keeps planner, book, wallet, kit, mosquito 144 1.51 1repellant, Eucalyptus roll-on, nail cutter, nail file,napkin, medicines such as paracetamol, antacid, etc.in <strong>the</strong> handbag4. Leaves computer in a switch on mode 75 1.56 35. Listens to MP3 while working in <strong>the</strong> office 77 1.90 66. Multitasks oneself like texting, blogging,104 1.91 7chumming, tweeting, engaging in long teletalks,internet gaming while at work7. Sidetasks self on computer games such as spider 68 2.30 10solitaire, pinball, Zuma, backgammon, minesweep,etc.8. Leaves air-conditioned unit on while taking noon 47 1.53 2break9. Dines out every mealtime while at work 43 1.61 510. Leaves ringing office telephones unanswered 32 1.59 4Table 4 shows behaviors and practices associating to <strong>the</strong> impact on climate change atworkplace. Findings revealed that keeping planner, book, wallet, kit, mosquito repellant,338
E-International Scientific Research JournalISSN: 2094-1749 Volume: 2 Issue: 4, 2010Eucalyptus roll-on, nail cutter, nail file, napkin, medicines such as paracetamol, antacid, etc. in<strong>the</strong> handbag, leaving air conditioning unit on while taking noon breaks, and leaving <strong>the</strong>computer in a switch on mode were rated by <strong>the</strong> respondents on <strong>the</strong> first, second and third rankrespectively. This implies that respondents still have more lifestyles which heighten <strong>the</strong> effectsof climate change than those that mitigate, but <strong>the</strong>y have o<strong>the</strong>r compelling reasons to be valuefocusedat times when <strong>the</strong>y are at work such as that behavior of being well-organized. Despitethose compelling reasons, <strong>the</strong> United Nations Environment Programme-World MeteorologicalOrganization (1997) confirmed in <strong>the</strong>ir report that human activities are contributing to climatechange, and that <strong>the</strong>re has been a discernible human influence on global climate and that <strong>the</strong>seactivities will have an increasing influence on future climate.Table 5 Behaviors and Practices Associating to <strong>the</strong> Impact on Climate Change in Socialand Economic InteractionsLIFESTYLES ASSOCIATED TO CLIMATE CHANGEC. Social and Economic Interactions F Ave. Rank Rank of Ranks1. Prefers to commute from home to work and vice versa 204 1.50 12. Emails to friends and family 194 2.13 83. Sends text messages through SMS 186 1.82 44. Uploads photos and o<strong>the</strong>r files on social networks 171 2.18 95. Engages in bodily and mental exercises such as yoga,painting, cooking, baking, swimming, o<strong>the</strong>r sports andmartial arts6. Listens to radio and watches TV broadcast andinfomercials.182 1.98 6344 1.62 27. Leaves <strong>the</strong> o<strong>the</strong>r person enjoy <strong>the</strong> freedom to decide 204 1.92 58. Spends time at <strong>the</strong> beach breathing fresh air, dipping feet in 159 2.28 10<strong>the</strong> water, or bathing at <strong>the</strong> sea9. Rides on PUVs even to short distance destinations 110 1.63 310. Prefers calling than texting 125 2.09 7Table 5 presents behaviors and practices associating to <strong>the</strong> impact on climate change insocial and economic interactions. Results showed that respondents rated commuting fromhome to work and vice-versa first; listening to radio and watching TV broadcast andcommercials, second; and riding on PUVs even to short distance destinations, third. Thisimplies that respondents were much behavior-focused as evidenced by <strong>the</strong>ir choices orpreferences in keeping with work efficiency and <strong>the</strong>ir growing concern for public information.This means that in order to cope with <strong>the</strong> intense effects of climate change nowadays, peoplelearn to adjust <strong>the</strong>ir lifestyles by ei<strong>the</strong>r sacrificing <strong>the</strong>ir own comfort on transfer and movementto places or managing <strong>the</strong>ir inclinations to fit in to work and social demands.339
E-International Scientific Research JournalISSN: 2094-1749 Volume: 2 Issue: 4, 2010Table 6 Behaviors and Practices Associating to <strong>the</strong> Impact on Climate Change at Homeand WorkplaceLIFESTYLES ASSOCIATED TO CLIMATE CHANGED. Home and Workplace F Ave. Rank Rank of1. Applies facial creams, body moisturizers, sunblock ando<strong>the</strong>r extra skin and hair care protect and energyboosting, skin revitalizing products2. Goes vegetarian by eating only fish or no fish at all diet,avoiding junk foods and softdrinks3. Takes dietary food supplements such as wheatgrass,vitaplus, fernslim, vitalC, fernC, bioslim and o<strong>the</strong>rweight reducing substances4. Sticks to daily routines from <strong>the</strong> moment of waking upto bedtime such as fixing <strong>the</strong> bed, taking meals on time,etc. to freshening up at nightRanks155 1.96 5164 1.79 2121 2.09 7263 1.82 45. Maintains regular meeting with family members and 196 1.98 6workmates.6. Leaves <strong>the</strong> room or hall with its lights on 133 1.65 17. Charges cellular phones beyond <strong>the</strong> required charging time 203 1.81 3Table 6 shows behaviors and practices associating to <strong>the</strong> impact on climate change in<strong>the</strong> home and workplace. Findings revealed practices such as leaving <strong>the</strong> room or hall with itslights on, going vegetarian by eating only fish or no fish at all, avoiding junk foods and softdrinks, and charging cellular phones beyond <strong>the</strong> required charging time were <strong>the</strong> first threehighest ranking lifestyles at home and work combined. This implies that respondents haveworsened <strong>the</strong> effect on climate change as <strong>the</strong>y apparently have wasted on energy at <strong>the</strong> sametime <strong>the</strong>y are trying to mitigate it through attitudes concerning much more on health andnutrition. This means that staying fit and healthy would sometimes appear to have preoccupied<strong>the</strong> respondents however <strong>the</strong>y also obviously have alarming tendencies on power misuse,which eventually would bring about a devastating impact to climate change. Disclosing <strong>the</strong>statements from (http://edugreen.teri.res.in/explore/climate/causes.htm), all of us in ourdaily lives contribute our bit to this change in <strong>the</strong> climate. Electricity is <strong>the</strong> main source ofpower in urban areas. All our gadgets run on electricity generated mainly from <strong>the</strong>rmal powerplants. These <strong>the</strong>rmal power plants are run on fossil fuels (mostly coal) and are responsible for<strong>the</strong> emission of huge amounts of greenhouse gases and o<strong>the</strong>r pollutants. Cars, buses, and trucksare <strong>the</strong> principal ways by which goods and people are transported in most of our cities. Theseare run mainly on petrol or diesel, both fossil fuels. We generate large quantities of waste in340
E-International Scientific Research JournalISSN: 2094-1749 Volume: 2 Issue: 4, 2010<strong>the</strong> form of plastics that remain in <strong>the</strong> environment for many years and cause damage. We usea huge quantity of paper in our work at schools and in offices which would mean that largeareas of forest have to be cut down.Table 7 Average Ranks Showing <strong>the</strong> Difference in Lifestyles between Professionals andNon-ProfessionalsLIFESTYLES ASSOCIATED TO CLIMATE CHANGEA. HomeProfessionalsAve. RankRank ofRanksNon-ProfessionalsAve. Rank1. Wears cotton clothing 1.67 2.5 1.89 3.52. Cleans bathroom and CR 1.94 8 2.13 8Rank ofRanks3. Teaches children to live simply 1.86 5 1.94 54. Provides children valuable memories, quality 2.31 10 2.16 9time toge<strong>the</strong>r5. Makes home a place any members of <strong>the</strong> family 1.85 4 1.84 2want to come back6. Sleeps late at night 1.89 6.5 1.96 77. Prefers to drink cold water 1.89 6.5 1.67 18. Washes dishes in running water from faucet 2.16 9 1.89 69. Hands on with children 1.67 2.5 2.38 1010. Brushes teeth with faucet open 1.62 1 1.89 3.5B. WorkplaceProfessionals Non-ProfessionalsAve. RankRank ofRanksAve. Rank11. Downloads files 2.22 9 1.91 712. Sends reports and files through e-mail 2.12 8 1.79 3Rank ofRanks13. Keeps planner, book, wallet, kit, mosquito 1.44 2 1.81 4repellant, Eucalyptus roll-on, nail cutter, nail file,napkin, medicines such as paracetamol, antacid,etc. in <strong>the</strong> handbag14. Leaves computer in a switch on mode 1.54 3 1.61 215. Listens to MP3 while working in <strong>the</strong> office 1.84 4 2.00 816. Multitasks oneself like texting, blogging, 1.89 5 1.89 6chumming, tweeting, engaging in long teletalks,internet gaming while at work17. Sidetasks self on computer games such as spider 2.26 10 2.24 9solitaire, pinball, Zuma, backgammon,minesweep, etc.18. Leaves air-conditioned unit on while taking noon 1.38 1 2.60 10break19. Dines out every mealtime while at work 2.00 7 1.11 120. Leaves ringing office telephones unanswered 1.94 6 1.86 5C. Social and Economic Interactions Professionals Non-ProfessionalsAve. RankRank ofRanksAve. RankRank of341
E-International Scientific Research JournalISSN: 2094-1749 Volume: 2 Issue: 4, 2010Ranks21. Prefers to commute from home to work and vice 1.50 1 1.49 2versa22. Emails to friends and family 2.09 7 2.21 1023. Sends text messages through SMS 1.95 6 2.03 624. Uploads photos and o<strong>the</strong>r files on social networks 2.21 9 1.19 125. Engages in bodily and mental exercises such as 1.86 4 2.20 9yoga, painting, cooking, baking, swimming, o<strong>the</strong>rsports and martial arts26. Listens to radio and watches TV broadcast and 1.81 3 1.57 3infomercials.27. Leaves <strong>the</strong> o<strong>the</strong>r person enjoy <strong>the</strong> freedom to 1.90 5 1.92 5decide28. Spends time at <strong>the</strong> beach breathing fresh air, 2.33 10 2.10 8dipping feet in <strong>the</strong> water, or bathing at <strong>the</strong> sea29. Rides on PUVs even to short distance destinations 1.61 2 1.76 430. Prefers calling than texting 2.11 8 2.08 7D. Home and WorkplaceProfessionals Non-Professionals31. Applies facial creams, body moisturizers,sunblock and o<strong>the</strong>r extra skin and hair careprotect and energy boosting, skin revitalizingproducts32. Goes vegetarian by eating only fish or no fish atall diet, avoiding junk foods and softdrinks33. Takes dietary food supplements such aswheatgrass, vitaplus, fernslim, vitalC, fernC,bioslim and o<strong>the</strong>r weight reducing substances34. Sticks to daily routines from <strong>the</strong> moment ofwaking up to bedtime such as fixing <strong>the</strong> bed,taking meals on time, etc. to freshening up atnight35. Maintains regular meeting with family membersand workmates.Ave. RankRank ofRanksAve. RankRank ofRanks1.75 2 2.31 71.84 4 1.89 42.09 6.5 2.11 61.76 3 1.00 12.09 6.5 1.78 236. Leaves <strong>the</strong> room or hall with its lights on 1.60 1 1.93 537. Charges cellular phones beyond <strong>the</strong> required charging 1.86 5 1.79 3timeTable 7 presents <strong>the</strong> average ranks showing <strong>the</strong> lifestyles of professionals and nonprofessionals.It showed that among professionals, lifestyles such as brushing <strong>the</strong>ir teeth withfaucet open; leaving office air-conditioning units on while taking noon breaks; commutingfrom home to work and vice versa; and leaving <strong>the</strong> room or hall with its lights on, ranked first;while <strong>the</strong> non-professionals’ lifestyles revealed that <strong>the</strong>y prefer to drink cold water; dine outevery mealtime while at work; upload photos and o<strong>the</strong>r files on social networks; and stick todaily routines from <strong>the</strong> moment <strong>the</strong>y wake up to bedtime such as fixing <strong>the</strong> bed, taking mealson time, etc. to freshening up at night, topped in <strong>the</strong>ir rank of ranks. This implies that thoughboth groups varied <strong>the</strong>ir lifestyles, <strong>the</strong> professionals did less mitigation, while <strong>the</strong> non-342
E-International Scientific Research JournalISSN: 2094-1749 Volume: 2 Issue: 4, 2010professional group had done more adaptations to climate change. This could be corroboratedclosely to Mendelsohn’s (2000) finding that individuals and firms likely engage in substantialprivate adaptation with respect to climate change. Recreation and energy were among thosesectors which build interest in possible adaptation measures. He suggested sound actions suchas joint adaptation, but on <strong>the</strong> o<strong>the</strong>r hand offered his reservation due to its shared benefitnature. It will cause individuals to underprovide joint adaptation in areas such as water controland ecological management which are largely evident in <strong>the</strong> present study.Table 8 Test of Significant Difference on <strong>the</strong> Lifestyles Between Professionals and Non-ProfessionalsLIFESTYLESPROFESSIONALS NON-Computed ValueX r2PROFESSIONALSTabular ValueDf .05(1)Action Takena. Home 0.40 3.84 Accept HOb. Workplace 0.10 3.84 Accept HOc. Social and Economic Interactions 0.0 3.84 Accept HOd. Home and Workplace 0.1428 3.84 Accept HOTable 8 shows test of significant difference on <strong>the</strong> lifestyles between professionals andnon-professionals. Result revealed that <strong>the</strong>ir lifestyles in <strong>the</strong> four areas do not significantlydiffer having <strong>the</strong>ir respective computed values as: 0.40, in <strong>the</strong> home; 0.10, workplace; 0.0,social and economic interactions; and 0.1428, home and workplace, with tabular value of 3.84at .05(1) degrees of freedom, which lead to accepting <strong>the</strong> null hypo<strong>the</strong>sis. This implies thatthough <strong>the</strong> professional and non-professional groups vary in <strong>the</strong>ir lifestyles but whencategorized as practices specifically at home, in <strong>the</strong> workplace and in social and economicinteractions, <strong>the</strong>se practices do not necessarily differ. This means that embedding behaviorssuch as leaving lights on and leaving water freely flowing from faucets have been acclimatizedeven in different environments resulting to having no significant difference at all in <strong>the</strong>people’s lifestyles. But in this present study, respondents showed great efforts to observe someforms of personal alterations to environmental changes showing not only mitigating but alsoadaptation behaviors such as taking <strong>the</strong> bus or any public utility vehicles instead of driving<strong>the</strong>ir own cars for working professionals; while those not engaged in a profession were tryingto maintain daily routines from <strong>the</strong> struck of dawn to <strong>the</strong> wee hours of night.Based on <strong>the</strong> adaptation, mitigation and suffering choices of Holdren (2007), thispresent study uniquely achieved a popular mix; that <strong>the</strong> more different lifestyles <strong>the</strong> individualpractice, <strong>the</strong> more he mitigates, adapts or aggravates <strong>the</strong> impact of climate change. Alterationsof behavior at some point, only if given importance, will mitigate potential harm brought aboutby climate change.Conclusion and RecommendationThe practices of office workers and homemakers prove to have increased or aggravated<strong>the</strong> effect of climate change yet <strong>the</strong>y have compelling reasons to be value-focused in someways like being organized, health conscious and comfortable, thus lifestyles of residents in343
E-International Scientific Research JournalISSN: 2094-1749 Volume: 2 Issue: 4, 2010highly urbanized areas particularly those office employees have to be subjected to somebehavior modifications to address climate change mitigation.This study recommends that lifestyles of residents in highly urbanized areasparticularly those office employees have to be subjected to some behavior modifications toaddress climate change mitigation. Private or individual and joint adaptations especially in <strong>the</strong>key market sectors of <strong>the</strong> society should be enforced so that <strong>the</strong> magnitude of harm from <strong>the</strong>impact of climate change will be reduced and <strong>the</strong> size of benefits will increase not only in areasof recreation and energy, but most importantly in <strong>the</strong> direct impact areas of farming, forestryand ecological management. This environmental concern necessitates government initiatives –<strong>the</strong> government needs to start thinking about joint adaptation, to care<strong>full</strong>y design efficientresponses which treat arising problems associated to climate change.ReferencesCauses of Climate Change, Retrieved fromhttp://edugreen.teri.res.in/explore/climate/causes.htmCommon Questions about Climate Change, Are Human Activities Contributing to ClimateChange? Published in 1997 by <strong>the</strong> United Nations Environment Programme – WorldMeteorological Organization, Retrieved from http://www.gcrio.org/ipcc/qa/03.htmlGlobal Warming: Early warning signs (1999). IPCC, 2001. Retrieved on March 29, 2010from http://www.climatehotmap.orgHoldren, J. (2007). How Climate Change will affect our lifestyles. Retrieved fromhttp://www.suffolkcoastal.gov.uk/your district/greenissues/affects/default.htmMcCosker, L.K. (2009). A Summary of <strong>the</strong> 2009 Copenhagen Accord on Global ClimateChange and an Examination of Australia’s Position on <strong>the</strong> Environment.Retrieved December 21, 2009, fromhttp://www.associatedcontent.com/<strong>article</strong>/2514917/summary of <strong>the</strong> Copenhagen2009 global.htmlMendelsohn, R. (2000). Efficient Adaptation to Climate Change. Climactic Change, Vol. 45,Nos. 3-4: Accessed on 29 October 2010 fromhttp://www.springerlink.com/content/k153513042t34400/Mental Health Glossary, C.J. Newton, MA, Learning Specialist (July 1996).Pervin, Lawrence A. & John, Oliver P. (2001). Personality: <strong>the</strong>ory and research. 8 th ed.Philippines: John Wiley & Sons, Inc.Rosenzweig, C. (2008). Humans Linked to Climate Change: NASA Study Links EarthImpacts to Human-Caused Climate Change. Published as a NASA news release inMay, 2008 from http://geology.com/nasa/human-linked-climate-change.shtmlSmith, M. K. (2001). Kurt Lewin: Groups, experiential learning and action research. Theencyclopedia of informal education.344
E-International Scientific Research JournalISSN: 2094-1749 Volume: 2 Issue: 4, 2010ESTIMATING THE HEALTH AND ECONOMICVULNERABILITIES OF THE INDIGENOUS PEOPLE(IP) IN ZAMBOANGA DEL NORTETO THE EFFECTS OF CLIMATE CHANGEW. Nabua, N. Bureros and J. AquinoJose Rizal Memorial State University – Katipunan Campus, Katipunan, Zamboanga del NorteJose Rizal Memorial State University – Main Campus, Dapitan CityJose Rizal Memorial State University – Katipunan Campus, Katipunan, Zamboanga del NorteAbstractAn analytical framework for estimating <strong>the</strong> health and economic vulnerabilities of <strong>the</strong>indigenous people of Zamboanga del Norte to <strong>the</strong> effects of climate change is proposed andvalidated in this paper. Vulnerability, as used in this research, refers to <strong>the</strong> extent of risk andexposure of <strong>the</strong> IPs to <strong>the</strong> physical manifestations of climate change considering <strong>the</strong>ir copingmechanisms. Applying such a framework to <strong>the</strong> Subanen and Kalibogan tribes in Zamboangadel Norte, results show that : (a.) <strong>the</strong> indigenous people of Zamboanga del Norte were veryvulnerable in terms of <strong>the</strong>ir economic and livelihood sources consisting mainly of traditionalfarming and fishing, and (b.) <strong>the</strong> indigenous people were likewise found to be highlyvulnerable in terms of <strong>the</strong>ir health in <strong>the</strong> event of aberrant wea<strong>the</strong>r conditions. The IP’s loweducational attainment coupled with unstable, albeit, subsistence level income make <strong>the</strong>irability to cope with <strong>the</strong> effects of climate change minimal and insufficient to surmount <strong>the</strong>adverse effects of extreme wea<strong>the</strong>r conditions. Results fur<strong>the</strong>r show that <strong>the</strong> analyticalframework for estimating vulnerabilities tend to underestimate <strong>the</strong> true vulnerability valuesbecause of <strong>the</strong> absence of more information that can be used to enhance <strong>the</strong>se estimates.Keywords: vulnerability, climate change, indigenous peopleIntroductionClimate change are events associated with <strong>the</strong> increase in global temperature, changes inprecipitation pattern, occurrence of extreme events and increase in sea level (PCARRD, 2009).Modern science has determined that this phenomenon is caused by carbon emissions broughtabout by contemporary human activities. Molles (2005) reported that humans have exploitedtropical rainforest for many years through a mixture of hunting and ga<strong>the</strong>ring and shiftingagriculture. The country’s contribution to <strong>the</strong> global greenhouse gas emissions as a cause ofclimate change may be insignificant as compared with those of <strong>the</strong> more developed nations butbecause of <strong>the</strong> archipelagic topography of <strong>the</strong> Philippines, it is highly vulnerable to <strong>the</strong>damaging direct and indirect impact of climate change. The Asian Development Bank, forinstance, estimated that <strong>the</strong> mean cost of climate change for <strong>the</strong> Philippines is about 6.7% ofcombined gross domestic product each year by 2100. In fact, some parts of <strong>the</strong> country are345
E-International Scientific Research JournalISSN: 2094-1749 Volume: 2 Issue: 4, 2010already feeling <strong>the</strong> adverse effects of climate change to <strong>the</strong> food, water and energy supply aswell as to <strong>the</strong>ir health conditions.Eakin (2008) defined vulnerability as a susceptibility of populations, resources andplaces to harm associated with <strong>the</strong> global environment changes or climate change. It isbelieved that <strong>the</strong> disadvantage groups of people are more vulnerable to <strong>the</strong> great risks of <strong>the</strong>climate change than <strong>the</strong> more advantaged one. In <strong>the</strong> Philippines, <strong>the</strong> Indigenous Peopleusually belong to <strong>the</strong> former group who may be susceptible to <strong>the</strong> environment changes. Theyusually live in <strong>the</strong> rural environs and are mostly doing traditional agriculture. According toMacchi, et al (2000), people who live in marginal lands whose livelihoods are highlydependent on natural resources are among <strong>the</strong> most vulnerable to climate change. This issupported by <strong>the</strong> study of Gunter, Rahman and Rahman (2008) who stressed that <strong>the</strong>indigenous people’s individual capability to adapt climate change is determined by manyfactors such as poverty, landlessness and illiteracy.Vulnerability is an often used term in relation to <strong>the</strong> potential of groups of people to beadversely affected by climate change. However, to date, we find no uniformity in terms of howthis phenomenon is actually measured. Eakin (2008), Macchi et al. (2000) and Gunter et al.(2008) are but a few examples of researchers who measured <strong>the</strong> vulnerability in different ways,usually, by inferring from <strong>the</strong> current situations of <strong>the</strong> people in relation to <strong>the</strong> degree to which<strong>the</strong>y are exposed to <strong>the</strong> manifestation of climate change. The need to establish, scientifically, acommon understanding of <strong>the</strong> term “vulnerability” is urgent since only when such isaccomplished can strategies be formulated to reduce people’s vulnerability to climate change.This study attempted to determine <strong>the</strong> vulnerability to <strong>the</strong> IPs in Zamboanga del Norte toclimate change in terms of its health and economic impact to <strong>the</strong>m using a scientificallyderived index of vulnerability.Materials and MethodsThe descriptive method of research was used in this study. The study was conducted inMutya, Dapitan, Katipunan, Sindangan, Siayan, Salug and Gutalac, Zamboanga delo Nortew<strong>here</strong> <strong>the</strong>re are a number of Subanen, and Muslim residents. T<strong>here</strong> were 160 Subanen and 40Muslim respondents of this study. In – depth narratives, structured interviews, and <strong>the</strong>researchers’ observation document <strong>the</strong> health and livelihood practices of <strong>the</strong> respondents.The quantitative framework for <strong>the</strong> computation of vulnerability is as follows:V = (R + E – C) / 2; w<strong>here</strong> R stands for risk, E stands for exposure, C stands forcoping.Risk is defined as <strong>the</strong> “expected loss” should an event occur. It is computed as <strong>the</strong>product of <strong>the</strong> probability that an event will occur and <strong>the</strong> value of <strong>the</strong> random variable inquestion:R = Expected (loss) = P (event happens) x P (no individual is affected) + P (event doesnot happen) x P (effects are noted) = P (1-p E ) + (1-p) (p E )Note <strong>the</strong> similarity of <strong>the</strong> risk formula with <strong>the</strong> “variance” of a binomial randomvariable. However, while <strong>the</strong> variance of a binomial random variable is maximized with avalue of 0.25, <strong>the</strong> formula above is maximized when its value is 1 (i.e. 100% risky)346
E-International Scientific Research JournalISSN: 2094-1749 Volume: 2 Issue: 4, 2010Exposure, on <strong>the</strong> o<strong>the</strong>r hand, is an estimate of how much (in terms of percentage) in<strong>the</strong> population is actually going to be affected by <strong>the</strong> event. In <strong>the</strong> formulation above, this issimple p E .Coping refers to <strong>the</strong> percentage of <strong>the</strong> population able to resist <strong>the</strong> effect of an eventdue to <strong>the</strong>ir peculiar characteristics. If <strong>the</strong> desirable characteristics (those which enable <strong>the</strong>population to resist <strong>the</strong> effects of an event e.g. education, financial stability etc.) havepercentages p 1 , p 2 ,…,pn, <strong>the</strong>n:ResultsC = p 1 p 2 ..p n .Profile of <strong>the</strong> Respondents. Table 1 shows <strong>the</strong> profile of <strong>the</strong> respondent that wouldsituate <strong>the</strong>m in relation to <strong>the</strong>ir ability to adopt to climate change on extreme wea<strong>the</strong>rcondition.For all practical purposes, <strong>the</strong> respondents are mainly belonging to <strong>the</strong> Subanen tribesince <strong>the</strong>y constitute 80% of <strong>the</strong> bulk of respondent. The socio – demographic characteristicsof <strong>the</strong>se respondents that imagine on <strong>the</strong>ir ability to cope with <strong>the</strong> effects of climate changeinclude: (a) <strong>the</strong>ir level of education which, as data would show, is mainly elementary level ornone at all (63%), (b) <strong>the</strong>ir livelihood or source of income which is vary traditional farming(82%), (c) <strong>the</strong>ir income averaging P 3,000 per month which could be as low as P500 to as highas P12,000 per month, and (d) <strong>the</strong>ir age with a mean of 41 (relatively young) and a standarddeviation of 9.5 years.Table 1. Profile of <strong>the</strong> RespondentA. Tribe Number Percentage• Subanen16080%• Kalibogan4020%Total 200 100%B. Gender Number Percentage• Male10854%• Female9246%Total 200 100%C. Education Number Percentage• Elementary11859%• High School5628%• College Graduate189%• No Schooling84%Total 200 100%347
E-International Scientific Research JournalISSN: 2094-1749 Volume: 2 Issue: 4, 2010D. Religion Number Percentage• Roman Catholic13266%• Islamic4020%• Paatan (Indigenous)189%• Protestant105%Total 200 100%E. Livelihood / IncomeNumberPercentageSource• Farming16482%• Fisherman126%• OFW Remittance2010%• O<strong>the</strong>r (Driver/ Brgy.42%Official)Total 200 100%F. O<strong>the</strong>rs• Age• Income• Mean: 41• Median: P 3,100• SD: 9.5 years• SD: P 1,900Healthy Vulnerability Estimation. Table 2 shows <strong>the</strong> leading causes of morbidity for<strong>the</strong>se IP’s. While <strong>the</strong> leading cause of morbidity in all <strong>the</strong> areas is headache/ fever, this cause isnon – informative since headache / fever are asymptomatic of o<strong>the</strong>r more serious diseases e.g.dengue fever, typhoid fever. The available data, however, did not indicate <strong>the</strong> diseasesassociated with <strong>the</strong> fever / headache symptoms. We assume (although a debatable point) thatall <strong>the</strong>se cases referred to in <strong>the</strong> health centers with fever/ headache suffer from one of <strong>the</strong>diseases with flu-like symptoms.Table 2. Leading causes of morbidityDiseasesPlaces (Estimated Average Number of Cases per month) - 2009Sigayan Buenasuerte Miatan Mande Munoz Cocob MucasHead ache/fever 20 25 20 15 25 20 15hypertension 2 2 3 4 2 2 4Diarrhea 10 12 10 10 15 14 10Upper RespiratoryTract Infection (URTI) 5 6 6 4 7 6 15/TB/ARI/BronchitisAbdominal Pain/Peptic 7 8 7 6 6 6 9UlcerSource: Health Centers (Estimated average value)Risk. Auxiliary data from <strong>the</strong> PAG – ASA (2010) revealed that, in <strong>the</strong> last five years,massive flooding (unusual amount of rainfall) and periods of drought (high temperature348
E-International Scientific Research JournalISSN: 2094-1749 Volume: 2 Issue: 4, 2010coupled with low rainfall) occurred in <strong>the</strong> Subanen areas at least twice (2) so that estimates of<strong>the</strong> probability of climate change can be computed as figures over <strong>the</strong> last five years.The National Census and Statistics Office (NCSO-9., 2010) also provided informationin <strong>the</strong> population of Subanen as 2,100 as of 2009. Thus:It follows that an estimate of health risk due to <strong>the</strong> effects of climate for this sector is:RiskExposure. The computation for <strong>the</strong> estimate of exposure rate is simply:Exposure = P h = .1610 or 16.10%Coping. In order to estimate <strong>the</strong> coping mechanisms (in percentage) of <strong>the</strong> Subanen, weexamine <strong>the</strong> socio – demographic pursued characteristic that impact directly on <strong>the</strong>ir health andhealth case such as: (a) education, (b) age, and (c) financial stability.Hence, Health Vulnerability Index = 43.22% + 16.10% - 1.30% = 29%349
E-International Scientific Research JournalISSN: 2094-1749 Volume: 2 Issue: 4, 2010The health vulnerability index (HVI) shows that more than one fourth (29%) IP’s(Subanens) will be vulnerable to <strong>the</strong> effect of climate change (droughts, severe heat, floods,excessive rainfall) in terms of <strong>the</strong>ir health.DiscussionsThe health risks (expected health loss) are amplified by <strong>the</strong> recent higher incidence(40%) of <strong>the</strong>ir flooding or drought which are just two of <strong>the</strong> possibly several climatologicalabenetions brought about by climate change in <strong>the</strong> province. Under normal conditions, amorbidity prevalence rate (MPR) is estimated at only 16.10% but this figure dramaticallyincrease to 51.02% (or 51%) with <strong>the</strong> recent spate of ei<strong>the</strong>r heavy rainfall or lack of it.Although we have not imputed into <strong>the</strong> health risk computations made, <strong>the</strong> health riskfigure used even go higher when <strong>the</strong> sanitation practices, health care practice and o<strong>the</strong>r ritualsof <strong>the</strong> tribe are factored in. To provide an insight into just how much <strong>the</strong> health risk figures caninflate with <strong>the</strong>se fur<strong>the</strong>r considerations, we conducted a interviews and en situ visits to <strong>the</strong>places mentioned in this paper.Health Care practicesWhen <strong>the</strong>y were asked about <strong>the</strong>ir practices whenever <strong>the</strong> members of <strong>the</strong>ir family getsick, <strong>the</strong> Subanen usually prescribed with <strong>the</strong>ir own based on <strong>the</strong>ir intuition. They used herbalmedicines for this purpose. If ever <strong>the</strong> sickness is not healed, <strong>the</strong>y consulted <strong>the</strong> “Balyan” <strong>the</strong>quack doctor. Simultaneously, <strong>the</strong>y asked for medicines from <strong>the</strong> Botika sa Barangay. If ever<strong>the</strong> sickness becomes complicated, this is <strong>the</strong> time w<strong>here</strong> <strong>the</strong>y consult a doctor. Since <strong>the</strong>Kalibogan are mostly residing in lowland areas, <strong>the</strong>y are very accessible to <strong>the</strong> health centers.They used to consult <strong>the</strong> health center if <strong>the</strong> diseases are common only. If ever complicated,<strong>the</strong>y went directly to <strong>the</strong> hospital.Sanitation PracticesGarbage Disposal. More <strong>the</strong> one half or fifty two percent of <strong>the</strong> respondents threwgarbage at <strong>the</strong> back of <strong>the</strong>ir houses, twenty four percent burned <strong>the</strong> garbage, sixteen usedcompost pit and eight percent thrown to <strong>the</strong> river or to <strong>the</strong> sea.350
E-International Scientific Research JournalISSN: 2094-1749 Volume: 2 Issue: 4, 2010Food preparation and preservation. Since almost all of <strong>the</strong> respondents have norefrigerators, <strong>the</strong>y only used salt, sunlight and concentrated vinegar in <strong>the</strong> preservation offoods. They usually prepared salted fish (tinabal) and dried fish (bulad). Most of <strong>the</strong> time, <strong>the</strong>ycooked <strong>the</strong> fish with concentrated vinegar (paksiw) and <strong>the</strong> meat (adobo). This is <strong>the</strong>traditional way of food preservation practiced during <strong>the</strong> absence of electricity.Garbage disposed at <strong>the</strong> back of <strong>the</strong> houseAccessibility to Health Facilities and Health PersonnelComport rooms. Among <strong>the</strong> 160 Subanen respondents, sixty one of <strong>the</strong>m used a simpleclosed pit comport room; twenty six percent had water sealed and thirteen percent had none. Itwas noted that <strong>the</strong> simple closed pit comport rooms are unsanitary since <strong>the</strong>y are not well –constructed. Some were provided with toilet bowls by <strong>the</strong> Department of Health as part of itssanitary program. In o<strong>the</strong>r municipalities, <strong>the</strong> residents were asked to pay P50 for <strong>the</strong> bowl todefray expense. But only very few had availed of it. They said <strong>the</strong>y cannot afford to pay <strong>the</strong>bowl even at P50.00.To motivate <strong>the</strong> Subanen to construct a comport room and to maintain <strong>the</strong> cleanlinessof <strong>the</strong>ir surrounding, <strong>the</strong> Department of Health through its Midwives with <strong>the</strong> cooperation of<strong>the</strong> local government, gave rewards to <strong>the</strong> households that maintained cleanliness. When <strong>the</strong>rewere unannounced inspections, <strong>the</strong> health workers were surprised because of very cleancomport rooms. It turned out that <strong>the</strong>se were for inspection only. Most of <strong>the</strong>m still defecate in<strong>the</strong> open field usually at <strong>the</strong> back of <strong>the</strong>ir houses. According to a midwife of Sigayan, Dapitan“Almost all <strong>the</strong> time, she reprimanded <strong>the</strong>se people especially <strong>the</strong> children to use <strong>the</strong> comportrooms but <strong>the</strong>y can hardly understand”. Most of <strong>the</strong> respondents said, <strong>the</strong>y can hardly use <strong>the</strong>comfort rooms because <strong>the</strong>y are far from <strong>the</strong> source of water. Majority of <strong>the</strong> thirteen percentwho have no comfort rooms were residing at <strong>the</strong> hilly areas and far from <strong>the</strong> poblacionbarangays.351
E-International Scientific Research JournalISSN: 2094-1749 Volume: 2 Issue: 4, 2010The presence of <strong>the</strong> health workers in every barangay has contributed a lot tot heawareness of <strong>the</strong> IP’s in terms of sanitation. Compared to <strong>the</strong>ir situations a couple of decadesago, almost all of <strong>the</strong> IP’s knew already <strong>the</strong> importance of sanitation. Although some of <strong>the</strong>mhave poor houses but <strong>the</strong>y are not as untidy as long years ago. This could be due to a seriousintervention of <strong>the</strong> Department of health.However, <strong>the</strong>ir access to water facilities plays a very important role in <strong>the</strong>ir personaland community hygiene. Since, some of <strong>the</strong>m are far from <strong>the</strong> source of water; <strong>the</strong> sanitation athome is greatly affected. In fact, during <strong>the</strong> immersion, most of <strong>the</strong> family members especiallychildren had not taken a bath. They were affected with <strong>the</strong> long drought w<strong>here</strong> <strong>the</strong> spring as <strong>the</strong>source of water was dried. The river became a substitute for drinking water. This situationmade <strong>the</strong>m more susceptible to diseases as an indirect impact of <strong>the</strong> mentioned phenomenon.The kalibugan respondents on <strong>the</strong> o<strong>the</strong>r hand had different sanitation practices. Morethan 30% of <strong>the</strong>m defecated along <strong>the</strong> river or <strong>the</strong> sea. Their culture of spitting anyw<strong>here</strong> made<strong>the</strong>m susceptible to respiratory tract diseases which would eventually weaken <strong>the</strong>ir immunesystem. With this, any change in <strong>the</strong> climate could directly affect <strong>the</strong>m so t hat, at least, thiscould not be identified as a potential source of health problems for <strong>the</strong> tribe.Water supplyOut of seven barangays under study, four of <strong>the</strong>m have already access to waterfacilities. The barangays have already faucets but are not yet connected to <strong>the</strong> individualhouses. But still many of <strong>the</strong> respondents are not accessible to this facility because <strong>the</strong>y areresiding in <strong>the</strong> remote part of <strong>the</strong> barangay. This year’s EL Nino phenomenon had devastatingimpacts to <strong>the</strong> IPs.Poor access to water results to poor sanitation and hygiene. The distance to potablewater among <strong>the</strong> respondents results in tremendous human and economic costs. Inadequatewater supply could discourage everyone to practice proper personal hygiene which would <strong>the</strong>nresult to <strong>the</strong>ir susceptibility to diseases. Although, <strong>the</strong> diseases present in <strong>the</strong> barangay arenormal and have not yet been an outbreak but still <strong>the</strong> people are considered vulnerable toclimate condition. The productive activities of poor rural people, such as schooling andfarming, are affected by <strong>the</strong> time and energy spent fetching water. In fact, in 2002, 21% of <strong>the</strong>people living in developing countries did not have sustained access to an improved watersource and 51% did not have access to improved sanitation (Frankson, 2009). That is why, <strong>the</strong>World Health Organization in its Vision 2030 study concluded that climate change is widelyperceived as a threat than opportunity. Thus, “systematic assessments of <strong>the</strong> climate changeresilience of all utilities and of rural water and sanitation programmes are needed” (WHO2009).352
E-International Scientific Research JournalISSN: 2094-1749 Volume: 2 Issue: 4, 2010Water system as project of <strong>the</strong> Local Government UnitDifferent sources of water in a barangayEducations and financial stability are two main factors that greatly improve <strong>the</strong> IP’schance of coping with sudden and unexpected wea<strong>the</strong>r observations. However, both factorsappear to be very low for <strong>the</strong> Subanens whose model education is elementary or even, withouteducation at all and whose mean income per month is way below <strong>the</strong> poverty threshold. Here,government intervention is extremely necessary viz. provide free access to adult literacyeducation programs for <strong>the</strong> IP’s with particular attention to health and science, and livelihoodeducation programs.Economic Vulnerability Estimates for <strong>the</strong> IP’sEconomic Risk Estimates. The wea<strong>the</strong>r / climate parameters are <strong>the</strong> same as beforewith p = 0.40 and (1 - p) = 0.60. Since <strong>the</strong> main source of livelihood is agriculture and fishing,we estimate to preparation of individuals engaged in <strong>the</strong>se two activities:353
E-International Scientific Research JournalISSN: 2094-1749 Volume: 2 Issue: 4, 2010Hence, Economic Risk = P(1 - P E ) + (1 - P)(P E ) = (0.40)(.12) + (.60)(.88) 57.60%Economic Exposure. The exposure estimate is simply P E = 0.88 or 88%.Coping. The index of economic ability to cope will be <strong>the</strong> product of <strong>the</strong> followingfactors:(a) percentage of individual with income higher than P 6,000 or <strong>the</strong> poverty threshold(P h ) and (b) <strong>the</strong> percentage of individual with secondary or higher education (P 1 ) and <strong>the</strong>refore,potentially economically productive:P 1 = Percentage of Subanen Families with income greater than equal to P 6,00= 0.05 or 5%P 1 = Percentage of Subanen with secondary or higher education= .28 + .09 = .37 or 37%Hence, Economic Vulnerability = 57.60% + .88% - 37% = 75.6%As expected, <strong>the</strong> IP’s have a very high economic vulnerability index of 75.6%, that is,more than three quantities of <strong>the</strong> IP’s are in danger of losing <strong>the</strong>ir means of livelihood (andhence, income) should severe wea<strong>the</strong>r disturbance prevent.DiscussionsThe high economic vulnerability index found for this particular group of IP’s can beattributed mainly to <strong>the</strong> fact that almost all <strong>the</strong> families depend on traditional farming andfishing for <strong>the</strong>ir livelihood source. Traditional farming, as a rule, is highly dependent on <strong>the</strong>climatological conditions in <strong>the</strong> province. Too little rain (during drought) has <strong>the</strong> potential togreatly reduce farm yields; too much rain, on <strong>the</strong> o<strong>the</strong>r, can wreck havoc on <strong>the</strong> crops plantedby <strong>the</strong> farmers.Corollarily, <strong>the</strong>re is a need to buttress <strong>the</strong> coping mechanisms for this group in <strong>the</strong>event of aberrant wea<strong>the</strong>r disturbances e.g. find alternative attainment of must at to IP’s hinder<strong>the</strong> search for such alternatives.Agriculture was <strong>the</strong> major occupational choice of Subanen almost one hundred percentof <strong>the</strong> respondents depending on it for <strong>the</strong>ir livelihood. The major agricultural crops grownwere corn and root crops. In o<strong>the</strong>r areas w<strong>here</strong> <strong>the</strong> Hi – Green program of <strong>the</strong> Department ofAgriculture is active, <strong>the</strong> respondents produced vegetables such as eggplants, cabbage, andampalaya. (The Hi – Green is a joint program of <strong>the</strong> Provincial Government and <strong>the</strong>Department of Agriculture which encourages farmers to plant vegetables using organicfertilizer).354
E-International Scientific Research JournalISSN: 2094-1749 Volume: 2 Issue: 4, 2010The kaingin system of farming in <strong>the</strong> Municipality of SiayanRegarding <strong>the</strong> sufficiency of production, seventy percent of <strong>the</strong> respondents weresuffering food deficiency for a couple of months due to a long drought or EL Nino. Besides,<strong>the</strong>ir geographical location is a factor of a minimum production. In <strong>the</strong> municipality of Siayan,<strong>the</strong> terrain is hilly and <strong>the</strong> soil is not fertile. Only few areas can be planted with corn in which<strong>the</strong> farmers are compelled to apply commercial fertilizer to increase production. Some of <strong>the</strong>mcomplained that <strong>the</strong>y cannot leave <strong>the</strong>ir land unfertilized with inorganic fertilizer or else <strong>the</strong>production will sacrifice. The application of fertilizer is not also a guarantee of high productiondue to poor soil condition.The Subanen’s traditional farming practices (<strong>the</strong> slash and burn farming) aggravated<strong>the</strong> situation of decreasing production and income. They believe that continuous adopting <strong>the</strong>“kaingin” system of farming may harm <strong>the</strong> environment. But <strong>the</strong>y cannot avoid it because <strong>the</strong>yare very much dependent in this type of livelihood. In fact, during <strong>the</strong> immersion, <strong>the</strong>researchers documented few cases of kaingin.When <strong>the</strong> respondents were asked about <strong>the</strong> effects of <strong>the</strong> climate change to <strong>the</strong>irlivelihood, <strong>the</strong> following are <strong>the</strong>ir answers:If <strong>the</strong>re is a long drought, everybody isaffected because <strong>the</strong>ir livelihood is a climatesensitive one. The respondents said that <strong>the</strong>irharvest cannot suffice to support <strong>the</strong>m. Ineffect, root crops become <strong>the</strong>ir staple food.However, few of <strong>the</strong>m still have experiencedshortage even in root crops. This situationprompted <strong>the</strong>m to eat a wild and poisonousroot crop called “Kubong”. Ano<strong>the</strong>r solutionfor <strong>the</strong> food storage is to work as a farmlabourer in o<strong>the</strong>r farms. The P100 a day isalready a big help to <strong>the</strong> family.”Kubong – an alternative food during famineThe long rainy season (La Nina) on <strong>the</strong> o<strong>the</strong>r hand affect <strong>the</strong> livelihood of <strong>the</strong> IPsparticularly Subanen farmers. Since agricultural products are perishable, continuous rain canrotten <strong>the</strong> produce which eventually decreases <strong>the</strong>ir quality. Their sidline as farm labourer of355
E-International Scientific Research JournalISSN: 2094-1749 Volume: 2 Issue: 4, 2010o<strong>the</strong>r farms is also affected. The farming activity is usually stopped when it is raining. As ameans of survival, <strong>the</strong> root crops serve as alternate to cereals as staple food.This phenomenon has also an indirect impact tot he fishermen whose long hours infishing under <strong>the</strong> rain could weaken <strong>the</strong> immune system in <strong>the</strong>ir bodies and would eventuallysusceptible to lung – related diseases.Majority of <strong>the</strong> Kalibogan respondents on <strong>the</strong> o<strong>the</strong>r hand are not so vulnerable toclimate change in terms of livelihood because most of <strong>the</strong>m are not dependent on naturalresources as a source of living. They have allotments from <strong>the</strong>ir family members workingabroad as a source of income. Although, few of <strong>the</strong>m claimed to be farmers but not all <strong>the</strong> time<strong>the</strong>y till <strong>the</strong> land <strong>the</strong>y own. They have tenants to do <strong>the</strong> dirty jobs. Only <strong>the</strong> fishermen weremore vulnerable to climate change because of <strong>the</strong>ir exposure to <strong>the</strong> sea night and day.Both <strong>the</strong> El Nino and La Nina as climate cjange induced hazards could havedevastating impacts to <strong>the</strong> Subanen lives and livelihood. The El Nino phenomenon affected somuch to <strong>the</strong> famers because <strong>the</strong>y cannot plant some cash crops like corn and vegetablesbecause upland farming is too much dependent on <strong>the</strong> rainfall in which any change in airtemperature can result to a change in climate conditions resulting in <strong>the</strong> shift in Agriculturepattern (Lama and Devkok, 2009). This pointed out that <strong>the</strong> Subanen group of IPs are morevulnerable to climate change than <strong>the</strong> Kalibogan. Heltberg, Siegel and Jorgensen (2008)stressed that <strong>the</strong> most vulnerable households are those with assets and livelihood exposed andsensitive to climate risk and who have weak management capacity. The poorer household are<strong>the</strong> most at risk. Besides Rai (2008) found out that <strong>the</strong> Indigenous People are oftendisproportionally adversely affected because <strong>the</strong>y are amongst <strong>the</strong> poorest people globally andare heavily depended on and resources for basic needs and livelihood. This confirmed <strong>the</strong>study of National Adaptation Program for Action (NAPA) of Sudan who identified <strong>the</strong>Agriculture, water resources and health as <strong>the</strong> sectors most vulnerable to climate change(ZAkieldeen, 2009).on <strong>the</strong> o<strong>the</strong>r hand, <strong>the</strong> La Nina is associated with continuous rain. Ingeneral, floods damage standing agricultural crops and may also carry away <strong>the</strong> top soilmaking <strong>the</strong> land barren. Floods damage all immovable properties that get submerged in floodwaters. Any o<strong>the</strong>r properties which cannot removed to safer places during floods are alsodamaged.References:Gunter, B. G., A. Rahman and A. F. Rahman (2008). How Vulnerable are Bangladesh’sIndigenous People to Climate Change? Bangladesh Development Research Working PaperSeries. Http://www.bangladeshstudies.orgLama, S. And B. Devkota (2009). Vulnerability of Mountain Communities to Climate Changeand <strong>the</strong>ir Adaptation Strategies. Journal of Agriculture and Environment. Volume 10.Linachan, E. N. (2009). Indigenous peoples of Ifugao: responding to climate change. Earth andEnvironmental Science. IOP Publishing Ltd. Manila.Macchi, et al, (2008).Indigenous and Traditional Peoples and Climate Change. IUCN.356
E-International Scientific Research JournalISSN: 2094-1749 Volume: 2 Issue: 4, 2010Molles, M.C. Jr. 2005. Ecology: Concepts and Applications, 3 rdCompanies, Inc.edition. Mc Graw HillPCCARD, 2009. Philippines S&T Agenda on Climate Change. www.PCCARD.GOV.PHRai, N. 2008. Indigenous People and Climate Change: High Vulnerability and UniqueChallenges. Social Dimensions of Climate Exchange Workshop. World Bank, WashingtonD.C.Rawlins, S. C., A. Chen, J.M. Rawlins, D. Chades and G. Legal. 2007. A Knowledge, Attitudeand Practices Study of <strong>the</strong> Issued of climate change/variability impacts and public health inTrinidad, Tobago. St. Kitts and Nevis. West Indian Medical Journal. Vol. 56, No.2 West IndianMedical Journal. ISSN 0043 – 3144;Zakieldeen. S.A. (2009). Adaptation to Climate Change: A Vulnerability Assessment forSudan. Gatekeeper. Iied357
E-International Scientific Research JournalISSN: 2094-1749 Volume: 2 Issue: 4, 2010HARMFUL ALGAL BLOOM OCCURRENCE INMURCIELAGOS BAYAMIDST CLIMATE CHANGEJ. Aquino, B. Flores and M. NaguitJose Rizal Memorial State University – Katipunan Campus, Katipunan, Zamboanga del NorteJose Rizal Memorial State University – Main Campus, Dapitan CityJose Rizal Memorial State University – Katipunan Campus, Katipunan, Zamboanga del NorteAbstractThe phytoplankton species abundance in Murceilagos Bay was investigated for <strong>the</strong> firsttime at <strong>the</strong> onset of an outbreak on September, 2009. Monthly monitoring on Pyrodiniumbahamense var. compressum densities and physic-chemical parameters were conducted at 12sampling stations in Murceilagos Bay. Generally, densities of Pyrodinium bahamense var.compressum were decreasing. Nutrient analyses showed traces of phosphates and nitrates.Keywords: Phytoplankton, Hydrobiological surveys, Density, ENSO, Cove, Toxic Algal BloomIntroductionPractically every coastal country worldwide is affected by harmful algal blooms (HABs,commonly called “red tides”). This phenomenon includes blooms of toxic, microscopic algaethat lead to illness and death in humans, fish, seabirds, marine mammals, and o<strong>the</strong>r oceaniclife. T<strong>here</strong> are also non-toxic HABs that cause damage to ecosystems, fisheries resources, andrecreational facilities. The term “HAB” also applies to non-toxic macroalgae (seaweeds),which can cause major ecological impacts such as <strong>the</strong> displacement of indigenous species,habitat alteration and oxygen depletion in bottom waters.Several decades ago, relatively few countries were affected by HABs, but now mostcoastal countries are threatened, in many cases over large geographic areas and by more thanone harmful or toxic species (Anderson, 1989; Hallegraeff 1993). The causes behind thisexpansion are deliberated, with possible explanations ranging from natural mechanisms ofspecies dispersal and enhancement (e.g., climate change) to a host of human-relatedphenomena such as pollution-related nutrient enrichment, climatic shifts, or transport ofalgal species via ship ballast water (Anderson, 1989; Smayda, 1989; Hallegraeff, 1993).Whatever <strong>the</strong> reasons, coastal regions throughout <strong>the</strong> world are now subject to anunprecedented variety and frequency of HAB events.According to Anderson (1989), Smayda (1990) and Hallegraeff (1993), in recent years,a dramatic expansion in <strong>the</strong> areas affected by PSP toxins has occurred throughout <strong>the</strong> world.A similar pattern applies to many of <strong>the</strong> o<strong>the</strong>r HAB types. Disagreement only arises withrespect to <strong>the</strong> reasons for this expansion.Many have implicated that pollution or o<strong>the</strong>r humanactivities are involved, and this is indeed a factor in some areas, however, many of <strong>the</strong> “new”or expanded HAB problems have occurred in waters w<strong>here</strong> pollution is not an obvious factor.The organisms responsible for HABs have been on earth for thousands or even millions of358
E-International Scientific Research JournalISSN: 2094-1749 Volume: 2 Issue: 4, 2010years, during which time <strong>the</strong>y had ample opportunities to disperse, assisted by changingclimate, movement of tectonic plates, and o<strong>the</strong>r global changes.In <strong>the</strong> Philippines, algal blooms have been reported since 1908. The first recordedoccurrence of blooms of Pyrodinium bahamense var. compressum, a toxin-producingdinoflagellate was in 1983 in central Philippines, (Estudillo and Gonzales, 1984). Apparently,harmful algal blooms in <strong>the</strong> country, particularly Pyrodinium have expanded both in time andspace (Bajarias and Relox, 1996; Corrales and Gomez,1990). Blooms of Pyrodinium spreadto around 22 coastal areas of <strong>the</strong> country. Paralytic shellfish poisoning due to Pyrodinium hasincreased in severity during <strong>the</strong> last two decades. The country has experienced more than 40outbreaks of harmful algal blooms with subsequent shellfish poisoning episodes between 1983and 2002. However, most of <strong>the</strong> blooms have not been documented. Narrative of local folks ofwater discoloration in <strong>the</strong> remote coastal areas of <strong>the</strong> country abound, however, have not beenvalidated and documented due to <strong>the</strong> archipelagic nature of <strong>the</strong> country with more than 7,100islands and <strong>the</strong> lack of resources to monitor all <strong>the</strong> coastal waters.HAB incidence in <strong>the</strong> country have been correlated to flash flooding and unpredictablestorm events as a result of climate change which alter <strong>the</strong> phytoplankton communitycomposition (Andersen, 2000). During heavy rainfall, flashfloods occur in which dissolvedphosphate and nitrate flows to <strong>the</strong> bay through creeks. An example is typhoon “Bebeng“ thathit <strong>the</strong> Philippines in _ which triggered <strong>the</strong> HAB growth due to effluents of industrial andagricultural wastes and helped in spreading <strong>the</strong> Pyrodinium bloom along <strong>the</strong> 70 km stretch ofWestern Samar Coastline from Villareal to Gandara Island (Estudillo and Gonzales, 1984;Furio, 2004). Moreover, Usup, et al. (2000) observed that algal blooms usually occurred inearly Southwest Monsoon while highest densities in <strong>the</strong> sediment during <strong>the</strong> Nor<strong>the</strong>astMonsoon suggesting that <strong>the</strong>re is a strong relationship between P. bahamense blooms and localwea<strong>the</strong>r events. The bloom of Pyrodinium bahamense var. compressum has also beencorrelated with higher surface temperatures and salinities (Abuso et.al., 2000). Bajarias andRelox (1996) and Furio (2004) coined <strong>the</strong> blooms of toxic Pyrodinium to follow <strong>the</strong> sequenceof intense warm temperature and heavy rainfall like blooms in Manila Bay that occurred at <strong>the</strong>onset of <strong>the</strong> rainy season after a long dry period. As more research studies are considered inthis view, it is evident that <strong>the</strong>se meteorological events may modify <strong>the</strong> physical and chemicalproperties of <strong>the</strong> water column leading to <strong>the</strong> blooms of P. bahamense especially now that <strong>the</strong>climate is changing from <strong>the</strong> normal occurrence.Recently, Paralytic Shellfish Poisoning had been declared in <strong>the</strong> municipality of Rizal,Zamboanga del Norte and nearby barangay of Sapang Dalaga, Misamis Occidental after tenpersons landed in <strong>the</strong> hospital consuming boiled oyster (scientific name) locally known as“Tagnipis”, with two died due to respiratory failure. The oyster was revealed to have beencollected from Murcielagos Bay. Following <strong>the</strong> event, phytoplankton analysis of <strong>the</strong> seawaterrevealed a very high count of Pyrodinium bahamense indicating a bloom of <strong>the</strong> species, <strong>the</strong>first time ever recorded in Zamboanga del Norte.Murcielagos Bay is located in <strong>the</strong> nor<strong>the</strong>astern side of Zamboanga del Norte (Figure 1).It is approximately 52 square kilometers with total water area of 7854.78 ha (78.5 sq.km) and312.04 ha of islands. It has three major marine ecosystems, sea grass (2674.96 ha), mangroves(785.48 ha) and (27 ha) of marine sanctuary. Inventory of surface water sources showed that<strong>the</strong> coastal area has 25 river systems draining into Murcielagos Bay of which <strong>the</strong> main359
E-International Scientific Research JournalISSN: 2094-1749 Volume: 2 Issue: 4, 2010tributary is <strong>the</strong> Dioyo river of Sapang Dalaga. Three fourths of <strong>the</strong> bay is shallow and itsshoreline is dominated by a muddy substrate lined with patches of mangroves around its base.Depth of <strong>the</strong> water ranges from 0.5-30m in <strong>the</strong> shallow sea and 120m in deep water portion.The Bay has been identified as a rich fishing ground and believed to be one of <strong>the</strong> mostdiversified bays in Mindanao (Microsoft Encarta, 2007). Majority of <strong>the</strong> inhabitants in <strong>the</strong>coastal barangays engaged in fishing and collecting shells as <strong>the</strong>ir means of livelihood.Historical trends of <strong>the</strong> Bay show that in 1940’s to 1970’s, it is rich in fishery resources.Diverse commercial fish were abundant as well as shells, crabs, squids, octopus and prawns.Shellfish have been part of every household dish as <strong>the</strong> primary source of protein to local folksand people of Zamboanga del Norte.Nowadays, mounting evidence links climate change to HAB. Recent studies showedthat dinoflagellate blooms will increase due to increased temperature and salinity stratificationresulting from climate change. This paper evaluates <strong>the</strong> present condition of Murcielagos Bayspecifically, <strong>the</strong> costal areas of Sibutad and Rizal, Zamboanga del Norte to determine whattriggered <strong>the</strong> harmful algal bloom.MethodologySampling. Plankton analyses were collected by suspended vertical tow plankton net of20 µm mesh size at a depth of 1m. Plankton identification and counting were done at JRMSUlab using electric compound microscope with a sedgewick-rafter counting chamber.The cell density was calculated using <strong>the</strong> following formula:N.V 1D (cells/L) = -------------V SW<strong>here</strong>: N = Number of cells in 1mL sample (average of two trials)V 1 = Total volume of <strong>the</strong> plankton sample (mL)V S = Volume of <strong>the</strong> sea water filtered by plankton net within hauling depth (mL)Physico-chemical parameters were also monitored during each survey. Temperaturereadings from predetermined depths were obtained using <strong>the</strong>rmometer. Secondary data on airtemperature and rainfall were also obtained from PAGASA office for comparison. Salinity anddissolved oxygen were also measured using <strong>the</strong> handheld refractometer and DO meterrespectively. Water samples for phosphate and nitrate analyses were also collected and broughtto Silliman University, Dumaguete City.360
E-International Scientific Research JournalISSN: 2094-1749 Volume: 2 Issue: 4, 2010Figure 1. The Murcielagos Bay. Inset is <strong>the</strong> map of Zamboanga del Norte.ResultsA bloom of Pyrodinium bahamense occurred in Murcielagos Bay on September 2009particularly in Barangay Damasing which resulted to a paralytic shellfish poisoning of eightpersons who have eaten an oyster species locally known as Tagnipis which were collectedfrom <strong>the</strong> Bay (BFAR Shellfish Bulletin, May 2010). Based on <strong>the</strong> report of <strong>the</strong> Bureau ofFisheries and Aquatic Resources, “Tagnipis” oyster had <strong>the</strong> highest toxin level of 2746ug/100g shellfish meat (Appendix A). Hence, BFAR declared that shellfish from MurcielagosBay was unfit for human consumption up to this writing (BFAR Shellfish Bulletin, May,2010).This paper presents <strong>the</strong> concentration (cell densities) of Pyrodinium bahamense fromOctober 2009 which was after <strong>the</strong> outbreak till May 2010. As shown in Figure 2, Damasingarea had <strong>the</strong> highest cell density in October, 2009 at 11,000 cells/L, followed by Nangkaarea. The cells were forming chains numbering from 2-22 cells per chain. However, densitiesdropped to as low as 1-5 cells/L from November 2009 till May 2010, except for Sawang inNovember and Calubi and Nangca in May 2010.Figure 2. Densities of Pyrodinium bahamense var.compressum from October 2009to April 2010.Figures 3 and 4 present <strong>the</strong> average temperature and salinity during <strong>the</strong> HAB event.The water temperature ranged from 30°C to 32°C while <strong>the</strong> salinity ranged from 30 ppt to 35ppt. Phosphates and nitrates were
E-International Scientific Research JournalISSN: 2094-1749 Volume: 2 Issue: 4, 2010Figure 3. The Temperature (˚C) values of Murcielagos Bay obtained from September 2009 –May 2010. Legend: Sa-Sawang, Ka-Kanim, Si-Sinipay, Ca-Calubi, La-Lalab, Li-Libay, Pa-Panganoran, Na-Nasipang, Se-Sebaka, Ma-Mabunao, Na-Nangka, Da-Damasing.Discussion and ConclusionSince <strong>the</strong> outbreak in September 23, 2009, densities of vegetative P. bahamensecontinued to be highest in October, 2009 and dropped beginning November 2009.Meteorological data on temperature and rainfall in Zamboanga del Norte from 2007 to 2009(Figures 5a & 5b) revealed a decreasing trend in air temperature. T<strong>here</strong> was a significantdropped of 1.22 ºC in <strong>the</strong> average annual temperature in 2009 (Figure 5, error bars).Figure 4. The Salinity (ppt) Values of Murcielagos Bay obtained from September 2009 – May2010. Legend: Sa-Sawang, Ka-Kanim, Si-Sinipay, Ca-Calubi, La-Lalab, Li-Libay, Pa-Panganoran, Na-Nasipang, Se-Sebaka, Ma-Mabunao, Na-Nangka, Da-Damasing.362
E-International Scientific Research JournalISSN: 2094-1749 Volume: 2 Issue: 4, 2010Table 1. Phosphate and nitrate content in selected sampling stations as of April 2010.Tot weight ofNO3-N/L (mg)Rainfall was higher in 2008 compared in 2007 and 2009. Generally, rainfall wasminimal from January to September 2009 with August as <strong>the</strong> lowest. As observed, <strong>the</strong> month(August 2009) prior to <strong>the</strong> outbreak had a very minimal rainfall followed by an increasedrainfall brought about by typhoon Ondoy. This conforms to <strong>the</strong> observation of Bajarias andRelox (1996) and Furio (2004) w<strong>here</strong>in blooms of toxic Pyrodinium follow <strong>the</strong> sequence ofintense warm temperature and heavy rainfall like blooms in Manila Bay that occurred at <strong>the</strong>onset of <strong>the</strong> rainy season after a long dry period.a) Monthly temperature and rainfallTot weight of PO4-P/L (mg)Damasing 0.127 0.01Sebaca 0.012
E-International Scientific Research JournalISSN: 2094-1749 Volume: 2 Issue: 4, 2010Figure 5. Monthly (a) and mean annual (b) rainfall and air surface temperature takenfrom 2007- January 2010 (PAGASA).Moreover, it should be noted that September and October were also <strong>the</strong> southwestmonsoon months (June to October). This implies that <strong>the</strong> outbreak of Pyrodinium bahamensevar.compressum in Rizal, Zamboanga del Norte in late September 2009 could also beattributed to <strong>the</strong> local wea<strong>the</strong>r events. Usup, et al. (2000) observed that algal blooms usuallyoccurred in early Southwest Monsoon while highest densities in <strong>the</strong> sediment during <strong>the</strong>Nor<strong>the</strong>ast Monsoon suggesting that <strong>the</strong>re is a strong relationship between P. bahamenseblooms. Hence, <strong>the</strong> combined effects of typhoon and local wea<strong>the</strong>r events as influencedindirectly by <strong>the</strong> global changing climate affected <strong>the</strong> physico-chemical conditions of <strong>the</strong>coastal waters of Rizal and Sibutad, Zamboanga del Norte triggered <strong>the</strong> harmful algal bloomof Pyrodinium bahamense var.compressum.ReferencesAbuso, Zenaida V. , Leah Mora T. Cabella and Luisa C. Tuazon. 2001.Red Tide Monitoring inMaqueda and Villareal Bays Samar, Central Philippines ASEAN Marine EnvironmentalProceedings of <strong>the</strong> Fourth ASEAN-CANADA Technical Conference On Marine Science.Andersen, D. M. 2000.Monitoring and Management Strategies For Harmful Algal Blooms InCoastal Waters Asia Pacific Economic Program, Singapore and IntergovernmentalOceanographic Commission Technical Series No. 59.Bajarias, Fe Farida A. 2001. Distribution of Marine Dinoflagellates in <strong>the</strong> Philippines ASEANMarine Environmental Proceedings of <strong>the</strong> Fourth ASEAN-CANADA Technical Conference onMarine Science.Borja, Valeriano M. and Elsa F. Furio. 2004. Collection of Samples for Paralytic ShellfishPoisoning Monitoring Practical Guide On Paralytic Shellfish Poisoning Monitoring in <strong>the</strong>Philippines.Deauna, Melecio C. and Salvacion Lindio Dorado. 1999. Environmental Science for PhilippineSchools Phoenix Publishing House, Inc.DENR Administrative Order 2008 – XX. Water Quality Guidelines and General EffluentStandards.Fulgueras, Virgilio P. Elsa F. Furio and Valeriano M.Borja. 2004. Biological And EcologicalNature of Paralytic Shellfish Poisoning Causative Dinoflagellates Practical Guide on ParalyticShellfish Poisoning Monitoring in <strong>the</strong> Philippines Revised Edition.364
E-International Scientific Research JournalISSN: 2094-1749 Volume: 2 Issue: 4, 2010Furio, Elsa F. and Cielito L. Gonzales. 2004. Toxic Red Tide and Paralytic Shellfish PoisoningProfiles In <strong>the</strong> Philippines Practical Guide On Paralytic Shellfish Poisoning Monitoring In ThePhilippines Revised Edition,.Microsoft Encarta. 2007 Murcielagos Bay, Philippines. New York: Microsoft Incorporated.Microsoft Encarta. 2009. Climate Change, Philippines. New York: Microsoft Incorporated.Michael, David & Amit, Pandya. 2010 Coastal Zones and Climate Change. OceanographicCommission Technical Series.Montojo,Ulyses, Norvida L. Cruz , Mirriam A. Formeloza and Dennis N. Candia. 2004Chemical and Pharmacological Properties Of Paralytic Shellfish Toxins Practical Guide OnParalytic Shellfish Poisoning Monitoring In The Philippines Revised Edition.Odum, Eugene P. Fundamentals of Ecology. Saunders International Student Edition.Relox, Jun R. Jr. 2004Plankton Analysis Practical Guide On Paralytic Shellfish PoisoningMonitoring In <strong>the</strong> Philippines Revised Edition.Relox, Juan R.,Jr. and F. Farida A. Bajarias. Harmful algal blooms (habs) in <strong>the</strong> Philippines.Usup, Gires and Rhodora V. Azanza. 2000.Physiology and Bloom Dynamics of <strong>the</strong> TropicalDinoflagellate, Pyrodinium bahamense var. compressum www. Wikipedia.org. com/Bivalves365
E-International Scientific Research JournalISSN: 2094-1749 Volume: 2 Issue: 4, 2010HYDROBIOLOGICAL ASSESSMENT OFLIBORAN RIVER, DAPITAN CITYAbstractS. Campiseño, E. Campiseño, M.R. Naguit & B. FloresJose Rizal Memorial state College – Main Campus, Dapitan CityJose Rizal Memorial state College – Main Campus, Dapitan CityJose Rizal Memorial state College – Katipunan Campus, Katipunan, ZDNJose Rizal Memorial state College – Main Campus, Dapitan CityThe water quality of Liboran River was examined to determine its present condition toserve as future reference or gauge of any effect brought about by climate change. Data onplankton composition, total coliform, phosphates, total suspended solids, as well as physicochemicalparameters such as dissolved oxygen, pH, temperature and salinity were collected.Based on <strong>the</strong> results of <strong>the</strong> three surveys, <strong>the</strong> river does not qualify for a Class SA coastalwater suitable for fishery production.Keywords:coliform, Liboran River, phosphates, pH, DOIntroductionRivers are lotic or running water environment that are usually habitats to an amazingdiversity of species with abundant specialized niches (Brown, 1995). They are also sources ofwater for drinking, cleaning, bathing, washing clo<strong>the</strong>s, preparing and cooking food, gardeningand even for irrigating farmlands. Moreover, <strong>the</strong>y serve as source of livelihood like fishingand in some areas, quarrying.Liboran River is partly enclosing <strong>the</strong> city proper of Dapitan City (Fig 1). It has twooutlets to Dapitan Bay which completes <strong>the</strong> encirclement of <strong>the</strong> city proper: Bagting and Polo.The river has a length of 7.7 km and an area of 62.6 ha. Its depth varies from 1 m to 2.7 m. Italso receives at least six tributaries. Its greatest contributor (65.53 m 3 /sec) is Dapitan River at<strong>the</strong> south end (SUAKCREM, 2000). The river banks are line with naturally growing andplanted mangrove trees. Milkfish grow out ponds are found on ei<strong>the</strong>r side of <strong>the</strong> river. Fishpens and talaba cultures are evident in <strong>the</strong> river itself. Human settlements are also found along<strong>the</strong> river bank, particularly in Tambak and to <strong>the</strong> north and sou<strong>the</strong>ast of Bagting Bridge.Like any o<strong>the</strong>r ecosystems, rivers are also threatened by <strong>the</strong> effects of climate change.A global analysis of <strong>the</strong> potential effect of climate change on river basins indicates that manyrivers impacted by dams or extensive development will require significant managementinterventions to protect ecosystems and people. Hence, this study is helpful in understandingclimate change impacts on river system specifically <strong>the</strong> effects brought about by droughts and366
E-International Scientific Research JournalISSN: 2094-1749 Volume: 2 Issue: 4, 2010typhoons due to <strong>the</strong> El Niňo and La Niňa phenomena. The trend towards <strong>the</strong> “shallowing”process and <strong>the</strong> flooding of rivers due to climate variability can significantly alter <strong>the</strong>conditions of river systems in terms of biodiversity composition and physical condition.Extreme drought causes rivers to dry out and this would mean <strong>the</strong> extinction of some speciesthat are not resistant or adaptable to <strong>the</strong> absence of water (Juranilla-Sanchez et al., 2007). Flashflooding after heavy rains or during typhoons causes <strong>the</strong> river to swell or overflow anddestroys <strong>the</strong> river banks and <strong>the</strong> plants that grow <strong>the</strong>re. Floods also erode <strong>the</strong> soil thatsubsequently contribute to <strong>the</strong> siltation process downstream.Research Method and DesignSeven stations were established as sampling sites along <strong>the</strong> Liboran River and weresampled in June 2006 and May 2010. Physico-chemical parameters such as pH, temperature,dissolved oxygen (DO), salinity, total suspended solids, phosphates and nitrates weremeasured, as well biological parameters such as total coliform, Escherichia coli and planktoncomposition.Determination of Dissolved Oxygen (DO), pH, Salinity and Temperature. In situmeasurements of dissolved oxygen, pH, temperature and salinity were conducted a portableDO meter, pH meter, <strong>the</strong>rmometer and refractometer, respectively in three replications.Phosphates (PO 4 -P mg/L) Analysis. Water samples in three replicates (350 ml each)were taken from <strong>the</strong> three sampling sites and were placed in a glass bottle. (Sampling bottleswere soaked with muriatic acid and washed with a phosphate free detergent before use).Samples were <strong>the</strong>n placed in a styropore box with ice and were brought to Silliman UniversityMarine Laboratory for analysis.Stocks solutions of Sulphuric Acid, Ascorbic Acid, and Mixed Reagent were firstprepared. Sulphuric Acid was prepared through adding 125 ml concentrated H 2 SO 4 to waterand was diluted to 500 ml, stored in a plastic bottle. Ascorbic Acid on <strong>the</strong> o<strong>the</strong>r hand, wasprepared through dissolving 5.0g ascorbic acid in an amber glass bottle with 25 ml water, andadded with 25 ml sulphuric acid solution and stored in <strong>the</strong> refrigerator. Mixed Reagent wasprepared through dissolving 6.25 g (NH 4 ) 6Mo 7 0 24 .4H 2 O in 62.5 ml water. Then 0.25gpotassium antimony tartrate (with or without 1/2H 2 O) was dissolved in 10.0 ml water. Themolybdate solution was <strong>the</strong>n added to 175 ml of dilute sulphuric acid with <strong>the</strong> tartrate, andwas stored in a glass bottle. Then <strong>the</strong> following were added to a test tube or scintillation vial:10 ml filtered sample, 0.2 ml ascorbic acid reagent, and 0.2 ml mixed reagent. Absorbance at880 nm was measured between 5 and 30 minutes. The concentration of PO 4 -P in mg/L is givenby <strong>the</strong> formula of Spotte as quoted by Argente (2009):C u =C s V s A sV u AsW<strong>here</strong>: C u = <strong>the</strong> concentration of <strong>the</strong> unknown in mg PO 4 -P/LC s = <strong>the</strong> concentration of <strong>the</strong> standard in mg PO 4 -P /LA u = <strong>the</strong> absorbance of <strong>the</strong> unknownA s = <strong>the</strong> absorbance of standard367
E-International Scientific Research JournalISSN: 2094-1749 Volume: 2 Issue: 4, 2010V u = volume of <strong>the</strong> unknown pipetted in litersV s = volume of <strong>the</strong> standard pipetted in litersTotal Suspended Solids (TSS). One liter water samples in three replications werecollected in each of <strong>the</strong> sampling station. In <strong>the</strong> laboratory, water samples were filtered usingan Improvised Filtration Apparatus and pre-weighed Whatman GFC 47 mm filters. The filterswere pre-stabilized to constant dry weight, labeled and weighed before filtration. Afterfiltration, each filter with residue was air-dried for 24 hours, oven dried at 100 0 C to constantdry weight, and weighed again. Total Suspended Solids (TSS mg/L) were calculated using <strong>the</strong>formula below (Argente 2009):TSS = (W f+r – W f ) / V wW<strong>here</strong> W f is <strong>the</strong> pre-stabilized weight of <strong>the</strong> filter in milligrams (mg), W f+r is <strong>the</strong>stabilized weight of <strong>the</strong> filter and residue in milligrams (mg), and V w is <strong>the</strong> volume of <strong>the</strong>water in liter (L).Nitrate AnalysisColiform Bacteria Contamination. Water samples (100 mL each) were collected usingsterile sampling bottle and processed using membrane filtration method for coliform analysis.Coliform was cultured in endobroth medium at 35 C for 24 – 48 hours. The resultingcolonies were counted indicated by <strong>the</strong> characteristic green-gold metallic sheen for Escherichiacoli and light to dark pink color for Salmonella. The most probable number (MPN) ofcolonies per 100 ml of seawater was determined using <strong>the</strong> formula:No. of coloniesMPN/100 mL = --------------------------------------------- x 100Volume of water sample in mLAn ocular inspection was also conducted to determine <strong>the</strong> number of householdswithout toilets.Plankton Composition. Replicated vertical tows were done in each sampling site. Astandard plankton net with 80 um mesh size was suspended at 1 m below <strong>the</strong> surface of <strong>the</strong>water column between 10:00 am and 2:00 pm. Samples were preserved in 4% bufferedformalin with Rose Bengal stain. Counting and identification of species were done under acompound microscope.Population densities were calculated using <strong>the</strong> following formula (Newell & Newell,1963):No. of organism in 1 m sample x total volume of sampleD = ----------------------------------------------------------------------------------Total volume of water sampled368
E-International Scientific Research JournalISSN: 2094-1749 Volume: 2 Issue: 4, 2010Species diversity was determined using <strong>the</strong> Shannon index of diversity and speciesrichness.ResultsColiform Contamination. Water samples from all seven stations in both samplingswere positive for total coliform (Table 1). In 2006, Stations 5 (Banonong) and 2 (Linabo) had<strong>the</strong> highest counts of Salmonella sp, with counts of 7.75 colonies x 10 3 100 ml -1 (±0.250) and7.1667 colonies x 10 3 100 ml -1 (± 0.347 ), respectively. The former station recorded evenhigher count (TNTC, too numerous to count) in <strong>the</strong> 2010 sampling, along with station 4(Ambogoc). Linabo recorded <strong>the</strong> second highest followed by Cawa-cawa and Polo. Esherichiacoli colonies were also too numerous to count in both stations on <strong>the</strong> same sampling period. In<strong>the</strong> 2006 sampling, <strong>the</strong> fecal coliform was highest in Ambogoc( 2.0 colonies x 10 3 100 ml -1 ±0.304) followed by Linabo (1.917 colonies x 10 3 100 ml -1 ± 0.344). These values were smallercompared to <strong>the</strong> counts obtained in November 1999 (Table 1) except for <strong>the</strong> TNTC readingsfor Salmonella sp. in Ambogoc and Banonong during <strong>the</strong> last sampling. Salmonella countsduring <strong>the</strong> 2010 sampling was significantly higher compared to <strong>the</strong> 2006 sampling but wascomparable to <strong>the</strong> 1999 sampling of SUAKCREM [F(2,17)= 4.156, p=0.034].Plankton Community. The plankton community in Liboran River were categorizedinto diatoms dinoflagellates and zooplankton (Fig. 3). As shown, <strong>the</strong> latter comprised 50% and46% of <strong>the</strong> total community in 2006 and 2010, respectively. The diatoms made up <strong>the</strong> 29%in both sampling periods while <strong>the</strong> dinoflagellates comprised <strong>the</strong> 21% (2006) and 25%(2010). Species composition and estimated population densities of plankton in Liboran Riverare presented in Tables 2 and 3.In 2006, <strong>the</strong> diatoms were composed of fifty-seven species with five dominant genera:Coscinodiscus, Navicula, Gyrosigma, Chaetoceros and Amphiprora. The blue-green alga,Oscillatoria was also abundant Table 2. A total of fourteen species of dinoflagellates wereidentified belonging to 11 genera. Three of <strong>the</strong>se genera, Dinophysis, Ceratium andPeridinium are known to cause red tides. The first two genera dominated <strong>the</strong> dinoflagellatecommunity. Dinophysis has also toxin-producing species. Zooplankton was made up of 21species typically dominated by crustaceans particularly, <strong>the</strong> copepods. In 2010, <strong>the</strong>re wereonly 44 species of diatoms, 14 dinoflagellates and 11 zooplankton species identified. Withregard to <strong>the</strong> diversity of <strong>the</strong> plankton community, richness and Shannon diversity indices were2.54 ±0.340 and 1.12 ±0.069, respectively in 2010 and 2.84 ±0.34 and 1.20 ± 0.10 in 2006.Table 1. Comparison of mean total coliform, Escherichia coli and Salmonellatyphymurium counts (colonies 100 ml -1 )with <strong>the</strong> study conducted bySUAKCREM in 1999.StationsSUAKCREM, 1999Colonies 100This studycolonies 100 ml -1 Colonies 100 -120102006Salmonella E. coli Salmonella E.coli Salmonella E. colisp.spsp369
E-International Scientific Research JournalISSN: 2094-1749 Volume: 2 Issue: 4, 20101 Bagting 13000±57.98700±9.196917+0.2502 Linabo 29100 4700 7167±77.78 ±45.96 +0.3473 Tambak 12800 1400 3833±181.02 ±10.6 +0.4414 Ambogoc TNTC TNTC 6417+0.5995 Banonong TNTC TNTC 7750+0.2506 Maria Uray 18900 670 917±95.46 ±22.63 +0.2507 Polo 22000 970 1917±17.68 ±137.2 +0.0088 Cawa-cawa 26200±77.071417+0.2501917+0.344 33000 12700833+0.1672000+0.3041000+0.000 37500 1030083+0.083 22500 0250+0.160 33000 2200440±62.22 30000 2100Physico-chemical Parameters. In 2006, phosphate concentrations ranged from 0.125-0.205 mg /L while in 2010, it ranged 0.04-0.13 mg /L (Figure 4). Total suspended solids werefrom 0.02-0.04 mg/L in 2006 and from 0.04-0.249 mg/L in 2010, both, primarily composed ofsediments. These values were lower compared to <strong>the</strong> values obtained from o<strong>the</strong>r similar studiesconducted in Bais Bay in Negros Oriental (22.75 – 76.74 mg/L) (Dawa, 2007) and LingayenGulf (5.8 – 71.6 mg/L) (San Diego & Ranches, 2003).O<strong>the</strong>r hydrological parameters measured are presented in Table 3. As revealed, <strong>the</strong>mean dissolved oxygen of Liboran River in <strong>the</strong> latest survey was comparable to <strong>the</strong> readingsobtained in 2006 (4.63 mg/L ±0.919 and 4.76 mg/L ±0.37, respectively) [t(12)=0.364,p=0.722]. Mean salinity on <strong>the</strong> o<strong>the</strong>r hand, was 28.12 ppt ±6.69, which was quite lowercompared to <strong>the</strong> 2006 reading, 32.62 ppt ±2.20 but not significant [t (12)=1.42, p=0.180]. Inaddition, pH levels were almost <strong>the</strong> same in both sampling periods (2006=7.92 ±0.053; 2010=7.8 ±0.215) [t(12)=1.42, p=0.180]. Lastly, <strong>the</strong> average water temperature was significantlylower (30.75 °C ±0.92) in 2010 than in 2006 (31.77 °C ±0.204) [t(12)=2.8, p=0.014].Figure 3 . Plankton distribution at Liboran River in two samplingsusing vertical tow.370
E-International Scientific Research JournalISSN: 2094-1749 Volume: 2 Issue: 4, 2010DiscussionT<strong>here</strong> was a decrease in <strong>the</strong> total coliform in 2006 from 31,746 colonies/100 mL in1999 to 6,059 colonies/100 mL. The decrease could be attributed to <strong>the</strong> removal of abandonedoyster culture structures, fish traps and o<strong>the</strong>r obstructions within <strong>the</strong> river which increased <strong>the</strong>flow of water in and out of <strong>the</strong> river. An alarming increase was observed in <strong>the</strong> recent survey.Ambogoc and Banonong consistently have higher total coliform counts in all three suveys.Both total and fecal coliform counts exceed <strong>the</strong> standard limit for Class SA coastal and marinewaters but were below for class SB (DENR standard No. 34 s. 1999). In <strong>the</strong> recent survey, itwas observed that <strong>the</strong> river’s opening has been reduced at <strong>the</strong> portion w<strong>here</strong> a bridge was beingconstructed. The bridge’s design requires <strong>the</strong> filling up both sides of <strong>the</strong> river bank with soiland shorter and stouter concrete support structures that even <strong>the</strong> smallest banca cannot passthrough it. It should be noted that <strong>the</strong> movement of water in <strong>the</strong> river is tidal. The onlymeans for <strong>the</strong> inner portions of <strong>the</strong> river to flush out and receive fresh supply of water is tidalcurrents.The plankton community is fairly <strong>the</strong> same in terms of diversity, although <strong>the</strong>re was adecrease in <strong>the</strong> zooplankton and dinoflagellates composition by 4 %.The phosphate values obtained in both samplings (2006= 0.17 mg/L ±0.025; 2010=0.08 mg/L ±0.045) were way above <strong>the</strong> ASEAN phosphate concentration criteria values forcoastal (0.015 mg/L) and estuarine (0.045 mg/L) waters. These high values is probably causedby water from adjacent fishponds (fertilizer and fishmeal) as well as from rice fields thatempty into <strong>the</strong> different creek tributaries of Liboran River and local residents (soap used forwashing and bathing).Table 2. Species composition of plankton in Liboran River.PhytoplanktonSpecies2010 20061 2 3 4 5 6 7 8 1 2 3 4 5 6 7DiatomAchnan<strong>the</strong>s √ √ √ √ √ √ √ √ √ √Acterionellopsis√Actinocyclus √ √ √ √ √Actinoptychus√Amphipleura pellucida√Amphiprora hyperborean √ √ √Amphora √ √Amphora ovalis √ √ √Asterionella sp√√Asterionella japonica√Bacillaria √ √ √Biddulphia √ √ √ √ √ √ √ √ √ √ √ √Caloneis siloula var inflata √Campylodiscus √ √ √ √ √ √Centropages hamatus√Chaetoceros √ √ √ √ √ √ √ √ √ √ √ √ √ √Chlorobotrys√Closteriopsis√371
E-International Scientific Research JournalISSN: 2094-1749 Volume: 2 Issue: 4, 2010Closterium √ √ √Closterium acutum√Cocconeis √ √ √ √ √ √ √ √ √ √ √Coscinodiscus √ √ √ √ √ √ √ √ √ √ √ √ √ √Cosmarium√Cylindro<strong>the</strong>ca √ √C. closterrium √ √ √ √Cymatopleura√Cymbella √ √ √ √ √ √ √Diatoma √ √ √ √ √ √ √Diatoma vulgare√DictyosteliumDiplosalis √ √ √Eunotia √ √Entomoneis√Epi<strong>the</strong>mia√Fragilaria √ √ √ √Giardia flacida√Guinardia √ √ √Guinardia√Gyrosigma √ √ √ √ √ √ √ √ √ √ √ √Halosphaera√Hyalodiscus √ √Hyalo<strong>the</strong>ca√Lauderia borealis √ √ √ √2010 2006Leptocylindricus minimus√Melosira √ √ √ √ √ √ √M. dubia √M. nummuloides √ √Merismopedia √ √Navicula √ √ √ √ √ √ √ √ √ √ √ √ √ √N. circumsecta √Nitzschia √ √ √ √ √ √ √ √ √N. seriata √Odontella √ √ √Paralia sulcata√Parasterope muelleri √ √Pinnularia √ √ √ √ √ √ √Pleurosigma √ √ √ √ √ √ √ √Pseudonitzschia√Pseudocalanus elongatus√Rhizosolenia √ √ √ √ √ √ √R. fragilissima √Rufusiela√Skeletonema √ √ √ √ √ √Skeletonema costatum√Stauronesi√Surirella √ √ √ √ √ √Synedra √ √ √ √ √ √ √ √ √ √ √S. ulna var contracta √ √Tabellaria fenestrate √ √Temora longicornis√Thalassionema √ √Thalassiothrix √ √Terspsinoe musica √ √ √ √ √ √ √ √ √Tetrastum√Ulothrix √ √ √ √ √ √ √ √Dinoflagellates372
E-International Scientific Research JournalISSN: 2094-1749 Volume: 2 Issue: 4, 2010Alexandrium fundyense √ √ √ √ √ √Alexandrium tamarense √ √ √Ceratium furca √ √ √ √ √ √ √ √ √ √Ceratium fusus √ √Ceratim tripos √ √ √ √Ceratulina pelagi√Cochlodinium√Coolia√Cosmarium √ √Cossmarium pyramidatum var.convexum √ √Cosmarium prarr√Diploneis puella √ √ √Dinophysis √ √ √ √Gymnodenium√Gonyaulax √ √ √ √Fibrosa japonica√Klebsormidium√Lithodesmium intricatum√Noctiluca √ √ √ √Peridium √ √ √ √ √ √Protocentrum √ √ √ √P. mexicanum √P. micans √P. reticulum √Protoceratium reticulatum √ZooplanktonTintinid √ √ √ √ √ √ √ √ √ √ √ √ √ √Rotifera √ √ √ √ √ √ √ √ √Foraminefera √ √ √ √ √ √ √ √ √Orbulina √ √ √ √ √Globigerina √ √ √Nauplii √ √ √ √ √ √ √ √ √ √ √ √ √ √ √Calanoid √ √ √ √ √ √ √ √ √ √ √ √ √ √ √Cyclopoid √ √ √ √ √ √ √ √ √ √ √ √ √ √ √Harpaticoid √ √ √ √ √ √ √ √ √ √ √ √ √ √Daphnia √ √ √Amphipoda√Zoea larva (crab) √ √Nematode √ √ √Polychaete larvae √ √Gastropod larvae √ √ √ √ √ √ √ √ √ √ √ √Bivalve larvae √ √ √ √ √ √ √ √Chaetognath √ √For dissolved oxygen (DO), values were about 0.24-0.27 mg/L below <strong>the</strong> tolerablelimit (5 mg/L) but slightly higher to <strong>the</strong> marine water quality criteria for <strong>the</strong> ASEAN region (4mg/L). Readings were quite low when compared to <strong>the</strong> previous study conducted bySUAKCREM (2000). DO readings were generally high during high tides when influx of freshseawater gets into <strong>the</strong> inner portion of <strong>the</strong> river.Moreover, <strong>the</strong>re was a significant decrease in <strong>the</strong> temperature between <strong>the</strong> two surveys(2006 = 31.77 °C ±0.204; 2010 = 30.75 °C ±0.92) [t(13)= 2.83, p=0.014]. Trends in annualmean temperature anomalies for <strong>the</strong> globe revealed a relatively rapid and steady warmingthrough <strong>the</strong> early 1940s, followed by ano<strong>the</strong>r period of relatively stable temperatures through<strong>the</strong> mid-1970s.373
E-International Scientific Research JournalISSN: 2094-1749 Volume: 2 Issue: 4, 2010From this point onward, ano<strong>the</strong>r rapid rise similar to that in <strong>the</strong> earlier part of <strong>the</strong>century is observed. The year 2009 was <strong>the</strong> sixth warmest in <strong>the</strong> global record (0.43°C above<strong>the</strong> 1961-1990 reference period mean), exceeded by 1998, 2005, 2003, 2002, and 2004. Theperiod 2001-2009 (0.43°C above 1961-90 mean) is 0.19°C warmer than <strong>the</strong> 1991-2000 decade(0.24°C above 1961-90 mean).Shannon index RichnessStation 2010 2006 2010 2006Bagting 1.04 1.18 2.40 3.15Linabo 1.10 1.33 2.88 2.86Tambak 1.13 1.19 3.09 2.91Ambogoc 1.00 1.05 1.52 2.17Banonong 1.14 1.15 2.45 2.80Maria Uray 1.17 1.33 3.03 3.22Polo 1.22 1.17 2.70 2.83Cawa-cawa 1.12 2.22The 1990s were <strong>the</strong> warmest complete decade in <strong>the</strong> series. The warmest year of <strong>the</strong>entire series has been 1998, with a temperature of 0.55°C above <strong>the</strong> 1961-90 mean. Fourteen of<strong>the</strong> fifteen warmest years in <strong>the</strong> series have now occurred in <strong>the</strong> past fourteen years (1995-2009).Table 3. Diversity Indices of plankton at Liboran River in two samplings.2006 2010374
E-International Scientific Research JournalISSN: 2094-1749 Volume: 2 Issue: 4, 2010Figure 4. Mean phosphate concentration (mg PO 4 /L + SE) of <strong>the</strong> different stationsestablished in Liboran River.Figure 5. Mean total suspended solids (TSS) (mg/L) of <strong>the</strong> different stations.Relating <strong>the</strong> trends in <strong>the</strong> number of total coliform and plankton composition between2006 and 2010 to temperature, Pearson product moment analysis revealed no significantcorrelation, hence, <strong>the</strong> trends could not be related to climate change. The high coliform countin Liboran River could only be attributed to <strong>the</strong> reduction of <strong>the</strong> water movement in <strong>the</strong> river.Mitigating measures should be done at this point for Liboran River to be suitable for Talabaculture and o<strong>the</strong>r aquaculture activities. Based on <strong>the</strong> results of <strong>the</strong> three surveys, <strong>the</strong> river doesnot qualify for a Class SA coastal water suitable for fishery production.Table 4. The average values of <strong>the</strong> physico-chemical parameters in Liboran River.DO Temperature Salinity pHStation 2006 2010 2006 2010 2006 2010 2006 2010(mg/L) (°C) (ppt)Bagting 4.7 4.65 31.6 30.9 34.8 30 8.0 7.95SD + 0.1 0.49 0.2 1.7 0.4 0.00 0.0 0.21Linabo 4.6 4.95 31.9 30.6 35.0 35 8.0 7.9SD + 0.0 1.48 0.2 0.1 0.0 8.49 0.0 0.28TAMBAK 4.7 5 31.7 30.3 34.0 29.5 8.0 7.85SD + 0.0 0.28 0.1 1.0 0.0 7.78 0.0 0.21AMBOGOC 5.6 3 32.0 32.7 30.8 16 7.9 7.4SD + 0.0 0.00 0.0 0.1 0.4 0.00 0.0 0.00BANONONG 4.4 4 31.7 31.2 30.0 25 7.9 7.65SD + 0.0 0.42 0.0 0.2 0.0 7.07 0.0 0.07MA. URAY 4.7 4.15 32.1 30.9 31.3 22 7.9 7.65SD + 0.1 0.78 0.1 1.6 0.4 2.83 0.0 0.21375
E-International Scientific Research JournalISSN: 2094-1749 Volume: 2 Issue: 4, 2010POLO 4.8 6.05 31.6 29.6 32.5 35 8.0 8.05SD + 0.1 2.19 0.0 0.8 0.0 0.00 0.0 0.07Cawa-cawa 5.25 30.0 32.5 7.95SD + 0.78 1.4 3.54 0.21ReferencesAlcala, E. and J. Maypa. 2000. preliminary water quality assessment of Liboran River,Dapitan City. In: A.C. Alcala, A report on Liboran River, Dapitan City submitted to MayorCedrick O. Ruiz, Dapitan City.Chandran, A. and A.A.M.Hatta. 2001. Survival of Escherichia coli in a tropical estuary.Journal of Environmental Sciences, Mahatma Ghandi University, Kerala, India 41-45 pp.DENR. 1990. Department of Environmental and Natural Resources Administrative Order No.34 Series 1990. 78-80.English, S.C., wilkinsn and V. Baker (eds.). 1994. Survey manual for Tropical MarineResources. Australian institute of Marine Science, TownsvilleGrasshoff, K., M. Ehrhardt and K. Kremling. 1983. methods of seawater Analysis. Weinheim:Verlag Chemie, pp.125-131.Johnston, R.1976.Marine Pollution. Department of Agriculture and Fisheries for Scotland,marine Lab, Aburdeen Scotland.Lodon: Academic Press inc. London Ltd. 13-33 pp.McPherson, C.A., P.M. Chapman, G.A.Vigers and K.S. Ong.1999. ASEAN Marine WaterQuality Criteria: Contextual Framework, Principles, Methodology and Criteria for 18Parameters. ASEAN marine Environmental Quality Criteria –working group (AMEQC-WG),ASEAN-Canada Cooperative Programme onMarine Science-Phase II). EVS Environmentconsultants, North Vancouver and Departmentof Fisheries, Malaysia. Pp. 568376
E-International Scientific Research JournalISSN: 2094-1749 Volume: 2 Issue: 4, 2010DIRECT AND INDIRECT ECONOMIC IMPACT OFCLIMATE CHANGE ON THE PROVINCIALTOURISM, AGRICULTURE AND COMMERCIALSECTORS OF ZAMBOANGA DEL NORTEW. D. Carreon and J.S. R. CampiseñoJose Rizal Memorial State University, Dapitan CityJose Rizal Memorial State University, Dapitan CityAbstractThis study is an attempt to look into <strong>the</strong> direct and indirect economic impact of climatechange to three (3) business sectors: tourism, commercial and agricultural, of Zamboanga delNorte by canonical path analysis. Results revealed that temperature and rainfall variations ledto a decline in agricultural productivity (-1.90%) but spurred greater economic activities in <strong>the</strong>commercial (47.0%) and tourism sectors (17.12%). The traditional farming method commonlyused in <strong>the</strong> province accounts for <strong>the</strong> adverse sensitivity of this sector to climate change. Thisstudy recommends that <strong>the</strong> agricultural sector looks into possibilities of using modern farmingsystems in order to counter <strong>the</strong> negative consequences brought about by climate change.Keywords: direct and indirect economic impact, climate change, business sectorsIntroductionThe center for Integrative Researches of Maryland in 2008, explained that differentsectors and systems are expected to be affected in different ways by <strong>the</strong> impact of continuedclimate change in such a way that economic gains from agricultural produce will be alteredsince growing conditions of agricultural products are lost as temperatures continue to rise.Droughts, water shortages as well as excess precipitations and spread of pests and diseasesaffecting <strong>the</strong> agricultural resources create a negative impact on agricultural production.Similarly, transportation networks, infrastructure, water and electricity (energy) supplysystems will be disrupted. The balance between <strong>the</strong> supply of and demand for energy will betilted as <strong>the</strong> demand for energy continues to rise beyond <strong>the</strong> available supply. For instance, inan economy which is largely dependent on hydropower, such as <strong>the</strong> island of Mindanao, longperiods of dry season lead to low water pressure which eventually translate to shortages in <strong>the</strong>supply of electricity. Of course, when power supply is affected, <strong>the</strong> whole economic systembecomes disturbed, produces less and results in a drop in productivity. This phenomenon wasrecently observed during <strong>the</strong> El Nino effect which lasted from October, 2009 to June, 2010 ora period of over eight months with abnormally low rainfall throughout <strong>the</strong> country.377
E-International Scientific Research JournalISSN: 2094-1749 Volume: 2 Issue: 4, 2010Climate change as manifested by very long dry season or very heavy rainfall alsomakes people vulnerable to various kinds of health problems, particularly to vector bornediseases. For instance, Chowell et al. (2006) discovered that <strong>the</strong> incubation period for denguefor persons bitten by mosquitoes (Aedes aegypti) is significantly shortened (from 12 days downto 5 days) at temperatures beyond 31 0 C. Not only that, a significant increase in <strong>the</strong> number ofmosquitoes is observed in <strong>the</strong> rainy season perhaps because of an increase in <strong>the</strong> number ofbreeding sites. When <strong>the</strong>se two information are combined, we obtain a grim picture forcountries with tropical climates (temperatures ranging from 31 o C to 34 o C) and experiencing<strong>the</strong> La Nina effect. This year alone, <strong>the</strong> statistics for <strong>the</strong> number of people diagnosed with oneof <strong>the</strong> dengue serotypes (January to June,2010) in <strong>the</strong> Philippines already surpassed <strong>the</strong> numberinfected in 2009. A health outbreak such as this eventually finds expression in a significantlyreduced per capita economic productivity.The business sector which determines <strong>the</strong> economic growth and development of <strong>the</strong>Province of Zamboanga del Norte will likely experience <strong>the</strong>se negative effects of climatechange brought about by <strong>the</strong> combined effects of a dwindling supply of energy, frequent watershortages, rise in transportation costs and health issues in <strong>the</strong> various communities. Althoughwe have confined our analysis to <strong>the</strong> province of Zamboanga del Norte, we suspect that <strong>the</strong>same phenomenon can be observed elsew<strong>here</strong> in <strong>the</strong> country.Climate change, on <strong>the</strong> o<strong>the</strong>r hand, can ironically, also bring about positive impact on<strong>the</strong> business and industry. A study conducted in 2008 on Climate Change Challenge –Implications for <strong>the</strong> Tourism Industry, stressed that climate change provides opportunity togenerate both tangible and sustainable solutions. An example is on <strong>the</strong> supply of water. Whilewater supply becomes more and more scarce in almost every region of <strong>the</strong> country, it alsocreates business opportunities for those capitalists who can eventually do business withpurified drinking water, which implies greater productivity for <strong>the</strong> commercial sector.Opportunities such as this abound and simply reflects man’s flexibility to adapt to climatechange.This study, <strong>the</strong>refore, aims to look into <strong>the</strong> direct and indirect economic impact ofclimate change on <strong>the</strong> business sector of <strong>the</strong> province. In particular, it examines <strong>the</strong> direct andindirect effects of rainfall and temperature fluctuations over a 12-month period on three (3)economic sectors: tourism, agriculture and commercial sectors through a path analysis. Theintervening factors which contribute to <strong>the</strong> observed productivity of <strong>the</strong>se sectors, namely,health and energy supply, were used as intervening nodes in <strong>the</strong> path analysis performed.Research Method and DesignThe data were taken from different sources which cover a twelve (12) month periodcommencing April 2009 to March 2010. To ascertain <strong>the</strong> average precipitations and rise intemperature, data were obtained from <strong>the</strong> Philippines Atmospheric survey of <strong>the</strong> Department ofScience and Technology. The data on energy level and public health were taken from sourcesto include <strong>the</strong> Zamboanga del Norte Electric Cooperative, DOTC and <strong>the</strong> hospitals inZamboanga del Norte. On <strong>the</strong> o<strong>the</strong>r hand, <strong>the</strong> data on <strong>the</strong> business sector were from <strong>the</strong>Department of Trade and Industry, <strong>the</strong> BIR and <strong>the</strong> Department of Agriculture. Statistical378
E-International Scientific Research JournalISSN: 2094-1749 Volume: 2 Issue: 4, 2010methods were employed in order to determine <strong>the</strong> direct and indirect impact of climate changeto <strong>the</strong> business industries.The data that came from different sources were statistically treated using simple pathcanonical correlation technique. The indirect impact were treated individually from <strong>the</strong> data onclimate change to <strong>the</strong> main impact on <strong>the</strong> energy sector and public health to <strong>the</strong> business sectornamely agricultural, commercial establishments and industrial production. The total impactwas ascertained by getting <strong>the</strong> sum of <strong>the</strong> indirect and direct impact.ResultsFigure 1 shows <strong>the</strong> rainfall and temperature data on <strong>the</strong> twelve – month period.The graph shows that <strong>the</strong> highest rainfall was in January 2010 which reached up to alevel of 17 while <strong>the</strong> lowest falls on February 2010. On <strong>the</strong> o<strong>the</strong>r hand, <strong>the</strong> highest temperaturewas in December 2009 while <strong>the</strong> lowest was on February 2010.379
E-International Scientific Research JournalISSN: 2094-1749 Volume: 2 Issue: 4, 2010Figure 2 show <strong>the</strong> energy supply over <strong>the</strong> same period.It could be seen from <strong>the</strong> graph that <strong>the</strong> highest supply of energy was on December2009 with 12 month kilowatts and <strong>the</strong> lowest was in February w<strong>here</strong> <strong>the</strong>re is only about 8million kilowatt supply of energy.Shown in figure 3 are <strong>the</strong> data on respiratory cases recorded in <strong>the</strong> Province onZamboanga del Norte.It could be seen that <strong>the</strong> highest number of cases occurred in July of 2009 while <strong>the</strong>lowest was in June in <strong>the</strong> same year. However, <strong>the</strong> number of cases on health related issueswere fluctuating from month to month. This could be due to <strong>the</strong> fact that climate change mayhave brought about different cases at different levels depending on <strong>the</strong> vulnerability of peoplewho are prone to climate change related illnesses.380
E-International Scientific Research JournalISSN: 2094-1749 Volume: 2 Issue: 4, 2010Figure 4 shows <strong>the</strong> commercial product cost during <strong>the</strong> last 12 months.The highest cost of commercial products was seen in December and November in <strong>the</strong>year 2009. It could be noticed that <strong>the</strong> cost of commercial products were fluctuating dependingon <strong>the</strong> season since commercial products are generally seasonal. Commercial products aregenerally seasonal. In most cases, large amount of sales could only be achieved duringChristmas seasons, valentines, class openings and class closing times. Thus, it could also beseen on <strong>the</strong> data that commercial products are seen to be its peak during <strong>the</strong>se times.Figure 5 shows <strong>the</strong> agricultural products cost as recorded in <strong>the</strong> Department ofAgriculture bases on Quarterly reports published <strong>the</strong> Bureau of Agricultural Statistics (BAS).381
E-International Scientific Research JournalISSN: 2094-1749 Volume: 2 Issue: 4, 2010The data showed that <strong>the</strong> highest agricultural produce was in April of 2009 and <strong>the</strong>seagricultural products cost kept on decreasing every month due to invest more on <strong>the</strong> constancyof high temperature which brought about hesitation of agricultural producers to invest more onagricultural production because of <strong>the</strong> imbedded risk on it.Figure 6 is <strong>the</strong> graph showing <strong>the</strong> tourism inflow in <strong>the</strong> last 12 months. The data weretaken from <strong>the</strong> Department of Tourism Region IX.As shown on <strong>the</strong> table, <strong>the</strong> highest number of tourists <strong>the</strong> province was in September2009 which reaches up to ore than 8000 in one month. This is due to <strong>the</strong> regional and nationalconversations that are held within <strong>the</strong> province which brought about inflow in local andinternational tourists visiting <strong>the</strong> province. While it is true that tourist inflow could be seasonal,but organizations may establish activities that would bring about tourists within <strong>the</strong> provinceon cities within <strong>the</strong> province of Zamboanga del Norte.Figure 7 on <strong>the</strong> next page shows <strong>the</strong> results of <strong>the</strong> path canonical analysis performed on<strong>the</strong>se variables.382
E-International Scientific Research JournalISSN: 2094-1749 Volume: 2 Issue: 4, 2010383
E-International Scientific Research JournalISSN: 2094-1749 Volume: 2 Issue: 4, 2010Path AnalysisTable 1 shows both <strong>the</strong> direct and indirect impacts of climatological variables on <strong>the</strong>Tourism Industry in <strong>the</strong> province over <strong>the</strong> period.Table 1. Impact of Climatological Variables to TourismVariables Direct Impact Indirect Impact + Indirect Impact = Indirect ImpactVia Energy Via Health To TourismTemperature 0.404 0.034 + -0.036 = -0.002Rainfall 0.0508 0.136 + -0.026 = 0.110Total: 0.0912 0.080Grand Impact = = 0.912 + 0.080 = 17.12 %Table 2 shows <strong>the</strong> direct and indirect impacts of climatological variables on <strong>the</strong>Agriculture IndustryTable 2. Impact of Climatological Variables to Agriculture IndustryVariables Direct Impact Indirect Impact + Indirect Impact = Indirect ImpactVia Energy Via Health To AgricultureTemperature -0.125 0.023 + -0.010 = -0.013Rainfall 0.038 0.061 + -0.006 = 0.055Total: -0.087 0.068Grand Impact = -0.087 + 0.068 = -1.9 %Table 3 shows <strong>the</strong> direct and indirect impacts of climatological variables on <strong>the</strong>Commercial Sector.Table 3. Impact of Climatological Variables to Commercial SectorVariables Direct Impact Indirect Impact + Indirect Impact = Indirect ImpactVia Energy Via Health To CommerceTemperature 0.312 0.009 + -0.048 = -0.039Rainfall 0.207 0.024 + -0.034 = 0.010Total: 0.519 -0.049Grand Impact = 0.519 + -.049= -1.9 %384
E-International Scientific Research JournalISSN: 2094-1749 Volume: 2 Issue: 4, 2010DiscussionsMonthly average records of both temperature and rainfall over <strong>the</strong> twelve – monthperiod were not very erratic except for isolated cases in <strong>the</strong> months of February and March,2010. In January 2010, a high rainfall volume was noted followed by sudden drops in <strong>the</strong>months of February and March, 2010. Of <strong>the</strong> two (temperature or rainfall), <strong>the</strong> rainfall dataappears to be a better gauge for climatological changes for short period of time because of <strong>the</strong>relatively higher variances noted.Likewise, data on energy supply appeared to be stable until <strong>the</strong> months of March, 2010and April, 2010 (not shown) w<strong>here</strong> sudden drops in energy supply were noted. Unfortunately,it was erratic and <strong>the</strong>se months were not covered by <strong>the</strong> present study.Meanwhile, <strong>the</strong> data obtained for health showed erratic movement with <strong>the</strong> months ofAugust and September, 2010 showing high incidence of diseases. Such a data characteristic(relatively high variance) is ideal for determining <strong>the</strong> compatibility (or incompatibility) ofdiseases noted with <strong>the</strong> climatological indicators (rainfall and temperature)Extremes in temperature and rainfall adversely affected <strong>the</strong> agricultural sector whichregistered a negative direct impact index of (-8.70%). In particular, just two months of hightemperatures (March, 2010 and April, 2010) already made a pronounced drop in <strong>the</strong> farmers’yield and harvest of agricultural crops. Considering <strong>the</strong> indirect impact of climatologicalconditions (through <strong>the</strong> energy supply and health status), however, temperature and rainfallwere noted to have negligible positive impact of 6.8%. Over all, extremes in temperature andrainfall translates into a drop in farm productivity by about -1.905%.On <strong>the</strong> o<strong>the</strong>r hand, changes in both temperature an rainfall had positive direct impact(51.9%) on <strong>the</strong> commercial sector although <strong>the</strong>se jointly had negative negligible indirectimpact (energy + health) on <strong>the</strong> sector (-4.9%). As a whole, <strong>the</strong>se two climatologicalparameters precipitated a general increase in commercial productivity by a little less than 50%(47%). The net positive impact of a variable temperature and rainfall patterns on <strong>the</strong>commercial sector can be explained by <strong>the</strong> corresponding higher demand for consumerproducts that are needed during rainy season or during long stretches of drought e.g. bottledwater, soft drinks, beverages and o<strong>the</strong>rs. Thus, while <strong>the</strong> agricultural sector suffers a set – back(negative impact index) on its productivity due to aberrant wea<strong>the</strong>r patterns, <strong>the</strong> samephenomenon surprisingly spurs more economic activity in <strong>the</strong> commercial sector.Finally, <strong>the</strong> tourism industry, as a general rule, is also positively impacted by <strong>the</strong>observed climatological parameters (rainfall and temperature). A net positive tourism growthof 17.12% was calculated. However, high temperatures tended to damper <strong>the</strong> tourism industry(-0.20%) but such negative impact is easily absorbed by <strong>the</strong> overall robustness of <strong>the</strong> industryto climate change.ConclusionsThe most easily affected economic sector by changes in climatic pattern is <strong>the</strong>agricultural sector which is easily and adversely affected by ei<strong>the</strong>r long stretches of drought or385
E-International Scientific Research JournalISSN: 2094-1749 Volume: 2 Issue: 4, 2010heavy rainfall in <strong>the</strong> province. The farming method adopted by most farmers in <strong>the</strong> province istraditional and is so much dependent on nature.However, mild to moderate fluctuations in both temperature and rainfall patterns tendedto benefit <strong>the</strong> commercial sector most followed by <strong>the</strong> tourism sector. The huge demand forconsumer commercial products during long summer periods or long rainy seasons boost thisparticular economic sector in <strong>the</strong> province of Zamboanga del Norte. Similarly, <strong>the</strong> tourismindustry in <strong>the</strong> province is found to be relatively robust with respect to fluctuations intemperature and rainfall. In particular, tourists appear to prefer <strong>the</strong> tourism destinations in <strong>the</strong>province e.g. beach resorts and waterfalls during a long summer period. Tourists also accountfor stimulating <strong>the</strong> growth of <strong>the</strong> commercial sector in <strong>the</strong> province.ReferencesCohen, R., Ortez, K. and Pinkstaff, C. (2009) Making Every Drop Work: Increasing WaterEfficiency in California’s Commercial, Industrial, and Institutional (CII) Sector, NaturalResources Defence Council,.Gleick, P.H., Haasz, D., Henges-Jeck, C., Srinivasan, V., Wolff, G., Cushing, K.K. and Mann,A. (2003) Waste Not, Want Not: The Potential for Urban Water Conservation in California,The Pacific Institute, Oakland, California, USA.Global Reporting Initiative (undated) ‘Water protocol’, http://www.globalreporting.org/guidelines/protocols/WaterProtocol030501.pdf, accessed 16 October 2009.Mitchell, D., Beecher, J., Chesnutt, T. and Pekelney, D. (2008) Transforming Water: WaterEfficiency Stimulus and Long-Term Investment, Alliance for Water Efficiency, Chicago, USA.Parra, Natalia, et.al., 2008. Economic Impacts of Climate Change on Kansas, University ofMaryland Center of Integrative Environmental Research, Maryland, USA.Save Water (undated) ‘Saving Water in Business’, http://www.savewater.com.au/how-to-savewater/in-business,accessed 16 October 2009.UN Global Compact - CEO Water Mandate at http://www.pacinst.org/topics/globalization_and_environment/ceo_water_mandate/ceo_water_mandate.pdfaccessed16October 2009UNEP FI’s (undated) ‘Research on Water Issues and Business Risks and Opportunities’,http://www.unepfi.org/publications/water/, accessed 16 October 2009Victorian Government (2007) ‘What is business doing to save water?’,http://www.ourwater.vic.gov.au/__data/assets/pdf_file/0009/2502/Water_Industry_brochure.pdf, accessed 16 October 2009.World Business Council for Sustainable Development (2005) Collaborative actions forsustainable water management, Geneva.386