- 11 -It might be possible to go back over old records and the limitedpublications, to see if there have been significant changes <strong>in</strong> temperatureover tQe past 200 years or so. But the only old reliable data appears tolie is that given by Rutty for the period about 1757. He notes Mallow spawater as issu<strong>in</strong>g at 68 0 F (20 0 C), as compared with 20.7 0 e measured on 15 Nov.1979 (Table 36. Rutty also notes that st. Margarets (NO. 1009)registered 51 F (lO.SoC) or 5S o F C12.8 0 C) on 20 July, 1752; this wouldcompare with 17.2 0 C on the morn<strong>in</strong>g <strong>of</strong> 7 December 1979. In a study <strong>of</strong> thebiology <strong>of</strong> the Enfield spr<strong>in</strong>g, Fahy (1975) gave some temperature figures,based apparently on a record<strong>in</strong>g thermometer placed <strong>in</strong> the spr<strong>in</strong>g; hereports <strong>in</strong> his Table I a range from 6 0 to 22.5 0 C. He also states that thespr<strong>in</strong>g has a day-degree quota <strong>of</strong> 6,606, as aga<strong>in</strong>st 3,835 for an Irishisothermic spr<strong>in</strong>g. Fahy (1975, p. 112) mentions but three thermal spr<strong>in</strong>gsrecorded <strong>in</strong> <strong>Ireland</strong>, and <strong>in</strong>troduces the supposedly warm spr<strong>in</strong>g at Dunlav<strong>in</strong><strong>in</strong> Co. Wicklow, with the footnote "The area was visited by me; the spr<strong>in</strong>gwas not located".From the periodic temperature measurements made on the ma<strong>in</strong>Le<strong>in</strong>ster group <strong>of</strong> spr<strong>in</strong>gs (Fig. 2), those for the Enfield (NO. 1005) andst. Gormans (No. 1007) have been selected for presentation here, Fig. 3.Dur<strong>in</strong>g the eight years to end-1978, Enfield water temperature was recorded62 times and that <strong>of</strong> St. Gormans 64 times. No self-register<strong>in</strong>g or m<strong>in</strong>-maxthermometers were used. Periods when the spr<strong>in</strong>gs had dried-up or becomestagnant were noted; such low/nil flows tended to occur from August toNovember. Figure 3 shows water temperature for Enfield and for st.Gormans over the calander years 1976 and 1978. These were years for whichgood records were available, and which come after the 1974-76 drought.The plott<strong>in</strong>gs show how temperatures reach a peak <strong>in</strong> the spr<strong>in</strong>g,and then fall quite sharply from May'to October, to rise aga<strong>in</strong> dur<strong>in</strong>g thew<strong>in</strong>ter. The discharges also <strong>in</strong>crease <strong>in</strong> spr<strong>in</strong>g and fall <strong>in</strong> autumn. So,as flow <strong>in</strong>creases, so does temperature; as flow decreases, so do temperaturesfall. It is considered that this relationship is <strong>of</strong> considerablesignificance. The source <strong>of</strong> the heat which warms the water must be muchgreater than the amount <strong>of</strong> heat taken away by the water. It suggests thatthe larger the volume <strong>of</strong> water mov<strong>in</strong>g underground, the more it is brought<strong>in</strong>to contact with zones <strong>of</strong> more heat or higher temperatures. This may<strong>in</strong>dicate a deeper circulation <strong>in</strong> the ground when w<strong>in</strong>ter <strong>in</strong>filtration hasrecharged the aquifers and the water is mov<strong>in</strong>g strongly towards itsdischarge po<strong>in</strong>t.The degree-days for the two spr<strong>in</strong>gs have also been calculated,due to irregularity <strong>of</strong> measurement and that fact that st. Gormans was dryfor part <strong>of</strong> the year, degree-days are only approximate. Enfield showed7820 degree-days (21.3S o C average) <strong>in</strong> 1976 and 7380 degree-days (20.22 0 Caverage) <strong>in</strong> 1978. St. Gormans showed_6230 degree-days <strong>in</strong> 1976 (17.06 0 eaverage) and 6790 degree-days (18.61 0 C average) <strong>in</strong> 1978. The differences<strong>in</strong> average and from year to year may have significance, but certa<strong>in</strong>lyneed to be related to volumes <strong>of</strong> water discharged if the data is to beused as an analytical tool./ ...
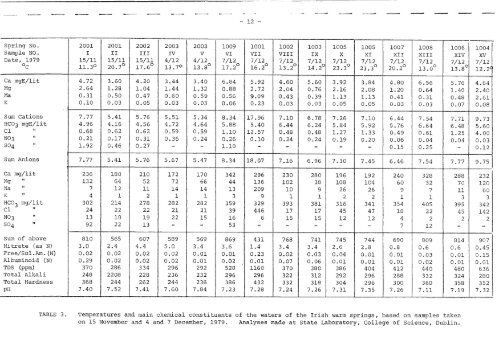
- 12 -iSpr<strong>in</strong>g No. 2001 2001 2002 2003 2003 1009 1001 1002 1003 1005 1005 1007 1008 1006 1004Sample NO. I II III IV V VI VII VIII IX X XI XII XIII XIV XVDate, 1979 15/11 15/11 15/11 4/12 4/12 7/12 7/12 7/12 7/12 7/12 7/12 7/12 7/12 7/12 7/12°c 11.3° 20.7° 17.6° 13.7° 13 .8° 17.2° 16.2° 13 .2° 14.2° 23.3° 23.3° 20.2° 13.0° 13.8° 12.2(Ca mgE/lit 4.72 3.60 4.20 3.44 3.40 6.84 5.92 4.60 5.60 3.92 3.84 4.80 6.56 5.76 4.64Mg 2.64 1.28 1.04 1.44 1.32 0.88 2.72 2.04 0.76 2.16 2.08 1.20 0.64 1.40 2.40Ma 0.31 0.50 0.47 0.60 0.59 0.56 9.09 0.43 0.39 1.13 1.13 0.41 0.31 0.48 2.61K 0.10 0.03 0.05 0.03 0.03 0.06 0.23 0.03 0.03 0.05 0.05 0.03 0.03 0.07 0.08Sum Cations 7.77 5.41 5.76 5.51 5.34 8.34 17.96 7.10 6.78 7.26 7.10 6.44 7.54 7.71 9.73HC03 mgE/lit 4.96 4.16 4.56 4.72 4.64 5.88 5.40 6.44 6.24 5.84 5.92 5.76 6.64 6.48 5.60Cl " 0.68 0.62 0.62 0.59 0.59 1.10 12.57 0.48 0.48 1.27 1.33 0.49 0.61 1.25 4.00N03 " 0.21 0.17 0.31 0.36 0.24 0.26 0.10 0.24 0.24 0.19 0.20 0.06 0.04 0.04 0.03S04 " 1. 92 0.46 0.27 - - l.10 - - - - - 0.15 0.25 - 0.12Sum Anions 7.77 5.41 5.76 5.67 5.47 8.34 18.07 7.16 6.96 7.30 7.45 6.46 7.54 7.77 9.75Ca mg/lit 236 180 210 172 170 342 296 230 280 196 192 240 328 288 232Mg " 132 64 52 72 66 44 136 102 38 108 104 60 32 70 120Na " 7 12 11 14 14 13 209 10 9 26 26 9 7 11 60K " 4 1 2 1 1 3 9 1 1 2 2 1 1 3 3HC0 mg/lit 3302 214 278 282 282 359 329 393 381 316 341 354 405 395 342Cl " 24 22 22 21 21 39 446 17 17 45 47 18 22 45 14211N0313 10 19 22 15 16 6 15 15 12 12 4 2 2 211S0492 22 13 - - 53 - - - - - 7 12 - -Sum <strong>of</strong> above 810 565 607 589 569 869 431 768 741 745 744 690 809 814 907Nitrate (as N) 3.0 2.4 4.4 5.0 3.4 3.6 1.4 3.4 3.4 2.6 2.8 0.8 0.6 0.6 0.45Free/Sol.Am. (N) 0.02 0.02 0.02 0.02 0.01 0.01 0.23 0.02 0.03 0.04 0.01 0.01 0.03 0.01 0.15Album<strong>in</strong>oid (N) 0.29 0.02 0.02 0.02 0.01 0.02 0.01 0.07 0.06 0.01 0.01 0.01 0.02 0.01 0.01TDS (ppm) 370 286 334 296 292 528 1160 370 380 386 404 412 440 480 636Total Alkali 248 2208 228 236 232 296 296 322 312 292 296 288 332 324 280Total Hardness 368 244 262 244 236 386 432 332 318 304 296 300 360 358 352pH 7.40 7.52 7.41 7.60 7.84 7.23 7.28 7.24 7.26 7.31 7.35 7.26 7.11 7.19 7.32TABLE 3. Temperatures and ma<strong>in</strong> chemical constituents <strong>of</strong> the waters <strong>of</strong> the Irish warm spr<strong>in</strong>gs, based on samples takenon 15 November and 4 and 7 December, 1979. Analyses made at State Laboratory, College <strong>of</strong> Science, Dubl<strong>in</strong>.