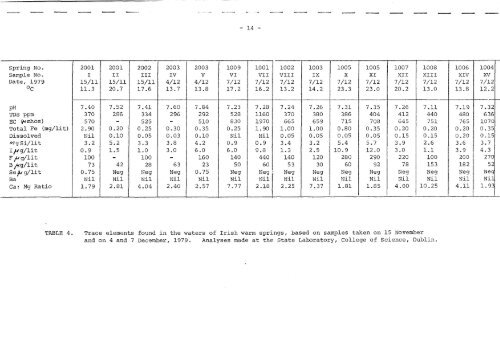
- 13 -11-6. Hydrochemical CharacteristicsInvestigators <strong>of</strong> one or other <strong>of</strong> the warm spr<strong>in</strong>gs have <strong>in</strong> the pasttaken samples and had chemical analyses made. In this respect, the report<strong>of</strong> Plunkett & Studdert (1883) on the Mallow Spa spr<strong>in</strong>g is <strong>of</strong> <strong>in</strong>terest;Fahy (1974, 1975) also had some chemical analyses made on the Enfield (1005)spr<strong>in</strong>g. But it was only towards the end <strong>of</strong> 1979 that there was asystematic sampl<strong>in</strong>g <strong>of</strong> almost all <strong>of</strong> the known spr<strong>in</strong>gs, with the analysescarried out under uniform conditions at the State Laboratory <strong>in</strong> the College<strong>of</strong> Science. The results <strong>of</strong> these analyses are presented here <strong>in</strong> Table 3and 4. The results are strictly comparable, though the absolute values<strong>of</strong> some <strong>of</strong> the trace elements (not normally determ<strong>in</strong>ed <strong>in</strong> water <strong>in</strong> thislaboratory) are less certa<strong>in</strong>. The percentage amounts <strong>of</strong> the major ions areplotted on the triangular diagram <strong>of</strong> Fig. 4, while the trace elements siand I are plotted aga<strong>in</strong>st temperatures on Fig. 5.(i) Major Anions and Cations. In general, the major ions<strong>in</strong>dicate rather normal groundwater issu<strong>in</strong>g from these spr<strong>in</strong>gs. TDS tendto lie <strong>in</strong> the range <strong>of</strong> 280 to 480 ppm, which is normal for Irish groundwatersfrom limestone aquifers. Much <strong>of</strong> the chlor<strong>in</strong>e is <strong>in</strong> the 15 to 30 mg/litrange, normal for such waters and reflect<strong>in</strong>g the rather high Cl content <strong>of</strong>Irish groundwaters (as Burdon & Cullen, 1980). However, it is clear thatthere are three spr<strong>in</strong>gs <strong>in</strong> Le<strong>in</strong>ster which have def<strong>in</strong>itely abnormal chemicalcharacteristics and this is also well-marked on Fig. 4.They are:NO. 1001 (Louisa Bridge) with Cl = 446 and TDS = 1160; No. 1004 (st. Patrick'sWell) with Cl = 142 and TDS = 636; and No. 1009 (St. Margarets) with Cl = 39and TDS = 582. From Fig. 2, it can be seen that these three spr<strong>in</strong>gs havealready been grouped together as ly<strong>in</strong>g "along the syncl<strong>in</strong>al structure<strong>in</strong>ferred from two Tournaisian outcrops" (Item 11-2. (i». It is unfortunatethat No. 1010 was not sampled <strong>in</strong> December, 1979, and that the existence<strong>of</strong> No. 1014 (Clonee) was reported only when this study had almost beencompleted. Repeated chemical analyses from these five spr<strong>in</strong>gs (1009, 1014, JOO]1004 and 1010) will be awaited with <strong>in</strong>terest.It will be noted that the other high Cl values (45 and 47 mg/lit)come from spr<strong>in</strong>gs Nos. 1005 and 1006, which are close together, but whichdiffer much <strong>in</strong> temperature.In fact, all efforts to f<strong>in</strong>d a direct relationship between themajor anions and cations <strong>in</strong> solution and the temperatures <strong>of</strong> the spr<strong>in</strong>gsproved unavail<strong>in</strong>g. It may be said that the ma<strong>in</strong> chemical composition <strong>of</strong>the Irish warm spr<strong>in</strong>gs is not related to the temperature <strong>of</strong> these spr<strong>in</strong>gs.The most m<strong>in</strong>eralized (No. 1001, Louisa Bridge) had a temperature <strong>of</strong> l6.2 o Con 7.12.79; the hottest (No. 1005, Enfield) has but some 400 ppm <strong>of</strong> TDS,but a temperature <strong>of</strong> 23.3 0 C on 7.12.79. The coolest is also rather highlym<strong>in</strong>eralized.(ii) Trace Elements. The trace elements determ<strong>in</strong>ed were Si, I,F, B, Se and Ba, as <strong>in</strong> Table 4. In addition total Fe and dissolved Fe weredeterm<strong>in</strong>ed, though it seemed improbable that they would yield diagnostic<strong>in</strong>formation. The accuracy <strong>of</strong> some <strong>of</strong> the determ<strong>in</strong>ations is doubtful, s<strong>in</strong>cesuch elements are not normally determ<strong>in</strong>ed <strong>in</strong> water analyses. It can be seenthat they are erratic. Efforts were made to relate them to temperature.In the cases <strong>of</strong> Si and I, there was some limited success, as shown on Fig. 5.
- 14 -Spr<strong>in</strong>g No. 2001 2001 2002 2003 2003 1009 1001 1002 1003 1005 1005 1007 1008 1006 1004Sample No. I II III IV V VI VII VIII IX X XI XII XIII XIV XVDate, 1979 15/11 15/11 15/11 4/12 4/12 7/12 7/12 7/12 7/12 7/12 7/12 7/12 7/12 7/12 7/12°c 11.3 20.7 17.6 13.7 13 .8 17.2 16.2 13 .2 14.2 23.3 23.0 20.2 13 .0 13 .8 12.2.--pH 7.40 7.52 7.41 7.60 7.84 7.23 7.28 7.24 7.26 7.31 7.35 7.26 7.11 7.19 7.32TDS ppm 370 286 334 296 292 528 1160 370 380 386 404 412 440 480 636EC ~mhos) 570 - 525 - 510 830 1970 665 659 715 708 645 751 765 1070Total Fe (mg/lit) 2.90 0.20 0.25 0.30 0.35 0.25 1.90 1.00 1.00 0.80 0.35 0.20 0.20 0.20 0.35Dissolved Nil 0.10 0.05 0.03 0.10 Nil Nil 0.05 0.05 0.05 0.05 0.15 0.15 0.20 0.15mgsi/lit 3.2 5.2 3.3 3.8 4.2 0.9 0.9 3.4 3.2 5.4 5.7 3.9 2.6 3.6 3.7If/g/lit 0.9 1.5 1.0 3.0 6.0 6.0 9.8 1.3 2.5 10.9 12.0 3.0 1.1 3.9 4.3F flg/lit 100 - 100 - 160 140 440 140 120 280 290 220 100 200 270B/f.g/lit 73 42 28 63 23 50 60 53 30 60 92 78 153 182 52SeJtg/lit 0.75 Neg Neg Neg 0.75 Neg Neg' Neg Neg Neg Neg Neg Neg Neg NegBa Nil Nil Nil Nil Nil Nil Nil Nil Nil Nil Nil Nil Nil Nil NilCa: Mg Ratio 1. 79 2.81 4.04 2.40 2.57 7.77 2.18 2.25 7.37 1.81 1.85 4.00 10.25 4.11 1. 93ITABLE 4.Trace elements found <strong>in</strong> the waters <strong>of</strong> Irish warm spr<strong>in</strong>gs, based on samples taken on 15 Novemberand on 4 and 7 December, 1979. Analyses made at the State Laboratory, College <strong>of</strong> Science, Dubl<strong>in</strong>.