Putting Meteorological and Oceanographic Data to Work - Caris
Putting Meteorological and Oceanographic Data to Work - Caris
Putting Meteorological and Oceanographic Data to Work - Caris

Create successful ePaper yourself
Turn your PDF publications into a flip-book with our unique Google optimized e-Paper software.
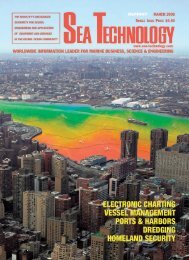
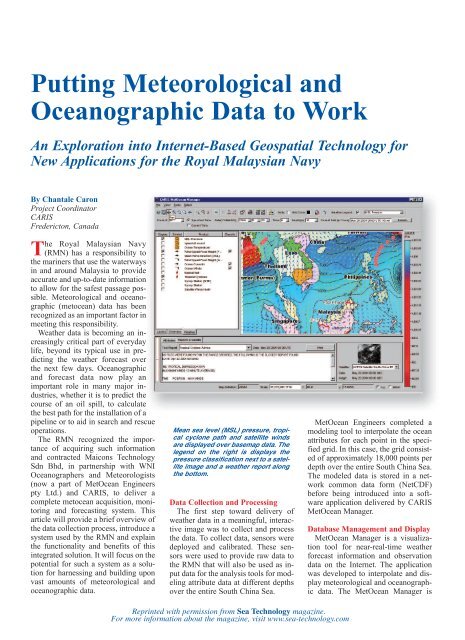
<strong>Putting</strong> <strong>Meteorological</strong> <strong>and</strong><strong>Oceanographic</strong> <strong>Data</strong> <strong>to</strong> <strong>Work</strong>An Exploration in<strong>to</strong> Internet-Based Geospatial Technology forNew Applications for the Royal Malaysian NavyBy Chantale CaronProject Coordina<strong>to</strong>rCARISFrederic<strong>to</strong>n, CanadaThe Royal Malaysian Navy(RMN) has a responsibility <strong>to</strong>the mariners that use the waterwaysin <strong>and</strong> around Malaysia <strong>to</strong> provideaccurate <strong>and</strong> up-<strong>to</strong>-date information<strong>to</strong> allow for the safest passage possible.<strong>Meteorological</strong> <strong>and</strong> oceanographic(me<strong>to</strong>cean) data has beenrecognized as an important fac<strong>to</strong>r inmeeting this responsibility.Weather data is becoming an increasinglycritical part of everydaylife, beyond its typical use in predictingthe weather forecast overthe next few days. <strong>Oceanographic</strong><strong>and</strong> forecast data now play animportant role in many major industries,whether it is <strong>to</strong> predict thecourse of an oil spill, <strong>to</strong> calculatethe best path for the installation of apipeline or <strong>to</strong> aid in search <strong>and</strong> rescueoperations.The RMN recognized the importanceof acquiring such information<strong>and</strong> contracted Maicons TechnologySdn Bhd, in partnership with WNIOceanographers <strong>and</strong> Meteorologists(now a part of MetOcean Engineerspty Ltd.) <strong>and</strong> CARIS, <strong>to</strong> deliver acomplete me<strong>to</strong>cean acquisition, moni<strong>to</strong>ring<strong>and</strong> forecasting system. Thisarticle will provide a brief overview ofthe data collection process, introduce asystem used by the RMN <strong>and</strong> explainthe functionality <strong>and</strong> benefits of thisintegrated solution. It will focus on thepotential for such a system as a solutionfor harnessing <strong>and</strong> building uponvast amounts of meteorological <strong>and</strong>oceanographic data.Mean sea level (MSL) pressure, tropicalcyclone path <strong>and</strong> satellite windsare displayed over basemap data. Thelegend on the right is displays thepressure classification next <strong>to</strong> a satelliteimage <strong>and</strong> a weather report alongthe bot<strong>to</strong>m.<strong>Data</strong> Collection <strong>and</strong> ProcessingThe first step <strong>to</strong>ward delivery ofweather data in a meaningful, interactiveimage was <strong>to</strong> collect <strong>and</strong> processthe data. To collect data, sensors weredeployed <strong>and</strong> calibrated. These sensorswere used <strong>to</strong> provide raw data <strong>to</strong>the RMN that will also be used as inputdata for the analysis <strong>to</strong>ols for modelingattribute data at different depthsover the entire South China Sea.MetOcean Engineers completed amodeling <strong>to</strong>ol <strong>to</strong> interpolate the oceanattributes for each point in the specifiedgrid. In this case, the grid consistedof approximately 18,000 points perdepth over the entire South China Sea.The modeled data is s<strong>to</strong>red in a networkcommon data form (NetCDF)before being introduced in<strong>to</strong> a softwareapplication delivered by CARISMetOcean Manager.<strong>Data</strong>base Management <strong>and</strong> DisplayMetOcean Manager is a visualization<strong>to</strong>ol for near-real-time weatherforecast information <strong>and</strong> observationdata on the Internet. The applicationwas developed <strong>to</strong> interpolate <strong>and</strong> displaymeteorological <strong>and</strong> oceanographicdata. The MetOcean Manager isReprinted with permission from Sea Technology magazine.For more information about the magazine, visit www.sea-technology.com
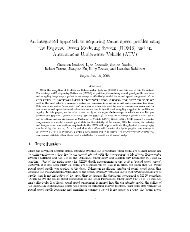
(Top) Tide height data displayed overbasemap data. The legend on the righ<strong>to</strong>utlines ocean temperature classification.(Middle) Web mapping service data <strong>and</strong>ocean winds are displayed over basemapdata. The legend on the right representsthe classification <strong>and</strong> symbols forthe winds.(Bot<strong>to</strong>m) Ocean temperature data displayedover basemap data. The legendon the right outlines ocean temperatureclassification.made up of two main components: adatabase <strong>and</strong> an end-user application.The data collected for display in<strong>to</strong> thesystem consists of meteorological <strong>and</strong>oceanographic data obtained or modeledon an hourly basis. The end-userapplication, which could consist of either adesk<strong>to</strong>p or a Internet-based client, is used <strong>to</strong> displaydetailed maps containing raster productssuch as ocean temperature, salinity, density <strong>and</strong>speed of sound, as well as vec<strong>to</strong>r-based productswhich include ocean winds <strong>and</strong> currents. Thisinformation may be used by a variety of RMNstakeholders <strong>to</strong> build informative <strong>and</strong> dynamicallychanging meteorological <strong>and</strong> oceanographicmaps. Combining this data with anInternet-based geospatial solution gives theRMN a new product that increases safety formariners by providing more accurate weatherforecasting, aid in emergency planning <strong>and</strong> inthe supply of information <strong>to</strong> a host of potentialnew users.Raster AttributesMetOcean attributes may be displayed withinthe RMN system using colors, con<strong>to</strong>ur lines or acombination of the two. Con<strong>to</strong>ur lines are cus<strong>to</strong>mizablein that the user may choosethe density of the con<strong>to</strong>urs as well aswhether corresponding annotations(numbers) should be displayed.Temperature, Depth <strong>and</strong> the Speed ofSound. Ocean temperature, in conjunctionwith other variables such as salinity<strong>and</strong> ocean depth, may be used for a largevariety of purposes such as calculatingthe speed of sound at a given depth ormeasuring <strong>and</strong> predicting the effects ofglobal warming for a particular area inthe ocean. Temperatures of the ocean a<strong>to</strong>r near its surface are generally warmerthan those found at greater depths.These temperatures also tend <strong>to</strong> fluctuateon a more regular interval, whiletemperatures at greater depths tend <strong>to</strong>remain more constant.Speed of sound in the ocean is highlydependent on the temperature <strong>and</strong> depthof the water. In general, the speed of
“Weather data is becoming an increasinglycritical part of everyday life, beyond its typicaluse in predicting the weather forecas<strong>to</strong>ver the next few days.”sound at or near the surface of the ocean is approximatelyfour times the speed of sound in the air, while the speed ofsound in cooler water, such as that found at greater oce<strong>and</strong>epths, is far slower. Speed of sound is important, as it canbe used <strong>to</strong> accurately calculate other attributes such as distancefrom one object <strong>to</strong> another, ocean depth, wave speed<strong>and</strong> a variety of other ocean properties.As mentioned, ocean depth plays an important role intemperature <strong>and</strong> speed of sound. It also has other practicalapplications that could be used by a number of organizationsincluding navies, oil companies <strong>and</strong> marine scientists.Such examples of other applications include, but are notlimited <strong>to</strong>, optimal <strong>and</strong>/or safe depths for submarines, calculatingpathways <strong>to</strong> lay underwater piping or searching forparticular organisms that tend <strong>to</strong> live at particular depths<strong>and</strong> temperatures.Salinity <strong>and</strong> Density. Over the past 100 years, the definitionof ocean salinity has been altered many times in anattempt <strong>to</strong> switch from scientifically correct <strong>to</strong> practical,<strong>and</strong> then back <strong>to</strong> a combination of the two. Early definitionswould state that salinity is the amount of solid materials, ingrams, that is dissolved in<strong>to</strong> one kilogram of seawater.However, this definition was also dependent upon thestates, conversions <strong>and</strong> oxidization of other elements suchas carbonate oxide <strong>and</strong> other organic matters. For the easeof underst<strong>and</strong>ing, this article will use the simplest of definitions<strong>and</strong> say that salinity is simply the amount of dissolvedmaterial, in grams, in one kilogram of seawater. From thisdefinition <strong>and</strong> the statistics provided above, it could be seenthat salinity <strong>and</strong> ocean density are related.Changes in salinity <strong>and</strong> temperature cause fluctuations inocean density. For example, a high-density section of waterwould exist where the ocean has high salinity <strong>and</strong> coolertemperatures.An area of the ocean with low density would have a combinationof warmer water <strong>and</strong> low salinity. Although salinityof the ocean changes very little, it is still important in calculatingaccurate densities, temperatures <strong>and</strong> speed ofsound.Another use of water density is the ability <strong>to</strong> calculatecurrents. One of the causes of the circulation of ocean wateris the difference in densities. Warm water tends <strong>to</strong> flow<strong>to</strong>ward water of lower density, while cooler water flows<strong>to</strong>ward higher dense areas. This explains how warm watermoves across the surface away from the equa<strong>to</strong>r, <strong>and</strong> coldwater moves below the surface <strong>to</strong>ward the equa<strong>to</strong>r.Sonic Layer Depth <strong>and</strong> Deep-Sound Channel/AxialDepth. It is often desired, when calculating data sets, <strong>to</strong> findthe limits or boundaries for a particular experiment. As canbe seen in all of the raster attributes mentioned above(directly or indirectly), speed of sound is affected by everything,whether it be density, temperature, depth, etc. Soniclayer depth <strong>and</strong> deep-sound channel/axial depth weredefined in an attempt <strong>to</strong> find the boundaries (limits) ofspeed of sound in the ocean. Deep-sound channel is a termused <strong>to</strong> represent a channel that exists at a particular depth,known as the axial depth, where the speed of sound is at aminimum. Sonic layer depth is related <strong>to</strong> the deep-soundchannel in that it describes the depth where the maximumspeed of sound exists between the axial depth <strong>and</strong> theocean’s surface. Because of the properties of sound inwater, <strong>and</strong> the fact that it behaves <strong>and</strong> refracts differently atvarious depths <strong>and</strong> densities, these two measurements canbe very useful in situations such as naval warfare where anavy would desire <strong>to</strong> find the optimal depth <strong>to</strong> place a submarine<strong>to</strong> avoid detection from surface vessels.Vec<strong>to</strong>r AttributesThe term vec<strong>to</strong>r, in regard <strong>to</strong> this article, will be used <strong>to</strong>describe meteorological <strong>and</strong> oceanographic attributes that“The first step <strong>to</strong>ward delivery of weatherdata in a meaningful, interactive image was<strong>to</strong> collect <strong>and</strong> process the data.”have an associated magnitude <strong>and</strong> direction. All vec<strong>to</strong>rattributes may be displayed within MetOcean Managerusing either arrows or wind symbols. As with raster attributes,vec<strong>to</strong>r attributes are cus<strong>to</strong>mizable. The user may definea color range when dealing with a particular classification.An example classification could be <strong>to</strong> display windsthat are three knots or less in blue, winds that are betweenthree <strong>and</strong> eight knots in yellow <strong>and</strong> winds that are betweeneight <strong>and</strong> 12 knots in red.The length of an arrow (or line) varies with the magnitudeof the attribute <strong>and</strong> is relative <strong>to</strong> the amount <strong>and</strong> size ofother data being viewed. A legend is given within the application<strong>to</strong> help underst<strong>and</strong> the magnitude of a particulararrow.Currents play a vital role in many oceanic projects,including tracking certain types of marine activity, navigation<strong>and</strong> even search <strong>and</strong> rescue. Currents often differ for aparticular point depending on the depth. Because of this,currents are displayed with respect <strong>to</strong> a particular oce<strong>and</strong>epth. Three major components: wind, Earth’s rotation <strong>and</strong>density affect surface currents. In general, winds tend <strong>to</strong> circulateclockwise in the Northern Hemisphere <strong>and</strong> counterclockwisein the Southern Hemisphere. These winds applya force <strong>to</strong> the water particles near the surface of the ocean,causing them <strong>to</strong> move in the direction of the wind.In addition <strong>to</strong> the force applied <strong>to</strong> the water particles nearthe surface due <strong>to</strong> wind, the Earth’s rotation also causes aforce <strong>to</strong> be applied <strong>to</strong> the water. Currents that are caused bythe Earth’s rotation that flow <strong>to</strong>ward the magnetic polestend <strong>to</strong> be narrower <strong>and</strong> stronger as they flow in the samedirection as the winds. However, currents caused by theEarth’s rotation that flow <strong>to</strong>ward the equa<strong>to</strong>r apply anopposing force <strong>to</strong> those caused by the wind <strong>and</strong>, thus, createless powerful movement.Deep-water currents are affected by thermohaline circulation.When warm water from the equa<strong>to</strong>r moves <strong>to</strong>wardthe poles, cooler water is then displaced <strong>to</strong>ward the bot<strong>to</strong>m
“MetOcean Manager is a visualization <strong>to</strong>olfor near-real-time weather forecast information<strong>and</strong> observation data on the Internet.”of the ocean. The new, cooler water then displaces the waterthat existed previously <strong>to</strong>ward the equa<strong>to</strong>r. This circulationpattern is known as thermohaline circulation.ConclusionsTypical geographical information system (GIS) functionalityincludes data entry, spatial <strong>and</strong> textual querying, dataanalysis, data management <strong>and</strong> the production of hardcopyimages <strong>and</strong> maps. Overall, the GIS functionality in theRMN MetOcean system provides the flexibility <strong>and</strong> powernot only <strong>to</strong> harness vast quantities of data, but also convertthat data in<strong>to</strong> powerful information. This information canassist a variety of industries in making important decisionson a daily, <strong>and</strong> even hourly, basis. /st/For more information, visit our website at www.sea-technology.com.Chantale Caron is the product coordina<strong>to</strong>r for the CARIS Met-Ocean Manager. She has over five years’experience providing tailoredgeomatics software for clients varying from fleet managementsolutions <strong>to</strong> municipal <strong>and</strong> government-based solutions.