Article - The New IHO S-102 Standard - Caris
Article - The New IHO S-102 Standard - Caris
Article - The New IHO S-102 Standard - Caris

You also want an ePaper? Increase the reach of your titles
YUMPU automatically turns print PDFs into web optimized ePapers that Google loves.
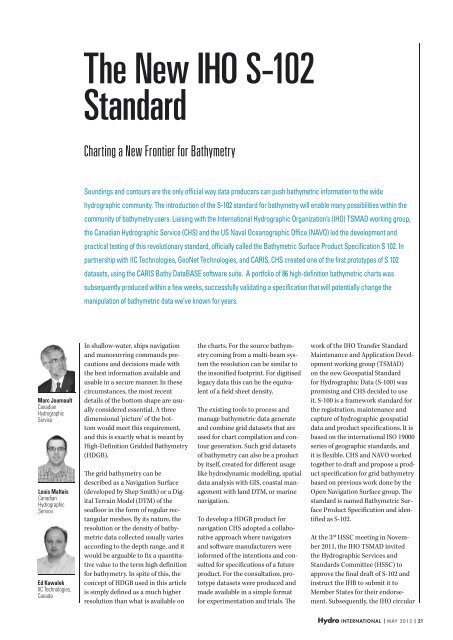
<strong>The</strong> <strong>New</strong> <strong>IHO</strong> S-<strong>102</strong><br />
<strong>Standard</strong><br />
Charting a <strong>New</strong> Frontier for Bathymetry<br />
Soundings and contours are the only official way data producers can push bathymetric information to the wide<br />
hydrographic community. <strong>The</strong> introduction of the S-<strong>102</strong> standard for bathymetry will enable many possibilities within the<br />
community of bathymetry users. Liaising with the International Hydrographic Organization’s (<strong>IHO</strong>) TSMAD working group,<br />
the Canadian Hydrographic Service (CHS) and the US Naval Oceanographic Office (NAVO) led the development and<br />
practical testing of this revolutionary standard, officially called the Bathymetric Surface Product Specification S <strong>102</strong>. In<br />
partnership with IIC Technologies, GeoNet Technologies, and CARIS, CHS created one of the first prototypes of S <strong>102</strong><br />
datasets, using the CARIS Bathy DataBASE software suite. A portfolio of 86 high-definition bathymetric charts was<br />
subsequently produced within a few weeks, successfully validating a specification that will potentially change the<br />
manipulation of bathymetric data we’ve known for years.<br />
Marc Journault<br />
Canadian<br />
Hydrographic<br />
Service<br />
Louis Maltais<br />
Canadian<br />
Hydrographic<br />
Service<br />
Ed Kuwalek<br />
IIC Technologies,<br />
Canada<br />
In shallow-water, ships navigation<br />
and manoeuvring commands precautions<br />
and decisions made with<br />
the best information available and<br />
usable in a secure manner. In these<br />
circumstances, the most recent<br />
details of the bottom shape are usually<br />
considered essential. A three<br />
dimensional ‘picture’ of the bottom<br />
would meet this requirement,<br />
and this is exactly what is meant by<br />
High-Definition Gridded Bathymetry<br />
(HDGB).<br />
<strong>The</strong> grid bathymetry can be<br />
described as a Navigation Surface<br />
(developed by Shep Smith) or a Digital<br />
Terrain Model (DTM) of the<br />
seafloor in the form of regular rectangular<br />
meshes. By its nature, the<br />
resolution or the density of bathymetric<br />
data collected usually varies<br />
according to the depth range, and it<br />
would be arguable to fix a quantitative<br />
value to the term high definition<br />
for bathymetry. In spite of this, the<br />
concept of HDGB used in this article<br />
is simply defined as a much higher<br />
resolution than what is available on<br />
the charts. For the source bathymetry<br />
coming from a multi-beam system<br />
the resolution can be similar to<br />
the insonified footprint. For digitised<br />
legacy data this can be the equivalent<br />
of a field sheet density.<br />
<strong>The</strong> existing tools to process and<br />
manage bathymetric data generate<br />
and combine grid datasets that are<br />
used for chart compilation and contour<br />
generation. Such grid datasets<br />
of bathymetry can also be a product<br />
by itself, created for different usage<br />
like hydrodynamic modelling, spatial<br />
data analysis with GIS, coastal management<br />
with land DTM, or marine<br />
navigation.<br />
To develop a HDGB product for<br />
navigation CHS adopted a collaborative<br />
approach where navigators<br />
and software manufacturers were<br />
informed of the intentions and consulted<br />
for specifications of a future<br />
product. For the consultation, prototype<br />
datasets were produced and<br />
made available in a simple format<br />
for experimentation and trials. <strong>The</strong><br />
work of the <strong>IHO</strong> Transfer <strong>Standard</strong><br />
Maintenance and Application Development<br />
working group (TSMAD)<br />
on the new Geospatial <strong>Standard</strong><br />
for Hydrographic Data (S-100) was<br />
promising and CHS decided to use<br />
it. S-100 is a framework standard for<br />
the registration, maintenance and<br />
capture of hydrographic geospatial<br />
data and product specifications. It is<br />
based on the international ISO 19000<br />
series of geographic standards, and<br />
it is flexible. CHS and NAVO worked<br />
together to draft and propose a product<br />
specification for grid bathymetry<br />
based on previous work done by the<br />
Open Navigation Surface group. <strong>The</strong><br />
standard is named Bathymetric Surface<br />
Product Specification and identified<br />
as S-<strong>102</strong>.<br />
At the 3 rd HSSC meeting in November<br />
2011, the <strong>IHO</strong> TSMAD invited<br />
the Hydrographic Services and<br />
<strong>Standard</strong>s Committee (HSSC) to<br />
approve the final draft of S-<strong>102</strong> and<br />
instruct the IHB to submit it to<br />
Member States for their endorsement.<br />
Subsequently, the <strong>IHO</strong> circular<br />
Hydro international | may 2012 | 21
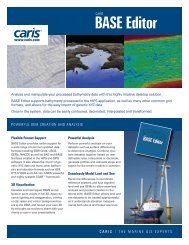
Figure 1: Example<br />
of a level 2<br />
(coastal) tiling<br />
scheme for the<br />
St.Lawrence River.<br />
letter 10/2012 requested the Member<br />
States to review and consider the<br />
draft edition of S-<strong>102</strong> which is available<br />
on the <strong>IHO</strong> website.<br />
To partition HDGB coverage, to allow<br />
unambiguous dataset exchange and<br />
to facilitate the updates, CHS intends<br />
to implement a systematic tiling<br />
scheme with three levels of resolution.<br />
Each tile is comprised of 1000 by<br />
1000 grid cells, the level 1 (harbour)<br />
is 0.02º x 0.02º, the level 2 (coastal) is<br />
0.1º x 0.1º, and the level 3 (overview) is<br />
1º x 1º. For the low and mid latitudes,<br />
the orientation of the tiles fit the<br />
version of the <strong>IHO</strong> S-<strong>102</strong> product<br />
specification. Developing a uniform,<br />
high-definition bathymetric surface<br />
for the St. Lawrence River between<br />
ports of Quebec and Montreal was the<br />
key goal for the project. In addition, as<br />
this was the first attempt to produce<br />
a large number of datasets based on<br />
this new product specification, the<br />
project provided an ideal opportunity<br />
to validate the feasibility of S-<strong>102</strong> production<br />
in practice.<br />
<strong>The</strong> main requirements for the portfolio<br />
included creating seamless<br />
data coverage with a final surface<br />
S-100 framework standard<br />
represents a step foreword for<br />
electronic navigation products<br />
and services<br />
meridians and parallels with an origin<br />
based on a round number in latitude<br />
and longitude. Figure 1 shows an<br />
example of the tiling scheme.<br />
Production of Datasets for Trials<br />
In January 2011, CHS contracted<br />
IIC Technologies and GeoNet Technologies<br />
to produce a portfolio of<br />
86 HDGB datasets based on a draft<br />
grid resolution of 0.0001º (approximately<br />
8 metres) divided into 0.1º x<br />
0.1º tiled datasets. <strong>The</strong> final bathymetric<br />
surface needed to be created<br />
by integrating a variety of source<br />
datasets available for the area, ranging<br />
from sparse sounding sets to<br />
much higher resolution grid data<br />
for channels, while also using ENCderived<br />
high-water lines along with<br />
the corresponding drying spot values.<br />
<strong>The</strong> intention behind using all<br />
available source data was to integrate<br />
all information in a complete dataset,<br />
capable of significantly enhancing<br />
the information already available<br />
on the ENC cells. Similarly the project<br />
required the deliverables to be provided<br />
in multiple formats including<br />
CSAR (CARIS Spatial Archive), BAG<br />
and 32-bit GeoTiff files to cater to a<br />
variety of potential end-users.<br />
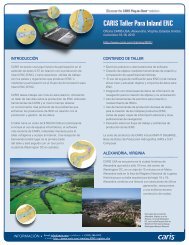
<strong>The</strong> production processes consisted<br />
of four main stages: source data<br />
assessment and preparation, point<br />
data processing, surface data integration<br />
and conflict resolution, and<br />
final product surface extraction<br />
and export. During the first stage all<br />
source data was assessed and prepared<br />
for production. CARIS S-57<br />
Composer and BASE Editor were<br />
used to create all auxiliary components,<br />
such as the tiling scheme, coverage,<br />
and breakline vector layers. <strong>The</strong><br />
same tools were also used to cut all<br />
data sources into individual data tiles<br />
to facilitate their efficient processing.<br />
During stage two the XYZ point<br />
data was loaded into BASE Editor<br />
and used to build a TIN model which<br />
was enhanced by the addition of the<br />
high-water-based breakline vector<br />
layer. Subsequently, a high-resolution<br />
bathymetric surface was interpolated<br />
from the TIN models for each dataset.<br />
During stage three the additional<br />
22 | may 2012 | Hydro international
which will be identified as mandatory,<br />
conditional or optional, will be<br />
selected from these ISO 19115 metadata<br />
packages.<br />
Figure 2: S-<strong>102</strong> Production Process.<br />
high-definition surface data available<br />
for channels was merged with<br />
the product surface data created in<br />
stage two. This was achieved by using<br />
rule-based conflict resolution tool<br />
available in BASE Editor. In the final<br />
stage the coverage polygon was used<br />
to extract the final product surface,<br />
effectively facilitating a complete<br />
river bank to river bank data coverage.<br />
<strong>The</strong>reafter BASE Editor was used<br />
to export CSAR and BAG deliverables<br />
and CARIS Easy View was used<br />
to export 32-bit GeoTiff rasters. Figure<br />
2 illustrates the key stages of the<br />
data production process used during<br />
the project.<br />
All project goals were successfully<br />
achieved and the required portfolio<br />
of 86 HDGB datasets was efficiently<br />
produced, confirming the feasibility<br />
of HDGB data production using the<br />
currently available CARIS production<br />
tools.<br />
Generation of S-<strong>102</strong><br />
Bathymetry Grids<br />
As described above, the interpolated<br />
grids from the point data are combined<br />
with the high-definition grids<br />
from the ship channel to produce the<br />
final grids for each cell, in the CSAR<br />
format, which are then exported to<br />
the desired carrier format of the grid.<br />
<strong>The</strong> draft S-<strong>102</strong> standard follows the<br />
principle of separating the ‘carrier’<br />
from the ‘content’ which means that<br />
the encoding of the grids will be flexible.<br />
Following that principle, the<br />
CARIS software tools provide choices<br />
for export formats. At the time of this<br />
S-<strong>102</strong> prototype work, the choices<br />
were:<br />
• 32bit Floating Point GeoTIFF format.<br />
This option for a carrier format<br />
is available from the GDAL<br />
open source library ( 1). <strong>The</strong><br />
32bit floating point option is used<br />
so that the depth values can be<br />
encoded without loss of precision.<br />
• BAG format. At the time, the<br />
CARIS Bathy DataBASE (BDB) v3.1<br />
supported BAG v1.3. <strong>The</strong> support<br />
for BAG format is possible through<br />
the API provided by the Open Navigation<br />
Surface Working Group (<br />
2) of which CARIS is a participant.<br />
Since then, BDB has been updated<br />
to support BAG v1.4. CARIS is currently<br />
working with the ONSWG on<br />
BAG v1.5, which will be supported<br />
when finalised and released.<br />
Metadata<br />
Adjusting this production line to<br />
match the coming S-<strong>102</strong> standard is<br />
going to require the creation of metadata<br />
that is compliant with the S-<strong>102</strong><br />
profile. <strong>The</strong> details of the S <strong>102</strong> metadata<br />
profile are still being developed<br />
but many aspects of the content are<br />
already known. Fortunately, this area<br />
has received significant attention<br />
over the past two years at CARIS with<br />
the creation of the metadata profile<br />
for the CSAR format that is compliant<br />
with the ISO 19115 / 19115-2 standards<br />
and using XML encoding from<br />
ISO 19139. Drafts of the S-<strong>102</strong> standard<br />
indicate that its metadata profile<br />
will share many of the same elements<br />
that are already being populated in<br />
exported CSAR metadata XML files.<br />
<strong>The</strong> drafts of S-<strong>102</strong> metadata profile<br />
indicate that most of the core metadata<br />
elements in the profile, each of<br />
Evolution of CARIS BDB and<br />
S-<strong>102</strong> Software Tools<br />
In the period since these prototype<br />
S-<strong>102</strong> gridded products were produced,<br />
the software tools have evolved<br />
which could improve the workflow<br />
even further. For example, the Warp<br />
function, which has been available<br />
since BDB 3.2, can transform a gridded<br />
surface to a new coordinate system<br />
and/or re-sample the surface<br />
onto a new grid resolution. This could<br />
save steps in turning what started out<br />
as projected bathymetry in grid resolutions<br />
of metres on the ground, into<br />
unprojected grids at the appropriate<br />
decimal degree resolutions with one<br />
function.<br />
<strong>The</strong> next step in the evolution of software<br />
tools for S-<strong>102</strong> production will<br />
be the creation of a new Export to<br />
S-<strong>102</strong> procedure that addresses the<br />
following all in one function:<br />
• Take a CSAR grid as input which<br />
has been prepared with the correct<br />
coordinate system and grid<br />
resolution.<br />
• Select an option for the output ‘carrier’<br />
format of the gridded bathymetry.<br />
(e.g. GeoTIFF, BAG, and others<br />
as required)<br />
• Optionally apply a tiling scheme<br />
which will cut the input grid into<br />
the desired tiles of specified width/<br />
height in decimal degrees.<br />
• Apply a defined naming convention<br />
to the output tiled files.<br />
• Generate an accompanying XML<br />
metadata. This metadata could<br />
then be used by data producers to<br />
populate a metadata catalogue web<br />
service<br />
S-<strong>102</strong> Gridded Bathymetry<br />
on the Web<br />
<strong>The</strong> CARIS web mapping solution,<br />
Spatial Fusion Enterprise (SFE), supports<br />
the discovery and dissemination<br />
of high-definition bathymetry<br />
through the Internet using OGC,<br />
Open Geospatial Consortium ( 3),<br />
standard formats. S-<strong>102</strong> bathymetric<br />
datasets residing in the CARIS BDB<br />
database as CSAR grids are requested<br />
by SFE through a specialised bathymetry<br />
web service. <strong>The</strong> CSAR format<br />
was designed with the optimisation<br />
Hydro international | may 2012 | 23
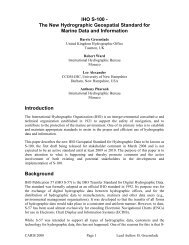
Figure 3: Filtered ENC and S-<strong>102</strong> in background.<br />
required for web distribution of this<br />
type of data in mind. OGC requests<br />
are made from any OGC capable client.<br />
<strong>The</strong> SFE Server handles the OGC<br />
request and returns the relevant information<br />
residing in the bathymetry<br />
database. SFE currently supports the<br />
OGC WMS, WMTS or WCS services<br />
for bathymetry data: it is the WCS<br />
(Web Coverage Service) that provides<br />
download capabilities for the grids<br />
including options for the format to be<br />
received from the download. Efficient<br />
browsing and simple query capabilities<br />
are increasingly being provided<br />
through the use of WMTS (Web Map<br />
Tile Service) which is a variant on<br />
the traditional WMS (Web Map Service)<br />
protocol which chunks data into<br />
image tiles. <strong>The</strong>se tiles are cached on<br />
initial draw meaning that the next<br />
time an image request is made the tile<br />
is drawn from cache rather than by<br />
going back to the database.<br />
Use of S-<strong>102</strong> for navigation<br />
With S-<strong>102</strong> it will be easy for hydrographers<br />
to provide navigators with<br />
HDGB datasets very rapidly to enrich<br />
and update the information of their<br />
ENCs. Partitioned into standardised<br />
regular geographic cells, the provision<br />
of updates becomes easy by just supplying<br />
an entire new cell dataset with<br />
the new bathymetry to the users who<br />
then just supersedes the tile.<br />
A possible way to use HDGB for navigation<br />
is to put the S-<strong>102</strong> data in the<br />
background with an overlap of S-101<br />
without the display of S-101 soundings,<br />
depth areas and contours.<br />
Figure 3 shows such usage.<br />
But electronic chart systems manufacturers<br />
can do more than just displaying<br />
it. <strong>The</strong> HDGB can be used: to<br />
generate safety contour on the fly; to<br />
compute the available water column<br />
by the addition of water level (tidal<br />
data) on top of the bathymetry; to calculate<br />
a dynamic under keel clearance;<br />
etc.<br />
<strong>The</strong> exploitation of HDGB in an innovative<br />
way is left to the users and the<br />
software industry. <strong>The</strong> CHS and its<br />
partners wish to involve them at an<br />
early stage of design to consider feedback<br />
from the users’ communities.<br />
Conclusion<br />
<strong>The</strong> <strong>IHO</strong> S-100 framework standard<br />
represents a step foreword for<br />
electronic navigation products and<br />
services. This flexible standard is a<br />
building block to rethink the way<br />
hydrographic organisations (HO) can<br />
deliver their official data and services.<br />
This S-<strong>102</strong> experiment clearly showed<br />
how modern tools and standards will<br />
enable quick delivery of rich bathymetric<br />
information. It’s time to take<br />
a step ahead and test these datasets<br />
with users. This year the focus will be<br />
on getting the ECS and ECDIS manufacturers<br />
involved in exploring the<br />
possibilities of S-<strong>102</strong>.<br />
<strong>The</strong> Authors<br />
Marc Journault has been working for<br />
the Canadian Hydrographic Service for 28<br />
years. He is manager of the Quebec region’s<br />
Marine Geomatics Division, responsible for<br />
technological support and development in<br />
the fields of hydrographic surveys, nautical<br />
publications and marine services.<br />
Louis Maltais has been working for the<br />
Canadian Hydrographic Service (CHS) for 13<br />
years. He is involved in numerous R&D projects,<br />
implementing solutions to improve productivity,<br />
efficiencies and to better meet the clients’<br />
needs.<br />
Ed Kuwalek is the director of R&D at IIC<br />
Technologies in North Vancouver, Canada. Mr.<br />
Kuwalek has 18 years of experience in the field<br />
of nautical charting, electronic-chart production<br />
systems and spatial data conversions. He has<br />
been involved in the technical leadership of<br />
many industry-leading projects and is an active<br />
participant in the <strong>IHO</strong> Transfer <strong>Standard</strong> and<br />
Maintenance Working Group.<br />
1. www.gdal.org<br />
2. www.opennavsurf.org<br />
3. www.opengeospatial.org<br />
Hydro international | may 2012 | 25