instruments in interest-rate, currency and ... - Volksbank AG
instruments in interest-rate, currency and ... - Volksbank AG
instruments in interest-rate, currency and ... - Volksbank AG

Create successful ePaper yourself
Turn your PDF publications into a flip-book with our unique Google optimized e-Paper software.
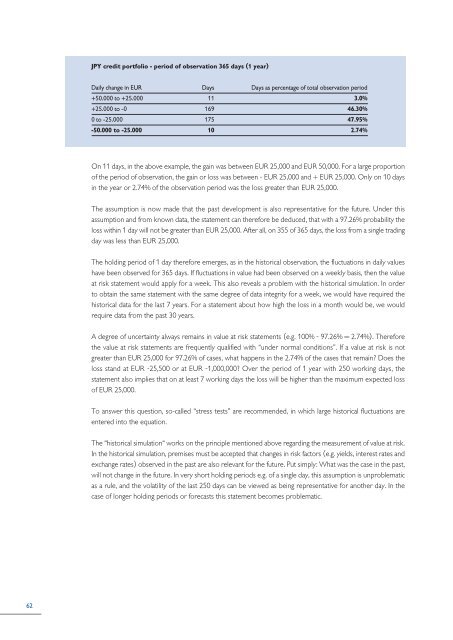
JPY credit portfolio - period of observation 365 days (1 year)Daily change <strong>in</strong> EUR Days Days as percentage of total observation period+50.000 to +25.000 11 3.0%+25.000 to -0 169 46.30%0 to -25.000 175 47.95%-50.000 to -25.000 10 2.74%On 11 days, <strong>in</strong> the above example, the ga<strong>in</strong> was between EUR 25,000 <strong>and</strong> EUR 50,000. For a large proportionof the period of observation, the ga<strong>in</strong> or loss was between - EUR 25,000 <strong>and</strong> + EUR 25,000. Only on 10 days<strong>in</strong> the year or 2.74% of the observation period was the loss greater than EUR 25,000.The assumption is now made that the past development is also representative for the future. Under thisassumption <strong>and</strong> from known data, the statement can therefore be deduced, that with a 97.26% probability theloss with<strong>in</strong> 1 day will not be greater than EUR 25,000. After all, on 355 of 365 days, the loss from a s<strong>in</strong>gle trad<strong>in</strong>gday was less than EUR 25,000.The hold<strong>in</strong>g period of 1 day therefore emerges, as <strong>in</strong> the historical observation, the fluctuations <strong>in</strong> daily valueshave been observed for 365 days. If fluctuations <strong>in</strong> value had been observed on a weekly basis, then the valueat risk statement would apply for a week. This also reveals a problem with the historical simulation. In orderto obta<strong>in</strong> the same statement with the same degree of data <strong>in</strong>tegrity for a week, we would have required thehistorical data for the last 7 years. For a statement about how high the loss <strong>in</strong> a month would be, we wouldrequire data from the past 30 years.A degree of uncerta<strong>in</strong>ty always rema<strong>in</strong>s <strong>in</strong> value at risk statements (e.g. 100% - 97.26% = 2.74%). Thereforethe value at risk statements are frequently qualified with “under normal conditions”. If a value at risk is notgreater than EUR 25,000 for 97.26% of cases, what happens <strong>in</strong> the 2.74% of the cases that rema<strong>in</strong>? Does theloss st<strong>and</strong> at EUR -25,500 or at EUR -1,000,000? Over the period of 1 year with 250 work<strong>in</strong>g days, thestatement also implies that on at least 7 work<strong>in</strong>g days the loss will be higher than the maximum expected lossof EUR 25,000.To answer this question, so-called “stress tests” are recommended, <strong>in</strong> which large historical fluctuations areentered <strong>in</strong>to the equation.The “historical simulation“ works on the pr<strong>in</strong>ciple mentioned above regard<strong>in</strong>g the measurement of value at risk.In the historical simulation, premises must be accepted that changes <strong>in</strong> risk factors (e.g. yields, <strong>in</strong>terest <strong>rate</strong>s <strong>and</strong>exchange <strong>rate</strong>s) observed <strong>in</strong> the past are also relevant for the future. Put simply: What was the case <strong>in</strong> the past,will not change <strong>in</strong> the future. In very short hold<strong>in</strong>g periods e.g. of a s<strong>in</strong>gle day, this assumption is unproblematicas a rule, <strong>and</strong> the volatility of the last 250 days can be viewed as be<strong>in</strong>g representative for another day. In thecase of longer hold<strong>in</strong>g periods or forecasts this statement becomes problematic.62