Mixture Density Mercer Kernels - Intelligent Systems Division - NASA
Mixture Density Mercer Kernels - Intelligent Systems Division - NASA
Mixture Density Mercer Kernels - Intelligent Systems Division - NASA

You also want an ePaper? Increase the reach of your titles
YUMPU automatically turns print PDFs into web optimized ePapers that Google loves.
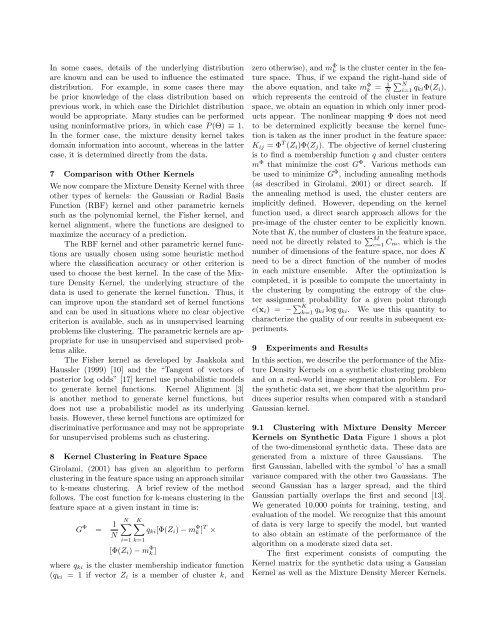
In some cases, details of the underlying distributionare known and can be used to influence the estimateddistribution. For example, in some cases there maybe prior knowledge of the class distribution based onprevious work, in which case the Dirichlet distributionwould be appropriate. Many studies can be performedusing noninformative priors, in which case P (Θ) ≡ 1.In the former case, the mixture density kernel takesdomain information into account, whereas in the lattercase, it is determined directly from the data.7 Comparison with Other <strong>Kernels</strong>We now compare the <strong>Mixture</strong> <strong>Density</strong> Kernel with threeother types of kernels: the Gaussian or Radial BasisFunction (RBF) kernel and other parametric kernelssuch as the polynomial kernel, the Fisher kernel, andkernel alignment, where the functions are designed tomaximize the accuracy of a prediction.The RBF kernel and other parametric kernel functionsare usually chosen using some heuristic methodwhere the classification accuracy or other criterion isused to choose the best kernel. In the case of the <strong>Mixture</strong><strong>Density</strong> Kernel, the underlying structure of thedata is used to generate the kernel function. Thus, itcan improve upon the standard set of kernel functionsand can be used in situations where no clear objectivecriterion is available, such as in unsupervised learningproblems like clustering. The parametric kernels are appropriatefor use in unsupervised and supervised problemsalike.The Fisher kernel as developed by Jaakkola andHaussler (1999) [10] and the “Tangent of vectors ofposterior log odds” [17] kernel use probabilistic modelsto generate kernel functions. Kernel Alignment [3]is another method to generate kernel functions, butdoes not use a probabilistic model as its underlyingbasis. However, these kernel functions are optimized fordiscriminative performance and may not be appropriatefor unsupervised problems such as clustering.8 Kernel Clustering in Feature SpaceGirolami, (2001) has given an algorithm to performclustering in the feature space using an approach similarto k-means clustering. A brief review of the methodfollows. The cost function for k-means clustering in thefeature space at a given instant in time is:G Φ = 1 NN∑i=1 k=1[Φ(Z i ) − m Φ k ]K∑q ki [Φ(Z i ) − m Φ k ] T ×where q ki is the cluster membership indicator function(q ki = 1 if vector Z i is a member of cluster k, andzero otherwise), and m Φ kis the cluster center in the featurespace. Thus, if we expand the right-hand side ofthe above equation, and take m Φ k = 1 ∑ NN i=1 q kiΦ(Z i ),which represents the centroid of the cluster in featurespace, we obtain an equation in which only inner productsappear. The nonlinear mapping Φ does not needto be determined explicitly because the kernel functionis taken as the inner product in the feature space:K ij = Φ T (Z i )Φ(Z j ). The objective of kernel clusteringis to find a membership function q and cluster centersm Φ that minimize the cost G Φ . Various methods canbe used to minimize G Φ , including annealing methods(as described in Girolami, 2001) or direct search. Ifthe annealing method is used, the cluster centers areimplicitly defined. However, depending on the kernelfunction used, a direct search approach allows for thepre-image of the cluster center to be explicitly known.Note that K, the number of clusters in the feature space,need not be directly related to ∑ Mc=1 C m, which is thenumber of dimensions of the feature space, nor does Kneed to be a direct function of the number of modesin each mixture ensemble. After the optimization iscompleted, it is possible to compute the uncertainty inthe clustering by computing the entropy of the clusterassignment probability for a given point throughe(x i ) = − ∑ Kk=1 q ki log q ki . We use this quantity tocharacterize the quality of our results in subsequent experiments.9 Experiments and ResultsIn this section, we describe the performance of the <strong>Mixture</strong><strong>Density</strong> <strong>Kernels</strong> on a synthetic clustering problemand on a real-world image segmentation problem. Forthe synthetic data set, we show that the algorithm producessuperior results when compared with a standardGaussian kernel.9.1 Clustering with <strong>Mixture</strong> <strong>Density</strong> <strong>Mercer</strong><strong>Kernels</strong> on Synthetic Data Figure 1 shows a plotof the two-dimensional synthetic data. These data aregenerated from a mixture of three Gaussians. Thefirst Gaussian, labelled with the symbol ’o’ has a smallvariance compared with the other two Gaussians. Thesecond Gaussian has a larger spread, and the thirdGaussian partially overlaps the first and second [13].We generated 10,000 points for training, testing, andevaluation of the model. We recognize that this amountof data is very large to specify the model, but wantedto also obtain an estimate of the performance of thealgorithm on a moderate sized data set.The first experiment consists of computing theKernel matrix for the synthetic data using a GaussianKernel as well as the <strong>Mixture</strong> <strong>Density</strong> <strong>Mercer</strong> <strong>Kernels</strong>.