Mixture Density Mercer Kernels - Intelligent Systems Division - NASA
Mixture Density Mercer Kernels - Intelligent Systems Division - NASA
Mixture Density Mercer Kernels - Intelligent Systems Division - NASA

Create successful ePaper yourself
Turn your PDF publications into a flip-book with our unique Google optimized e-Paper software.
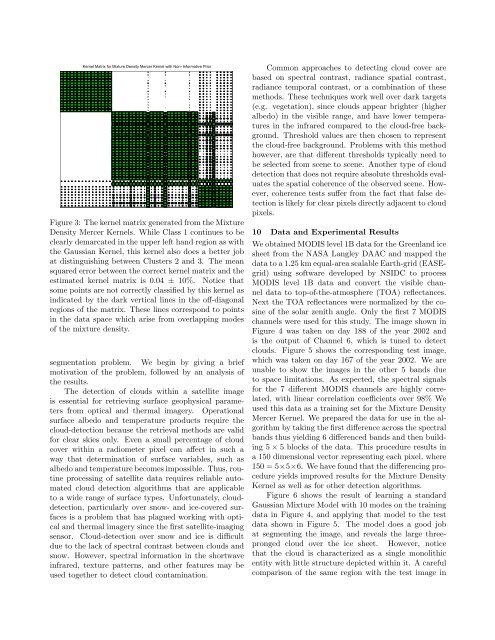
Kernel Matrix for <strong>Mixture</strong> <strong>Density</strong> <strong>Mercer</strong> Kernel with Non−Informative PriorFigure 3: The kernel matrix generated from the <strong>Mixture</strong><strong>Density</strong> <strong>Mercer</strong> <strong>Kernels</strong>. While Class 1 continues to beclearly demarcated in the upper left hand region as withthe Gaussian Kernel, this kernel also does a better jobat distinguishing between Clusters 2 and 3. The meansquared error between the correct kernel matrix and theestimated kernel matrix is 0.04 ± 10%. Notice thatsome points are not correctly classified by this kernel asindicated by the dark vertical lines in the off-diagonalregions of the matrix. These lines correspond to pointsin the data space which arise from overlapping modesof the mixture density.segmentation problem. We begin by giving a briefmotivation of the problem, followed by an analysis ofthe results.The detection of clouds within a satellite imageis essential for retrieving surface geophysical parametersfrom optical and thermal imagery. Operationalsurface albedo and temperature products require thecloud-detection because the retrieval methods are validfor clear skies only. Even a small percentage of cloudcover within a radiometer pixel can affect in such away that determination of surface variables, such asalbedo and temperature becomes impossible. Thus, routineprocessing of satellite data requires reliable automatedcloud detection algorithms that are applicableto a wide range of surface types. Unfortunately, clouddetection,particularly over snow- and ice-covered surfacesis a problem that has plagued working with opticaland thermal imagery since the first satellite-imagingsensor. Cloud-detection over snow and ice is difficultdue to the lack of spectral contrast between clouds andsnow. However, spectral information in the shortwaveinfrared, texture patterns, and other features may beused together to detect cloud contamination.Common approaches to detecting cloud cover arebased on spectral contrast, radiance spatial contrast,radiance temporal contrast, or a combination of thesemethods. These techniques work well over dark targets(e.g. vegetation), since clouds appear brighter (higheralbedo) in the visible range, and have lower temperaturesin the infrared compared to the cloud-free background.Threshold values are then chosen to representthe cloud-free background. Problems with this methodhowever, are that different thresholds typically need tobe selected from scene to scene. Another type of clouddetection that does not require absolute thresholds evaluatesthe spatial coherence of the observed scene. However,coherence tests suffer from the fact that false detectionis likely for clear pixels directly adjacent to cloudpixels.10 Data and Experimental ResultsWe obtained MODIS level 1B data for the Greenland icesheet from the <strong>NASA</strong> Langley DAAC and mapped thedata to a 1.25 km equal-area scalable Earth-grid (EASEgrid)using software developed by NSIDC to processMODIS level 1B data and convert the visible channeldata to top-of-the-atmosphere (TOA) reflectances.Next the TOA reflectances were normalized by the cosineof the solar zenith angle. Only the first 7 MODISchannels were used for this study. The image shown inFigure 4 was taken on day 188 of the year 2002 andis the output of Channel 6, which is tuned to detectclouds. Figure 5 shows the corresponding test image,which was taken on day 167 of the year 2002. We areunable to show the images in the other 5 bands dueto space limitations. As expected, the spectral signalsfor the 7 different MODIS channels are highly correlated,with linear correlation coefficients over 98% Weused this data as a training set for the <strong>Mixture</strong> <strong>Density</strong><strong>Mercer</strong> Kernel. We prepared the data for use in the algorithmby taking the first difference across the spectralbands thus yielding 6 differenced bands and then building5 × 5 blocks of the data. This procedure results ina 150 dimensional vector representing each pixel, where150 = 5×5×6. We have found that the differencing procedureyields improved results for the <strong>Mixture</strong> <strong>Density</strong>Kernel as well as for other detection algorithms.Figure 6 shows the result of learning a standardGaussian <strong>Mixture</strong> Model with 10 modes on the trainingdata in Figure 4, and applying that model to the testdata shown in Figure 5. The model does a good jobat segmenting the image, and reveals the large threeprongedcloud over the ice sheet. However, noticethat the cloud is characterized as a single monolithicentity with little structure depicted within it. A carefulcomparison of the same region with the test image in