Group Identity and Social Preferences
Group Identity and Social Preferences
Group Identity and Social Preferences

Create successful ePaper yourself
Turn your PDF publications into a flip-book with our unique Google optimized e-Paper software.
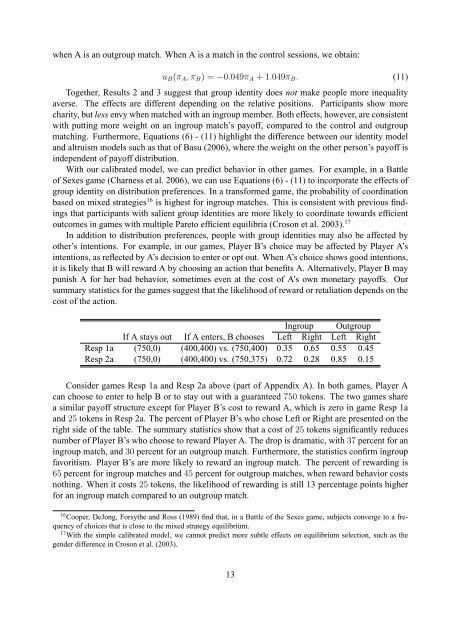
when A is an outgroup match. When A is a match in the control sessions, we obtain:u B (π A , π B ) = −0.049π A + 1.049π B . (11)Together, Results 2 <strong>and</strong> 3 suggest that group identity does not make people more inequalityaverse. The effects are different depending on the relative positions. Participants show morecharity, but less envy when matched with an ingroup member. Both effects, however, are consistentwith putting more weight on an ingroup match’s payoff, compared to the control <strong>and</strong> outgroupmatching. Furthermore, Equations (6) - (11) highlight the difference between our identity model<strong>and</strong> altruism models such as that of Basu (2006), where the weight on the other person’s payoff isindependent of payoff distribution.With our calibrated model, we can predict behavior in other games. For example, in a Battleof Sexes game (Charness et al. 2006), we can use Equations (6) - (11) to incorporate the effects ofgroup identity on distribution preferences. In a transformed game, the probability of coordinationbased on mixed strategies 16 is highest for ingroup matches. This is consistent with previous findingsthat participants with salient group identities are more likely to coordinate towards efficientoutcomes in games with multiple Pareto efficient equilibria (Croson et al. 2003). 17In addition to distribution preferences, people with group identities may also be affected byother’s intentions. For example, in our games, Player B’s choice may be affected by Player A’sintentions, as reflected by A’s decision to enter or opt out. When A’s choice shows good intentions,it is likely that B will reward A by choosing an action that benefits A. Alternatively, Player B maypunish A for her bad behavior, sometimes even at the cost of A’s own monetary payoffs. Oursummary statistics for the games suggest that the likelihood of reward or retaliation depends on thecost of the action.Ingroup OutgroupIf A stays out If A enters, B chooses Left Right Left RightResp 1a (750,0) (400,400) vs. (750,400) 0.35 0.65 0.55 0.45Resp 2a (750,0) (400,400) vs. (750,375) 0.72 0.28 0.85 0.15Consider games Resp 1a <strong>and</strong> Resp 2a above (part of Appendix A). In both games, Player Acan choose to enter to help B or to stay out with a guaranteed 750 tokens. The two games sharea similar payoff structure except for Player B’s cost to reward A, which is zero in game Resp 1a<strong>and</strong> 25 tokens in Resp 2a. The percent of Player B’s who chose Left or Right are presented on theright side of the table. The summary statistics show that a cost of 25 tokens significantly reducesnumber of Player B’s who choose to reward Player A. The drop is dramatic, with 37 percent for aningroup match, <strong>and</strong> 30 percent for an outgroup match. Furthermore, the statistics confirm ingroupfavoritism. Player B’s are more likely to reward an ingroup match. The percent of rewarding is65 percent for ingroup matches <strong>and</strong> 45 percent for outgroup matches, when reward behavior costsnothing. When it costs 25 tokens, the likelihood of rewarding is still 13 percentage points higherfor an ingroup match compared to an outgroup match.16 Cooper, DeJong, Forsythe <strong>and</strong> Ross (1989) find that, in a Battle of the Sexes game, subjects converge to a frequencyof choices that is close to the mixed strategy equilibrium.17 With the simple calibrated model, we cannot predict more subtle effects on equilibrium selection, such as thegender difference in Croson et al. (2003).13