High-Q photonic nanocavity in a two-dimensional photonic crystal
High-Q photonic nanocavity in a two-dimensional photonic crystal
High-Q photonic nanocavity in a two-dimensional photonic crystal

Create successful ePaper yourself
Turn your PDF publications into a flip-book with our unique Google optimized e-Paper software.
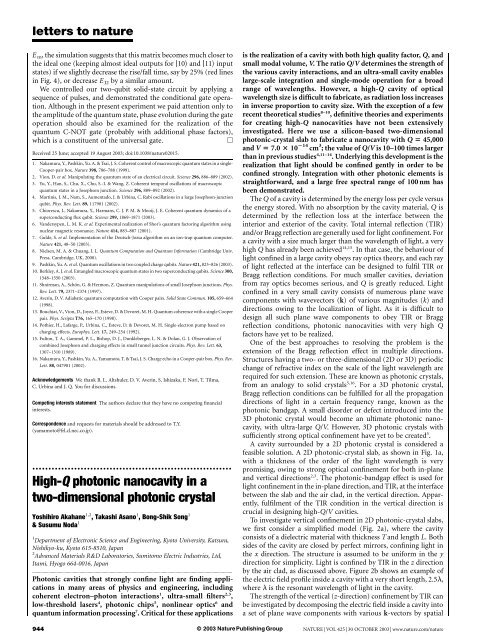
letters to natureE m , the simulation suggests that this matrix becomes much closer tothe ideal one (keep<strong>in</strong>g almost ideal outputs for j10l and j11l <strong>in</strong>putstates) if we slightly decrease the rise/fall time, say by 25% (red l<strong>in</strong>es<strong>in</strong> Fig. 4), or decrease E J2 by a similar amount.We controlled our <strong>two</strong>-qubit solid-state circuit by apply<strong>in</strong>g asequence of pulses, and demonstrated the conditional gate operation.Although <strong>in</strong> the present experiment we paid attention only tothe amplitude of the quantum state, phase evolution dur<strong>in</strong>g the gateoperation should also be exam<strong>in</strong>ed for the realization of thequantum C-NOT gate (probably with additional phase factors),which is a constituent of the universal gate.AReceived 25 June; accepted 19 August 2003; doi:10.1038/nature02015.1. Nakamura, Y., Pashk<strong>in</strong>, Yu. A. & Tsai, J. S. Coherent control of macroscopic quantum states <strong>in</strong> a s<strong>in</strong>gle-Cooper-pair box. Nature 398, 786–788 (1999).2. Vion, D. et al. Manipulat<strong>in</strong>g the quantum state of an electrical circuit. Science 296, 886–889 (2002).3. Yu, Y., Han, S., Chu, X., Chu, S.-I. & Wang, Z. Coherent temporal oscillations of macroscopicquantum states <strong>in</strong> a Josephson junction. Science 296, 889–892 (2002).4. Mart<strong>in</strong>is, J. M., Nam, S., Aumentado, J. & Urb<strong>in</strong>a, C. Rabi oscillations <strong>in</strong> a large Josephson-junctionqubit. Phys. Rev. Lett. 89, 117901 (2002).5. Chiorescu, I., Nakamura, Y., Harmans, C. J. P. M. & Mooij, J. E. Coherent quantum dynamics of asuperconduct<strong>in</strong>g flux qubit. Science 299, 1869–1871 (2003).6. Vandersypen, L. M. K. et al. Experimental realization of Shor’s quantum factor<strong>in</strong>g algorithm us<strong>in</strong>gnuclear magnetic resonance. Nature 414, 883–887 (2001).7. Gulde, S. et al. Implementation of the Deutsch-Jozsa algorithm on an ion-trap quantum computer.Nature 421, 48–50 (2003).8. Nielsen, M. A. & Chuang, I. L. Quantum Computation and Quantum Information (Cambridge Univ.Press, Cambridge, UK, 2000).9. Pashk<strong>in</strong>, Yu. A. et al. Quantum oscillations <strong>in</strong> <strong>two</strong> coupled charge qubits. Nature 421, 823–826 (2003).10. Berkley, A. J. et al. Entangled macroscopic quantum states <strong>in</strong> <strong>two</strong> superconduct<strong>in</strong>g qubits. Science 300,1548–1550 (2003).11. Shnirman, A., Schön, G. & Hermon, Z. Quantum manipulations of small Josephson junctions. Phys.Rev. Lett. 79, 2371–2374 (1997).12. Aver<strong>in</strong>, D. V. Adiabatic quantum computation with Cooper pairs. Solid State Commun. 105, 659–664(1998).13. Bouchiat, V., Vion, D., Joyez, P., Esteve, D. & Devoret, M. H. Quantum coherence with a s<strong>in</strong>gle Cooperpair. Phys. Scripta T76, 165–170 (1998).14. Pothier, H., Lafarge, P., Urb<strong>in</strong>a, C., Esteve, D. & Devoret, M. H. S<strong>in</strong>gle-electron pump based oncharg<strong>in</strong>g effects. Europhys. Lett. 17, 249–254 (1992).15. Fulton, T. A., Gammel, P. L., Bishop, D. J., Dunkleberger, L. N. & Dolan, G. J. Observation ofcomb<strong>in</strong>ed Josephson and charg<strong>in</strong>g effects <strong>in</strong> small tunnel junction circuits. Phys. Rev. Lett. 63,1307–1310 (1989).16. Nakamura, Y., Pashk<strong>in</strong>, Yu. A., Yamamoto, T. & Tsai, J. S. Charge echo <strong>in</strong> a Cooper-pair box. Phys. Rev.Lett. 88, 047901 (2002).Acknowledgements We thank B. L. Altshuler, D. V. Aver<strong>in</strong>, S. Ishizaka, F. Nori, T. Tilma,C. Urb<strong>in</strong>a and J. Q. You for discussions.Compet<strong>in</strong>g <strong>in</strong>terests statement The authors declare that they have no compet<strong>in</strong>g f<strong>in</strong>ancial<strong>in</strong>terests.Correspondence and requests for materials should be addressed to T.Y.(yamamoto@frl.cl.nec.co.jp)...............................................................<strong>High</strong>-Q <strong>photonic</strong> <strong>nanocavity</strong> <strong>in</strong> a<strong>two</strong>-<strong>dimensional</strong> <strong>photonic</strong> <strong>crystal</strong>Yoshihiro Akahane 1,2 , Takashi Asano 1 , Bong-Shik Song 1& Susumu Noda 11 Department of Electronic Science and Eng<strong>in</strong>eer<strong>in</strong>g, Kyoto University, Katsura,Nishikyo-ku, Kyoto 615-8510, Japan2 Advanced Materials R&D Laboratories, Sumitomo Electric Industries, Ltd,Itami, Hyogo 664-0016, Japan.............................................................................................................................................................................Photonic cavities that strongly conf<strong>in</strong>e light are f<strong>in</strong>d<strong>in</strong>g applications<strong>in</strong> many areas of physics and eng<strong>in</strong>eer<strong>in</strong>g, <strong>in</strong>clud<strong>in</strong>gcoherent electron–photon <strong>in</strong>teractions 1 , ultra-small filters 2,3 ,low-threshold lasers 4 , <strong>photonic</strong> chips 5 , nonl<strong>in</strong>ear optics 6 andquantum <strong>in</strong>formation process<strong>in</strong>g 7 . Critical for these applicationsis the realization of a cavity with both high quality factor, Q, andsmall modal volume, V. The ratio Q/V determ<strong>in</strong>es the strength ofthe various cavity <strong>in</strong>teractions, and an ultra-small cavity enableslarge-scale <strong>in</strong>tegration and s<strong>in</strong>gle-mode operation for a broadrange of wavelengths. However, a high-Q cavity of opticalwavelength size is difficult to fabricate, as radiation loss <strong>in</strong>creases<strong>in</strong> <strong>in</strong>verse proportion to cavity size. With the exception of a fewrecent theoretical studies 8–10 , def<strong>in</strong>itive theories and experimentsfor creat<strong>in</strong>g high-Q nanocavities have not been extensively<strong>in</strong>vestigated. Here we use a silicon-based <strong>two</strong>-<strong>dimensional</strong><strong>photonic</strong>-<strong>crystal</strong> slab to fabricate a <strong>nanocavity</strong> with Q 5 45,000and V 5 7.0 3 10 214 cm 3 ; the value of Q/V is 10–100 times largerthan <strong>in</strong> previous studies 4,11–14 . Underly<strong>in</strong>g this development is therealization that light should be conf<strong>in</strong>ed gently <strong>in</strong> order to beconf<strong>in</strong>ed strongly. Integration with other <strong>photonic</strong> elements isstraightforward, and a large free spectral range of 100 nm hasbeen demonstrated.The Q of a cavity is determ<strong>in</strong>ed by the energy loss per cycle versusthe energy stored. With no absorption by the cavity material, Q isdeterm<strong>in</strong>ed by the reflection loss at the <strong>in</strong>terface between the<strong>in</strong>terior and exterior of the cavity. Total <strong>in</strong>ternal reflection (TIR)and/or Bragg reflection are generally used for light conf<strong>in</strong>ement. Fora cavity with a size much larger than the wavelength of light, a veryhigh Q has already been achieved 14,15 . In that case, the behaviour oflight conf<strong>in</strong>ed <strong>in</strong> a large cavity obeys ray optics theory, and each rayof light reflected at the <strong>in</strong>terface can be designed to fulfil TIR orBragg reflection conditions. For much smaller cavities, deviationfrom ray optics becomes serious, and Q is greatly reduced. Lightconf<strong>in</strong>ed <strong>in</strong> a very small cavity consists of numerous plane wavecomponents with wavevectors (k) of various magnitudes (k) anddirections ow<strong>in</strong>g to the localization of light. As it is difficult todesign all such plane wave components to obey TIR or Braggreflection conditions, <strong>photonic</strong> nanocavities with very high Qfactors have yet to be realized.One of the best approaches to resolv<strong>in</strong>g the problem is theextension of the Bragg reflection effect <strong>in</strong> multiple directions.Structures hav<strong>in</strong>g a <strong>two</strong>- or three-<strong>dimensional</strong> (2D or 3D) periodicchange of refractive <strong>in</strong>dex on the scale of the light wavelength arerequired for such extension. These are known as <strong>photonic</strong> <strong>crystal</strong>s,from an analogy to solid <strong>crystal</strong>s 5,16 . For a 3D <strong>photonic</strong> <strong>crystal</strong>,Bragg reflection conditions can be fulfilled for all the propagationdirections of light <strong>in</strong> a certa<strong>in</strong> frequency range, known as the<strong>photonic</strong> bandgap. A small disorder or defect <strong>in</strong>troduced <strong>in</strong>to the3D <strong>photonic</strong> <strong>crystal</strong> would become an ultimate <strong>photonic</strong> <strong>nanocavity</strong>,with ultra-large Q/V. However, 3D <strong>photonic</strong> <strong>crystal</strong>s withsufficiently strong optical conf<strong>in</strong>ement have yet to be created 5 .A cavity surrounded by a 2D <strong>photonic</strong> <strong>crystal</strong> is considered afeasible solution. A 2D <strong>photonic</strong>-<strong>crystal</strong> slab, as shown <strong>in</strong> Fig. 1a,with a thickness of the order of the light wavelength is verypromis<strong>in</strong>g, ow<strong>in</strong>g to strong optical conf<strong>in</strong>ement for both <strong>in</strong>-planeand vertical directions 2,3 . The <strong>photonic</strong>-bandgap effect is used forlight conf<strong>in</strong>ement <strong>in</strong> the <strong>in</strong>-plane direction, and TIR, at the <strong>in</strong>terfacebetween the slab and the air clad, <strong>in</strong> the vertical direction. Apparently,fulfilment of the TIR condition <strong>in</strong> the vertical direction iscrucial <strong>in</strong> design<strong>in</strong>g high-Q/V cavities.To <strong>in</strong>vestigate vertical conf<strong>in</strong>ement <strong>in</strong> 2D <strong>photonic</strong>-<strong>crystal</strong> slabs,we first consider a simplified model (Fig. 2a), where the cavityconsists of a dielectric material with thickness T and length L. Bothsides of the cavity are closed by perfect mirrors, conf<strong>in</strong><strong>in</strong>g light <strong>in</strong>the x direction. The structure is assumed to be uniform <strong>in</strong> the ydirection for simplicity. Light is conf<strong>in</strong>ed by TIR <strong>in</strong> the z directionby the air clad, as discussed above. Figure 2b shows an example ofthe electric field profile <strong>in</strong>side a cavity with a very short length, 2.5l,where l is the resonant wavelength of light <strong>in</strong> the cavity.The strength of the vertical (z-direction) conf<strong>in</strong>ement by TIR canbe <strong>in</strong>vestigated by decompos<strong>in</strong>g the electric field <strong>in</strong>side a cavity <strong>in</strong>toa set of plane wave components with various k-vectors by spatial944 © 2003 Nature Publish<strong>in</strong>g GroupNATURE | VOL 425 | 30 OCTOBER 2003 | www.nature.com/nature
letters to natureFourier transformation (FT), which is a similar approach to thatreported <strong>in</strong> ref. 10. When the tangential component of the k-vector(jk k j or jk x j) of each plane wave lies with<strong>in</strong> the range 0 to 2p/l 0(where l 0 is the wavelength of light <strong>in</strong> air), the wave can escape fromthe cavity to the air clad, because the conservation law for jk k j (orSnell’s law <strong>in</strong> the broad sense) is satisfied at the <strong>in</strong>terface between thecavity and air clad, which leads to weak vertical conf<strong>in</strong>ement. Notethat jk k j <strong>in</strong> the air clad can take a value from 0 to 2p/l 0 depend<strong>in</strong>gon the propagation direction <strong>in</strong> the x–z plane, while jk k j <strong>in</strong> thecavity takes a variety of values ow<strong>in</strong>g to the localization of light, asexpla<strong>in</strong>ed before. When jk k j <strong>in</strong> the cavity is larger than 2p/l 0 ,the jk k j conservation law does not hold at the <strong>in</strong>terface, andlight becomes strongly conf<strong>in</strong>ed <strong>in</strong>side the cavity, which leads tostrong vertical conf<strong>in</strong>ement. Figure 2c shows the spatial FT spectraof the electric field of Fig. 2b, where the leaky region (jk k j issmaller than 2p/l 0 ) is <strong>in</strong>dicated. Large components exist <strong>in</strong>sidethe leaky region, which <strong>in</strong>dicates that large radiation loss occurs <strong>in</strong>the cavity.We now consider the loss mechanism <strong>in</strong> more detail. The electricfield profile <strong>in</strong>side the cavity can be expressed as a product of afundamental s<strong>in</strong>usoidal wave with wavelength l, and an envelopefunction F(x) that is determ<strong>in</strong>ed by the cavity structure. Thefundamental wave gives a delta functional FT spectrum with peaksat k ¼ ^2p/l, while the envelope function modifies the spectrum.In the case of Fig. 2b, the envelope function is F(x) ¼ 1 (for x ¼ 2L=2to L/2) and F(x) ¼ 0 (for all other x), and the correspond<strong>in</strong>g FTspectrum is a s<strong>in</strong>c function with a width of about 2p/L (Fig. 2c).Although the peak of the spectrum orig<strong>in</strong>at<strong>in</strong>g from the fundamentalwave is outside the leaky region, an abrupt change <strong>in</strong> theenvelope function at the edges (x ¼ 2L/2, L/2) generates largecomponents <strong>in</strong>side the leaky region, lead<strong>in</strong>g to large radiation loss.The smaller the cavity, the more serious the edge effect, drasticallydecreas<strong>in</strong>g the Q factor.This gives an important h<strong>in</strong>t for suppress<strong>in</strong>g radiation loss: thespatial variation of the envelope function at the cavity edges shouldnot be abrupt but gentle, so that the FT spectrum does not havecomponents <strong>in</strong>side the leaky region. On the basis of this idea, wehave used a gaussian function for F(x), as shown schematically <strong>in</strong>Fig. 2d; the calculated FTspectrum is shown <strong>in</strong> Fig. 2e. The situationhas drastically changed: there are very small components <strong>in</strong>side theleaky region, when compared with Fig. 2c. This suggests that the Qfactor can be <strong>in</strong>creased significantly by tailor<strong>in</strong>g the envelopefunction while keep<strong>in</strong>g the mode volume small.A physical design of a high-Q <strong>photonic</strong> <strong>nanocavity</strong> has thus beencarried out us<strong>in</strong>g a 2D <strong>photonic</strong>-<strong>crystal</strong> slab (Fig. 1b and c). Thebase structure is composed of Si with a triangular lattice of air ‘rods’with lattice constant a ( ¼ 0.42 mm). The thickness of the slab andthe radii of the air rods are 0.6a (0.25 mm) and 0.29a (0.12 mm),respectively. We made the <strong>in</strong>itial structure of the cavity with threemiss<strong>in</strong>g air rods <strong>in</strong> a l<strong>in</strong>e 17 (Fig. 1b). With this structure, light can beconf<strong>in</strong>ed by Bragg reflection for the <strong>in</strong>-plane directions. For the zdirection, light is conf<strong>in</strong>ed by the air clad.The electric field profile (E y ) of the fundamental mode of thecavity at the centre plane of the slab is shown <strong>in</strong> Fig. 3a. We used 3Df<strong>in</strong>ite-difference time-doma<strong>in</strong> methods for the calculation. Unlikethe model discussed <strong>in</strong> Fig. 2, x- and y-directional (2D) FT spectraare necessary for the <strong>in</strong>vestigation of the vertical conf<strong>in</strong>ement, aslight is conf<strong>in</strong>ed <strong>two</strong>-<strong>dimensional</strong>ly <strong>in</strong> the cavity. For the samereason, the TIR condition (or k k conservation law) should beexpanded <strong>two</strong>-<strong>dimensional</strong>ly. Consider<strong>in</strong>g <strong>in</strong>-plane 2D propagation,the TIR condition is broken for plane waves hav<strong>in</strong>g k k<strong>in</strong>side a circle of diameter 2p /l 0 .Figure 3b shows the FT spectra correspond<strong>in</strong>g to Fig. 3a, wherethe leaky region is <strong>in</strong>side the grey circle. The FT spectrum conta<strong>in</strong>slarge components <strong>in</strong>side the leaky region. As discussed, we considerFigure 1 Photonic nanocavities us<strong>in</strong>g a 2D <strong>photonic</strong>-<strong>crystal</strong> slab. a, Schematic of thebase cavity structure hav<strong>in</strong>g a triangular lattice of air rods with lattice constant a( ¼ 0.42 mm). The thickness T of the slab and the radius R of the air rods are 0.6a(0.25 mm) and 0.29a (0.12 mm), respectively. b, Start<strong>in</strong>g cavity structure with threemiss<strong>in</strong>g air rods <strong>in</strong> a l<strong>in</strong>e. c, Designed cavity structure created by displac<strong>in</strong>g the air rods atboth edges to obta<strong>in</strong> an ultrahigh Q/V value.Figure 2 Analysis and reduction of cavity loss. a, Simplified model of a cavityconsist<strong>in</strong>g of a dielectric material with thickness T and length L. For conf<strong>in</strong>ement of light,both sides of the cavity are closed by perfect mirrors for the x direction, and by the airclad based on TIR for the z direction. b, c, The electric field profile <strong>in</strong>side a cavity with avery short (2.5l) length, and the spatial FT spectra. The leaky region is <strong>in</strong>dicated as ablue area. d, e, The electric field profile with a gentle envelope function (gaussian curve)and its spatial FT spectrum. a.u., arbitrary units.NATURE | VOL 425 | 30 OCTOBER 2003 | www.nature.com/nature © 2003 Nature Publish<strong>in</strong>g Group945
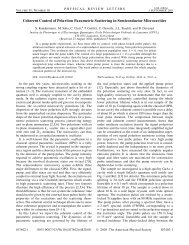
letters to naturethat this is due to the abrupt change at the cavity edges. Here wetry to make conf<strong>in</strong>ement gentler. The strategy to obta<strong>in</strong> gentlerconf<strong>in</strong>ement is to change the condition for Bragg reflection at thecavity edge. Such reflection is determ<strong>in</strong>ed by a summation of partialreflections at a series of rods near the cavity edge. When we moveseveral rods near the cavity edge, the Bragg reflection conditionshould be modified. Because the phases of partial reflections at themoved rods are changed, the resultant phase-mismatch weakens themagnitude of Bragg reflection. To compensate for the reduction ofthe reflection, light is considered to penetrate more <strong>in</strong>side themirror and be reflected perfectly. It means that the electric fieldprofile at the cavity edge becomes gentler. With the appropriatemovement of rods, the profile is considered to be close to the idealconf<strong>in</strong>ement expressed by the gaussian function as discussed above.Us<strong>in</strong>g this strategy, the air rods at both edges of the cavity are shifted(Fig. 1c). Figure 3c and d show the electric field profile and 2D FTspectrum, respectively, where the shift of the air rods is 0.15a fromtheir orig<strong>in</strong>al position. As <strong>in</strong> Fig. 3d, the FTspectrum conta<strong>in</strong>s muchsmaller components <strong>in</strong>side the leaky region compared with Fig. 3b.The mode volume itself is confirmed as almost unchanged. Therefore,a significant <strong>in</strong>crease of Q/V is expected to be achieved by thismethod.Encouraged by the above analysis, we fabricated samples withvarious displacements. The resonant spectra were measured us<strong>in</strong>g atunable c.w. laser as a light source. The cavities were excited througha l<strong>in</strong>e defect waveguide constructed by fill<strong>in</strong>g a row of air holes nearthe cavity (Fig. 4b), and the <strong>in</strong>tensity of the light emitted from thecavities to free space was observed. Details of construction andexperimental methods are given elsewhere 17 . The <strong>in</strong>tr<strong>in</strong>sic Q factorof the cavity was determ<strong>in</strong>ed from its radiation spectra by remov<strong>in</strong>gthe effect of coupl<strong>in</strong>g between the cavity and the waveguide. Theeffective modal volume was calculated from the electric field profileof the cavity 4 ; from this it was found that V is small and constant at(6–7) £ 10 214 cm 3 .Figures 4a and b show resonant spectra of cavities with variousair-rod shifts and the correspond<strong>in</strong>g scann<strong>in</strong>g electron microscope(SEM) pictures, respectively. The width of the resonant peakchanges drastically with shift of air rods. The spectral widthbecomes a m<strong>in</strong>imum (0.045 nm) for the sample with shift,0.15a, from which a Q factor of 45,000 is derived consider<strong>in</strong>gthe coupl<strong>in</strong>g effect with the waveguide. In Fig. 4c, the Q/V values areplotted as a function of shift of air rods. Q/V <strong>in</strong>creases by a factor of10 upon <strong>in</strong>creas<strong>in</strong>g the air-rod shift up to ,0.15a.AQ/V as large as6.4 £ 10 17 cm 23 or 120,000/l 3 has thus been obta<strong>in</strong>ed. This is oneto <strong>two</strong> orders of magnitude higher than values for previouslyreported cavities such as toroid microcavities, microdisks and<strong>photonic</strong>-<strong>crystal</strong> cavities 4,11–14 . Further <strong>in</strong>creases of Q/V should bepossible by f<strong>in</strong>e-tun<strong>in</strong>g the arrangement of air rods at the cavityedges to obta<strong>in</strong> the perfect gaussian curve for light conf<strong>in</strong>ement.The <strong>in</strong>set of Fig. 4a shows the spectrum measured for a widewavelength range, <strong>in</strong>dicat<strong>in</strong>g that no other resonant peak exists <strong>in</strong>the range 1,500 to 1,600 nm. The result shows that s<strong>in</strong>gle-modeoperation is possible for a broad range of wavelengths, which is veryuseful for various applications.We have described the important design rule that light should beconf<strong>in</strong>ed gently to obta<strong>in</strong> high Q factors while ma<strong>in</strong>ta<strong>in</strong><strong>in</strong>g a verysmall modal volume V. An extremely large Q/V value has beenachieved by <strong>in</strong>troduc<strong>in</strong>g displacement of air rods at both edges of acavity <strong>in</strong> a 2D <strong>photonic</strong>-<strong>crystal</strong> slab. We believe that this conceptcould be applied to the design of various types of <strong>photonic</strong><strong>nanocavity</strong>; such high-Q nanocavities could be applied acrossvarious fields of science and eng<strong>in</strong>eer<strong>in</strong>g, <strong>in</strong>clud<strong>in</strong>g nano-lasers,nonl<strong>in</strong>ear optics, nano-biomaterials, atom physics, and quantumcomput<strong>in</strong>g. The present result is also important for the field ofFigure 3 Physical design of high-Q/V cavity. a, The electric field profile (E y ) of thefundamental mode of the cavity shown <strong>in</strong> Fig. 1b as the start<strong>in</strong>g structure. b, The FTspectra of a. The region <strong>in</strong>side the grey circle corresponds to the leaky region. c, d, Theelectric field profile and 2D FT spectrum, respectively, for the designed cavity shown <strong>in</strong>Fig. 1c. The displacement of the air rods at the edges is set at 0.15a from the start<strong>in</strong>gstructure shown <strong>in</strong> Fig. 1b.Figure 4 Experimental results. a, b, Resonant spectra of cavities with various shifts of airrods and their SEM pictures, respectively. PC, <strong>photonic</strong> <strong>crystal</strong>. The <strong>in</strong>set <strong>in</strong> a shows theresonant spectrum of the cavity (with 0.15a displacement) measured over a widewavelength range. c, The estimated Q/V values as a function of shift of air rods. Amaximum value of Q/V ¼ 6.4 £ 10 17 cm 23 , or 120,000/l 3 , has been realized.946 © 2003 Nature Publish<strong>in</strong>g GroupNATURE | VOL 425 | 30 OCTOBER 2003 | www.nature.com/nature
letters to nature<strong>photonic</strong>-<strong>crystal</strong>-based <strong>in</strong>tegrated circuits, as strong 3D conf<strong>in</strong>ementof photons <strong>in</strong> an ultra-small cavity has been realized, andleakage <strong>in</strong> the vertical direction sufficiently suppressed. AReceived 24 July; accepted 12 September 2003; doi:10.1038/nature02063.1. Khitrova, G., Gibbs, H. M., Jahnke, F., Kira, M. & Koch, S. W. Nonl<strong>in</strong>ear optics of normal-modecoupl<strong>in</strong>gsemiconductor microcavities. Rev. Mod. Phys. 71, 1591–1639 (1999).2. Noda, S., Chut<strong>in</strong>an, A. & Imada, M. Trapp<strong>in</strong>g and emission of photons by a s<strong>in</strong>gle defect <strong>in</strong> a <strong>photonic</strong>bandgap structure. Nature 407, 608–610 (2000).3. Song, B. S., Noda, S. & Asano, T. Photonic devices based on <strong>in</strong>-plane hetero <strong>photonic</strong> <strong>crystal</strong>s. Science300, 1537 (2003).4. Pa<strong>in</strong>ter, O. et al. Two-<strong>dimensional</strong> <strong>photonic</strong> band-gap defect mode laser. Science 284, 1819–1821(1999).5. Noda, S., Tomoda, K., Yamamoto, N. & Chut<strong>in</strong>an, A. Full three-<strong>dimensional</strong> <strong>photonic</strong> bandgap<strong>crystal</strong>s at near-<strong>in</strong>frared wavelengths. Science 289, 604–606 (2000).6. Spillane, S. M., Kippenberg, T. J. & Vahala, K. J. Ultralow-threshold Raman laser us<strong>in</strong>g a sphericaldielectric microcavity. Nature 415, 621–623 (2002).7. Michler, P. et al. A quantum dot s<strong>in</strong>gle-photon turnstile device. Science 290, 2282–2285 (2000).8. Johnson, S. G., Fan, S., Mekis, A. & Joannopoulos, J. D. Multipole-cancellation mechanism for high-Qcavities <strong>in</strong> the absence of a complete <strong>photonic</strong> band gap. Appl. Phys. Lett. 78, 3388–3390 (2001).9. Vučković, J., Lončar, M., Mabuchi, H. & Scherer, A. Design of <strong>photonic</strong> <strong>crystal</strong> microcavities for cavityQED. Phys. Rev. E 65, 016608 (2001).10. Sr<strong>in</strong>ivasan, K. & Pa<strong>in</strong>ter, O. Momentum space design of high-Q <strong>photonic</strong> <strong>crystal</strong> optical cavities. Opt.Express 10, 670–684 (2002).11. Gayral, B. et al. <strong>High</strong>-Q wet-etched GaAs microdisks conta<strong>in</strong><strong>in</strong>g InAs quantum boxes. Appl. Phys. Lett.75, 1908–1910 (1999).12. Yoshie, T., Vučković, J., Scherer, A., Chen, H. & Deppe, D. <strong>High</strong> quality <strong>two</strong>-<strong>dimensional</strong> <strong>photonic</strong><strong>crystal</strong> slab cavities. Appl. Phys. Lett. 79, 4289–4291 (2001).13. Ryu, H. Y. et al. Square-lattice <strong>photonic</strong> band-gap s<strong>in</strong>gle-cell laser operat<strong>in</strong>g <strong>in</strong> the lower-orderwhisper<strong>in</strong>g gallery mode. Appl. Phys. Lett. 80, 3883–3885 (2002).14. Armani, D. K., Kippenberg, T. J., Spillane, S. M. & Vahala, K. J. Ultra-high-Q toroid microcavity on achip. Nature 421, 925–928 (2003).15. Vernooy, D. W., Ilchenko, V. S., Mabuchi, H., Streed, E. W. & Kimble, H. J. <strong>High</strong>-Q measurements offused-silica microspheres <strong>in</strong> the near <strong>in</strong>frared. Opt. Lett. 23, 247–249 (1998).16. Yablonovitch, E. Inhibited spontaneous emission <strong>in</strong> solid-state physics and electronics. Phys. Rev. Lett.58, 2059–2062 (1987).17. Akahane, Y., Asano, T., Song, B. S. & Noda, S. Investigation of high-Q channel drop filters us<strong>in</strong>gdonor-type defects <strong>in</strong> <strong>two</strong>-<strong>dimensional</strong> <strong>photonic</strong> <strong>crystal</strong> slabs. Appl. Phys. Lett. 83, 1512–1514(2003).Acknowledgements This work was supported partly by Grant-<strong>in</strong>-Aid from the M<strong>in</strong>istry ofEducation, Culture, Sports, Science and Technology of Japan, and also by CREST, Japan Scienceand Technology Corporation.Compet<strong>in</strong>g <strong>in</strong>terests statement The authors declare that they have no compet<strong>in</strong>g f<strong>in</strong>ancial<strong>in</strong>terests.Correspondence and requests for materials should be addressed to S.N.(snoda@kuee.kyoto-u.ac.jp)...............................................................<strong>High</strong> <strong>in</strong>terannual variability of seaice thickness <strong>in</strong> the Arctic regionSeymour Laxon 1 , Neil Peacock 1 & Doug Smith 21 Centre for Polar Observation and Modell<strong>in</strong>g, University College London,Gower Street, London WC1E 6BT, UK2 Met Office Hadley Centre for Climate Prediction and Research, FitzRoy Road,Exeter, Devon EX1 3PB, UK.............................................................................................................................................................................Possible future changes <strong>in</strong> Arctic sea ice cover and thickness, andconsequent changes <strong>in</strong> the ice-albedo feedback, represent one ofthe largest uncerta<strong>in</strong>ties <strong>in</strong> the prediction of future temperaturerise 1,2 . Knowledge of the natural variability of sea ice thicknessis therefore critical for its representation <strong>in</strong> global climatemodels 3,4 . Numerical simulations suggest that Arctic ice thicknessvaries primarily on decadal timescales 3,5,6 ow<strong>in</strong>g to changes<strong>in</strong> w<strong>in</strong>d and ocean stresses on the ice 7–10 , but observations havebeen unable to provide a synoptic view of sea ice thickness, whichis required to validate the model results 3,6,9 . Here we use an eightyeartime-series of Arctic ice thickness, derived from satellitealtimeter measurements of ice freeboard, to determ<strong>in</strong>e the meanthickness field and its variability from 658 N to 81.58 N. Our datareveal a high-frequency <strong>in</strong>terannual variability <strong>in</strong> mean Arctic icethickness that is dom<strong>in</strong>ated by changes <strong>in</strong> the amount of summermelt 11 , rather than by changes <strong>in</strong> circulation. Our results suggestthat a cont<strong>in</strong>ued <strong>in</strong>crease <strong>in</strong> melt season length would lead tofurther th<strong>in</strong>n<strong>in</strong>g of Arctic sea ice.The prediction of future changes <strong>in</strong> Arctic sea ice, and consequenteffects on the ocean 12 and atmosphere 2 , relies on global climatemodels properly reproduc<strong>in</strong>g changes <strong>in</strong> ice thickness 3,4,13 . Knowledgeof ice thickness variability is also critical <strong>in</strong> determ<strong>in</strong><strong>in</strong>gwhether observed changes 14 are natural, or anthropogenic, <strong>in</strong>orig<strong>in</strong> 4 . The sparseness of sea ice thickness observations meansthat current understand<strong>in</strong>g of the regional, and <strong>in</strong>terannual, variabilityof sea ice thickness is entirely based on numerical models ofthe Arctic 6,9 . However, it is unclear from model results whether icethickness is controlled ma<strong>in</strong>ly by changes <strong>in</strong> thermodynamic(radiative or thermal) forc<strong>in</strong>g 5 , or by dynamic (ocean and w<strong>in</strong>dstress) forc<strong>in</strong>g 7 . The majority of Arctic Ocean models suggest thatvariability <strong>in</strong> Arctic ice thickness occurs on decadal timescales 5,6,9 ,and is caused ma<strong>in</strong>ly by dynamic forc<strong>in</strong>g 6–8 . Simulations of Arcticice cover cover<strong>in</strong>g the past four decades have been used to argue thatobserved th<strong>in</strong> ice 14–17 dur<strong>in</strong>g the 1990s was a result of changes <strong>in</strong>atmospheric 6,7,10,17 or oceanic 8,18 circulation. However, numericalsimulations of ice thickness are underm<strong>in</strong>ed by uncerta<strong>in</strong>ties <strong>in</strong> therepresentation of physical processes 9 , and by differences <strong>in</strong> methodsused to couple the ice, ocean and atmosphere 12 , result<strong>in</strong>g <strong>in</strong>significant discrepancies between model simulations of ice thicknessevolution 14 . The lack of cont<strong>in</strong>uous large-scale thickness measurementsmeans that conclusions drawn from numerical simulationsregard<strong>in</strong>g the variability of Arctic sea ice thickness, and the processesthat control it, rema<strong>in</strong> untested 3,12 .We use newly developed techniques to obta<strong>in</strong> ice thickness fromsatellite estimates of ice freeboard over the 8-yr period 1993–2001(Fig. 1). The region of coverage (ROC) extends to 81.58 N, cover<strong>in</strong>gan average area of 3.08 £ 10 6 km 2 , or more than half of thepermanent sea ice cover. The data cover the entire circumferenceof the Arctic Ocean, <strong>in</strong>clud<strong>in</strong>g the Beaufort, Chukchi, East Siberian,Kara, Laptev, Barents and Greenland seas. We use measurementsfrom the 13.8-GHz radar altimeters carried on the ERS-1 and ERS-2satellites. By analys<strong>in</strong>g <strong>in</strong>dividual echoes, we dist<strong>in</strong>guish thoseorig<strong>in</strong>at<strong>in</strong>g from consolidated first and multi-year ice floes fromthose due to leads, open water and new ice. Corrections for orbits,tides, and atmospheric delay are applied to the radar data to obta<strong>in</strong>the elevation of ice floes and open water or new ice 19 . The elevationof the ice above the water surface is then obta<strong>in</strong>ed by subtract<strong>in</strong>g thesea surface elevation, determ<strong>in</strong>ed from open water measurements.To deduce the ice thickness from ice elevation, the source of theechoes scattered from snow-covered sea ice must be determ<strong>in</strong>ed.Laboratory experiments show that, under dry cold snow conditions,a normal-<strong>in</strong>cidence 13.4-GHz radar reflection from snow-coveredsea ice orig<strong>in</strong>ates at the snow–ice <strong>in</strong>terface 20 . The ERS radaraltimeter measurements of ice elevation therefore provide thelevel of the snow–ice <strong>in</strong>terface above the water level—that is, theice freeboard. We convert the ice freeboard measurements to icethickness by assum<strong>in</strong>g hydrostatic equilibrium, and then us<strong>in</strong>g fixeddensities of ice (915.1 kg m 23 ) and sea water (1,023.9 kg m 23 ) 21 anda monthly climatology of snow depth and density 22 . The estimateduncerta<strong>in</strong>ty <strong>in</strong> ice and water density, of ^5kgm 23 and ^0.5 kg m 23respectively 21 , results <strong>in</strong> an uncerta<strong>in</strong>ty of ^11 cm for our meanthickness. Interannual variability <strong>in</strong> snow load<strong>in</strong>g, estimated 23 to bebetween 2 and 3 cm, results <strong>in</strong> a further uncerta<strong>in</strong>ty of 6 to 9 cm<strong>in</strong> our ice thickness estimates. Figure 2 compares ERS thicknessestimates with those derived from near-co<strong>in</strong>cident submar<strong>in</strong>edraught measurements 15 . A l<strong>in</strong>ear least-squares fit, weighted bythe estimated measurement, snow load<strong>in</strong>g and ice/water densityuncerta<strong>in</strong>ties, shows that the correlation between the altimeter andNATURE | VOL 425 | 30 OCTOBER 2003 | www.nature.com/nature © 2003 Nature Publish<strong>in</strong>g Group947