Gabor-Type Filtering in Space and Time - Department of Electronic ...
Gabor-Type Filtering in Space and Time - Department of Electronic ...
Gabor-Type Filtering in Space and Time - Department of Electronic ...

Create successful ePaper yourself
Turn your PDF publications into a flip-book with our unique Google optimized e-Paper software.
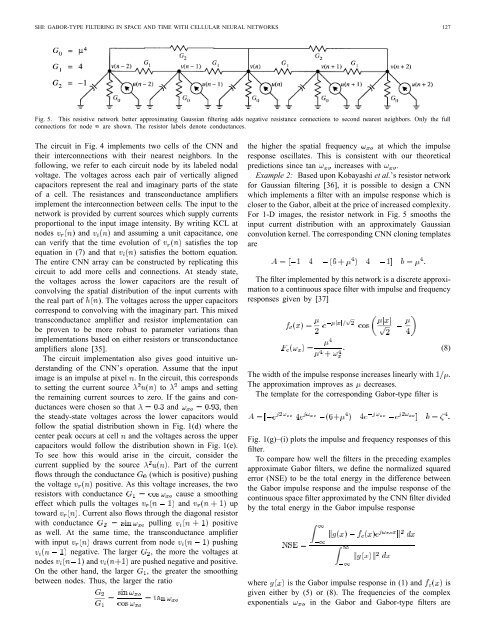
SHI: GABOR-TYPE FILTERING IN SPACE AND TIME WITH CELLULAR NEURAL NETWORKS 127Fig. 5. This resistive network better approximat<strong>in</strong>g Gaussian filter<strong>in</strong>g adds negative resistance connections to second nearest neighbors. Only the fullconnections for node n are shown. The resistor labels denote conductances.The circuit <strong>in</strong> Fig. 4 implements two cells <strong>of</strong> the CNN <strong>and</strong>their <strong>in</strong>terconnections with their nearest neighbors. In thefollow<strong>in</strong>g, we refer to each circuit node by its labeled nodalvoltage. The voltages across each pair <strong>of</strong> vertically alignedcapacitors represent the real <strong>and</strong> imag<strong>in</strong>ary parts <strong>of</strong> the state<strong>of</strong> a cell. The resistances <strong>and</strong> transconductance amplifiersimplement the <strong>in</strong>terconnection between cells. The <strong>in</strong>put to thenetwork is provided by current sources which supply currentsproportional to the <strong>in</strong>put image <strong>in</strong>tensity. By writ<strong>in</strong>g KCL atnodes <strong>and</strong> <strong>and</strong> assum<strong>in</strong>g a unit capacitance, onecan verify that the time evolution <strong>of</strong> satisfies the topequation <strong>in</strong> (7) <strong>and</strong> that satisfies the bottom equation.The entire CNN array can be constructed by replicat<strong>in</strong>g thiscircuit to add more cells <strong>and</strong> connections. At steady state,the voltages across the lower capacitors are the result <strong>of</strong>convolv<strong>in</strong>g the spatial distribution <strong>of</strong> the <strong>in</strong>put currents withthe real part <strong>of</strong> . The voltages across the upper capacitorscorrespond to convolv<strong>in</strong>g with the imag<strong>in</strong>ary part. This mixedtransconductance amplifier <strong>and</strong> resistor implementation canbe proven to be more robust to parameter variations thanimplementations based on either resistors or transconductanceamplifiers alone [35].The circuit implementation also gives good <strong>in</strong>tuitive underst<strong>and</strong><strong>in</strong>g<strong>of</strong> the CNN’s operation. Assume that the <strong>in</strong>putimage is an impulse at pixel . In the circuit, this correspondsto sett<strong>in</strong>g the current source to amps <strong>and</strong> sett<strong>in</strong>gthe rema<strong>in</strong><strong>in</strong>g current sources to zero. If the ga<strong>in</strong>s <strong>and</strong> conductanceswere chosen so that <strong>and</strong> , thenthe steady-state voltages across the lower capacitors wouldfollow the spatial distribution shown <strong>in</strong> Fig. 1(d) where thecenter peak occurs at cell <strong>and</strong> the voltages across the uppercapacitors would follow the distribution shown <strong>in</strong> Fig. 1(e).To see how this would arise <strong>in</strong> the circuit, consider thecurrent supplied by the source . Part <strong>of</strong> the currentflows through the conductance (which is positive) push<strong>in</strong>gthe voltage positive. As this voltage <strong>in</strong>creases, the tworesistors with conductancecause a smooth<strong>in</strong>geffect which pulls the voltages <strong>and</strong> uptoward . Current also flows through the diagonal resistorwith conductance pull<strong>in</strong>g positiveas well. At the same time, the transconductance amplifierwith <strong>in</strong>put draws current from node push<strong>in</strong>gnegative. The larger , the more the voltages atnodes <strong>and</strong> are pushed negative <strong>and</strong> positive.On the other h<strong>and</strong>, the larger , the greater the smooth<strong>in</strong>gbetween nodes. Thus, the larger the ratiothe higher the spatial frequency at which the impulseresponse oscillates. This is consistent with our theoreticalpredictions s<strong>in</strong>ce tan <strong>in</strong>creases with .Example 2: Based upon Kobayashi et al.’s resistor networkfor Gaussian filter<strong>in</strong>g [36], it is possible to design a CNNwhich implements a filter with an impulse response which iscloser to the <strong>Gabor</strong>, albeit at the price <strong>of</strong> <strong>in</strong>creased complexity.For 1-D images, the resistor network <strong>in</strong> Fig. 5 smooths the<strong>in</strong>put current distribution with an approximately Gaussianconvolution kernel. The correspond<strong>in</strong>g CNN clon<strong>in</strong>g templatesareThe filter implemented by this network is a discrete approximationto a cont<strong>in</strong>uous space filter with impulse <strong>and</strong> frequencyresponses given by [37]The width <strong>of</strong> the impulse response <strong>in</strong>creases l<strong>in</strong>early with .The approximation improves as decreases.The template for the correspond<strong>in</strong>g <strong>Gabor</strong>-type filter isFig. 1(g)–(i) plots the impulse <strong>and</strong> frequency responses <strong>of</strong> thisfilter.To compare how well the filters <strong>in</strong> the preced<strong>in</strong>g examplesapproximate <strong>Gabor</strong> filters, we def<strong>in</strong>e the normalized squarederror (NSE) to be the total energy <strong>in</strong> the difference betweenthe <strong>Gabor</strong> impulse response <strong>and</strong> the impulse response <strong>of</strong> thecont<strong>in</strong>uous space filter approximated by the CNN filter dividedby the total energy <strong>in</strong> the <strong>Gabor</strong> impulse responsewhere is the <strong>Gabor</strong> impulse response <strong>in</strong> (1) <strong>and</strong> isgiven either by (5) or (8). The frequencies <strong>of</strong> the complexexponentials <strong>in</strong> the <strong>Gabor</strong> <strong>and</strong> <strong>Gabor</strong>-type filters are(8)