128 IEEE TRANSACTIONS ON CIRCUITS AND SYSTEMS—I: FUNDAMENTAL THEORY AND APPLICATIONS, VOL. 45, NO. 2, FEBRUARY 1998chosen to be identical. The results <strong>of</strong> analyz<strong>in</strong>g the discretespacefilters will be more complex, but very similar to theresults here, especially as <strong>and</strong> approach zero.Us<strong>in</strong>g the fact that, it can be shown thatthe error is <strong>in</strong>dependent <strong>of</strong> <strong>and</strong> depends only upon thedifference between the Gaussian envelope <strong>of</strong> the <strong>Gabor</strong> filter<strong>and</strong> the low-pass envelope <strong>of</strong> the <strong>Gabor</strong>-type filter. Forthe filter <strong>in</strong> Example 1, the m<strong>in</strong>imum error <strong>of</strong> 15 dB isachieved forTABLE ICOMPARISON OF PHASE MEASUREMENT PROPERTIESOF GABOR AND GABOR-TYPE FILTERSFor the filter <strong>in</strong> Example 2, the m<strong>in</strong>imum error <strong>of</strong>achieved for21 dB isThe values <strong>of</strong> <strong>and</strong> have been estimated numerically.Simulation results <strong>in</strong> Fig. 1 where the parameters chosenm<strong>in</strong>imize the NSE provide visual confirmation that the impulse<strong>and</strong> frequency responses <strong>of</strong> the filter <strong>in</strong> Example 2 are closerto the <strong>Gabor</strong> filter’s than are those <strong>of</strong> the filter <strong>in</strong> Example 1.To compare the three filters with respect to the desirableproperties for comput<strong>in</strong>g phase discussed <strong>in</strong> Section I-B, wedef<strong>in</strong>e the follow<strong>in</strong>g criteria. The criteria are based upon theassumption that the <strong>in</strong>put image is white.Negative Frequency Rejection (NFR): This is the ratio betweenthe energy <strong>in</strong> the output due to positive frequencies <strong>in</strong>the <strong>in</strong>put <strong>and</strong> the energy due to negative frequencies. Ifis the frequency response <strong>of</strong> the filter, thenDC Rejection (DCR): This is a measure <strong>of</strong> the extent towhich the dc component is suppressed compared with the peakresponse. If is the frequency response <strong>of</strong> the filterPhase Wraparound Rejection (PWR): The output at a givenpixel can be considered as the sum <strong>of</strong> two components: thefirst (desired) component due to convolv<strong>in</strong>g the image with thepart <strong>of</strong> the impulse response where the phase varies fromto <strong>and</strong> the second (undesired) component due to convolv<strong>in</strong>gthe <strong>in</strong>put image with the part <strong>of</strong> the impulse response wherethe phase has wrapped around. S<strong>in</strong>ce we assume the image<strong>in</strong>put is white, these two components are uncorrelated. Wedef<strong>in</strong>e the PWR to be the ratio <strong>of</strong> their energies. If is theimpulse response <strong>of</strong> the filter, thenwell as whether or not the phase <strong>of</strong> the impulse responseis monotonous. The results were estimated numerically us<strong>in</strong>gthe same filter parameters used to generate the plots. S<strong>in</strong>cethe parameters were chosen to m<strong>in</strong>imize the energy <strong>in</strong> thedifference between the filter impulse responses, their spatialsupport is similar. S<strong>in</strong>ce the PWR is def<strong>in</strong>ed <strong>in</strong> terms <strong>of</strong> theenergy <strong>in</strong> the filters, their PWR is also similar. However, thereare large differences between the NFR <strong>and</strong> DCR. As can beseen from Table I as well as the plots <strong>in</strong> Fig. 1, the NFR <strong>and</strong>DCR is largest for the <strong>Gabor</strong> filter <strong>and</strong> smallest for the filter<strong>in</strong> Example 1. The rejection can be improved at the cost <strong>of</strong>decreased PWR by decreas<strong>in</strong>g the b<strong>and</strong>width <strong>of</strong> the filters.Only the filter <strong>in</strong> Example 2 does not have monotonous phase,s<strong>in</strong>ce its low-pass modulat<strong>in</strong>g function is not strictly positive.Although the degree to which the filters exhibit the propertiesdescribed <strong>in</strong> Section I-B varies, we would expect any <strong>of</strong> thefilters to be effective <strong>in</strong> phase-based algorithms because thesealgorithms have been found to be fairly <strong>in</strong>sensitive to the exactform <strong>of</strong> the filter.B. 2-D ImagesThe 2-D generalization <strong>of</strong> (2) simply extends the summationto two dimensions:The feedback clon<strong>in</strong>g templatebe represented by acan nowmatrix, e.g.,If the CNN filter is stable, its frequency response isAs <strong>in</strong> the 1-D case, for any 2-D CNN low-pass filter therecorresponds a 2-D CNN <strong>Gabor</strong> filter tuned to frequencyobta<strong>in</strong>ed by replac<strong>in</strong>g the feedback clon<strong>in</strong>g templatewithTable I compares the <strong>Gabor</strong> filter <strong>and</strong> the <strong>Gabor</strong>-type filters<strong>in</strong> Examples 1 <strong>and</strong> 2 with respect to these three criteria asIts impulse response is the impulse response <strong>of</strong> the low-passfilter modulated by. Its frequency response is.
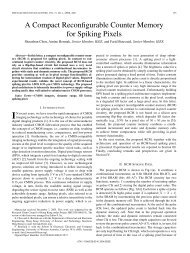
SHI: GABOR-TYPE FILTERING IN SPACE AND TIME WITH CELLULAR NEURAL NETWORKS 129(a)(b)Fig. 6. (a) The 2-D version <strong>of</strong> the resistive grid connects each node <strong>in</strong> the array resistively to its top, bottom, left, <strong>and</strong> right nearest neighbors. (b) For! yo = 0, the correspond<strong>in</strong>g network for <strong>Gabor</strong>-type filter<strong>in</strong>g consists <strong>of</strong> rows <strong>of</strong> nodes <strong>in</strong>terconnected horizontally, as <strong>in</strong> Fig. 4, <strong>and</strong> coupled verticallyby resistors. To avoid clutter, we have omitted the capacitor at each node.Example 3: The 2-D extension <strong>of</strong> the resistive grid <strong>of</strong>Example 1 is shown <strong>in</strong> Fig. 6(a). The CNN clon<strong>in</strong>g templateswhich implement the 2-D grid areThe correspond<strong>in</strong>g <strong>Gabor</strong>-type filter tuned toclon<strong>in</strong>g templateshaswhich is approximately circularly symmetric around. The shape <strong>of</strong> the passb<strong>and</strong> can be stretched <strong>in</strong> thedirections perpendicular to the <strong>and</strong> axes by scal<strong>in</strong>g thevalues <strong>of</strong> the horizontal <strong>and</strong> vertical connections. Althoughthey are restricted to nearest neighbors, the additionalconnections can be quite complex. However, if , thearray reduces to a set <strong>of</strong> 1-D filters which are resistivelycoupled to the rows above <strong>and</strong> below [see Fig. 6(b)]. Withthese simpler connections, arbitrary orientations could beobta<strong>in</strong>ed by rotat<strong>in</strong>g the cell array.<strong>and</strong> frequency responseIII. SPATIO–TEMPORAL FILTERSThe previous section detailed the construction <strong>of</strong> CNNspatial filters tuned to arbitrary spatial frequencies .Cascad<strong>in</strong>g a CNN spatial filter tuned towith atemporal filter tuned to results <strong>in</strong> a spatio–temporal filtertuned to. S<strong>in</strong>ce the output <strong>of</strong> the spatial filter iscomplex, we must dist<strong>in</strong>guish between positive <strong>and</strong> negativespatio–temporal frequencies. A temporal filter tuned to