
Create successful ePaper yourself
Turn your PDF publications into a flip-book with our unique Google optimized e-Paper software.
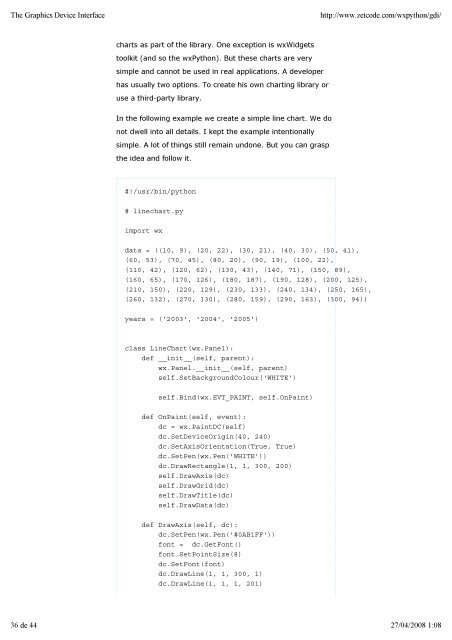
<strong>The</strong> Graphics Device Interfacehttp://www.zetcode.com/wxpython/gdi/charts as part of the library. One exception is wxWidgetstoolkit (and so the <strong>wxPython</strong>). But these charts are verysimple and cannot be used in real applications. A developerhas usually two options. To create his own charting library oruse a third-party library.In the following example we create a simple line chart. We donot dwell into all details. I kept the example intentionallysimple. A lot of things still remain undone. But you can graspthe idea and follow it.#!/usr/bin/python# linechart.pyimport wxdata = ((10, 9), (20, 22), (30, 21), (40, 30), (50, 41),(60, 53), (70, 45), (80, 20), (90, 19), (100, 22),(110, 42), (120, 62), (130, 43), (140, 71), (150, 89),(160, 65), (170, 126), (180, 187), (190, 128), (200, 125),(210, 150), (220, 129), (230, 133), (240, 134), (250, 165),(260, 132), (270, 130), (280, 159), (290, 163), (300, 94))years = ('2003', '2004', '2005')class LineChart(wx.Panel):def __init__(self, parent):wx.Panel.__init__(self, parent)self.SetBackgroundColour('WHITE')self.Bind(wx.EVT_PAINT, self.OnPaint)def OnPaint(self, event):dc = wx.PaintDC(self)dc.SetDeviceOrigin(40, 240)dc.SetAxisOrientation(True, True)dc.SetPen(wx.Pen('WHITE'))dc.DrawRectangle(1, 1, 300, 200)self.DrawAxis(dc)self.DrawGrid(dc)self.DrawTitle(dc)self.DrawData(dc)def DrawAxis(self, dc):dc.SetPen(wx.Pen('#0AB1FF'))font = dc.GetFont()font.SetPointSize(8)dc.SetFont(font)dc.DrawLine(1, 1, 300, 1)dc.DrawLine(1, 1, 1, 201)36 de 44 27/04/2008 1:08