2002 Statistical Yearbook - pacificweb.org
2002 Statistical Yearbook - pacificweb.org
2002 Statistical Yearbook - pacificweb.org

You also want an ePaper? Increase the reach of your titles
YUMPU automatically turns print PDFs into web optimized ePapers that Google loves.
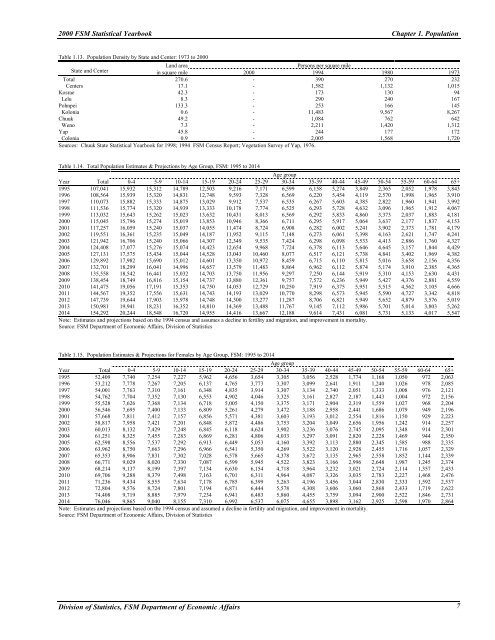
2000 FSM <strong>Statistical</strong> <strong>Yearbook</strong> Chapter 1. PopulationTable 1.13. Population Density by State and Center: 1973 to 2000Land areaPersons per square mileState and Center in square mile 2000 1994 1980 1973Total 270.6 - 390 270 232Centers 17.1 - 1,582 1,132 1,015Kosrae 42.3 - 173 130 94Lelu 8.3 - 290 240 167Pohnpei 133.3 - 253 166 145Kolonia 0.6 - 11,483 9,567 8,267Chuuk 49.2 - 1,084 762 642Weno 7.3 - 2,211 1,420 1,312Yap 45.8 - 244 177 172Colonia 0.9 - 2,005 1,568 1,720Sources: Chuuk State <strong>Statistical</strong> <strong>Yearbook</strong> for 1998; 1994 FSM Census Report; Vegetation Survey of Yap, 1976.Table 1.14. Total Population Estimates & Projections by Age Group, FSM: 1995 to 2014Age groupYear Total 0-4 5-9 10-14 15-19 20-24 25-29 30-34 35-39 40-44 45-49 50-54 55-59 60-64 65+1995 107,041 15,932 15,312 14,789 12,503 9,216 7,171 6,599 6,158 5,274 3,849 2,365 2,052 1,978 3,8431996 108,564 15,939 15,320 14,831 12,748 9,593 7,328 6,569 6,220 5,454 4,119 2,570 1,998 1,965 3,9101997 110,073 15,882 15,333 14,875 13,029 9,912 7,537 6,535 6,267 5,603 4,385 2,822 1,960 1,941 3,9921998 111,536 15,774 15,320 14,939 13,333 10,178 7,774 6,525 6,293 5,728 4,632 3,096 1,965 1,912 4,0671999 113,032 15,643 15,262 15,023 13,632 10,431 8,013 6,569 6,292 5,833 4,860 3,373 2,037 1,883 4,1812000 115,045 15,796 15,274 15,019 13,853 10,946 8,366 6,711 6,295 5,917 5,064 3,637 2,177 1,837 4,1532001 117,257 16,059 15,240 15,037 14,055 11,474 8,724 6,908 6,282 6,002 5,241 3,902 2,373 1,781 4,179<strong>2002</strong> 119,551 16,361 15,235 15,049 14,187 11,952 9,115 7,148 6,273 6,061 5,398 4,163 2,621 1,747 4,2412003 121,942 16,706 15,240 15,066 14,307 12,349 9,535 7,424 6,298 6,098 5,533 4,413 2,886 1,760 4,3272004 124,408 17,077 15,276 15,074 14,423 12,654 9,968 7,724 6,378 6,113 5,646 4,645 3,157 1,844 4,4292005 127,131 17,575 15,434 15,044 14,528 13,043 10,460 8,077 6,517 6,121 5,738 4,841 3,402 1,969 4,3822006 129,892 17,982 15,690 15,012 14,601 13,350 10,972 8,459 6,715 6,110 5,815 5,016 3,658 2,156 4,3562007 132,701 18,299 16,041 14,996 14,657 13,579 11,483 8,864 6,962 6,112 5,874 5,174 3,910 2,385 4,3652008 135,558 18,542 16,441 15,032 14,703 13,750 11,956 9,297 7,250 6,144 5,919 5,310 4,153 2,630 4,4312009 138,454 18,749 16,816 15,154 14,737 13,880 12,361 9,757 7,572 6,236 5,949 5,427 4,376 2,881 4,5592010 141,475 19,056 17,191 15,353 14,750 14,053 12,729 10,250 7,919 6,375 5,951 5,515 4,562 3,105 4,6662011 144,567 19,352 17,556 15,631 14,743 14,193 13,029 10,770 8,298 6,573 5,945 5,590 4,727 3,342 4,8182012 147,739 19,644 17,903 15,978 14,748 14,300 13,277 11,287 8,706 6,821 5,949 5,652 4,879 3,576 5,0192013 150,981 19,941 18,231 16,352 14,810 14,369 13,488 11,767 9,145 7,112 5,986 5,701 5,014 3,803 5,2622014 154,292 20,244 18,548 16,720 14,955 14,416 13,667 12,188 9,614 7,431 6,081 5,731 5,133 4,017 5,547Note: Estimates and projections based on the 1994 census and assumes a decline in fertility and migration, and improvement in mortality.Source: FSM Department of Economic Affairs, Division of StatisticsTable 1.15. Population Estimates & Projections for Females by Age Group, FSM: 1995 to 2014Age groupYear Total 0-4 5-9 10-14 15-19 20-24 25-29 30-34 35-39 40-44 45-49 50-54 55-59 60-64 65+1995 52,409 7,740 7,254 7,227 5,962 4,656 3,654 3,305 3,056 2,528 1,774 1,168 1,050 972 2,0631996 53,212 7,778 7,267 7,205 6,137 4,765 3,773 3,307 3,099 2,641 1,911 1,240 1,026 978 2,0851997 54,001 7,763 7,310 7,161 6,348 4,835 3,914 3,307 3,134 2,740 2,051 1,333 1,008 976 2,1211998 54,762 7,704 7,352 7,130 6,553 4,902 4,046 3,325 3,161 2,827 2,187 1,443 1,004 972 2,1561999 55,528 7,626 7,368 7,134 6,718 5,005 4,150 3,375 3,171 2,904 2,319 1,559 1,027 968 2,2042000 56,546 7,695 7,400 7,133 6,809 5,261 4,279 3,472 3,188 2,958 2,441 1,686 1,079 949 2,1962001 57,668 7,811 7,412 7,157 6,856 5,571 4,381 3,603 3,193 3,012 2,554 1,816 1,150 929 2,223<strong>2002</strong> 58,817 7,958 7,421 7,201 6,848 5,872 4,486 3,753 3,204 3,049 2,656 1,956 1,242 914 2,2572003 60,013 8,132 7,429 7,248 6,845 6,118 4,624 3,902 3,236 3,076 2,745 2,095 1,348 914 2,3012004 61,251 8,325 7,455 7,283 6,869 6,281 4,806 4,033 3,297 3,091 2,820 2,228 1,469 944 2,3502005 62,598 8,556 7,537 7,292 6,913 6,449 5,053 4,160 3,392 3,113 2,880 2,345 1,585 988 2,3352006 63,962 8,750 7,663 7,296 6,966 6,541 5,350 4,269 3,522 3,120 2,928 2,455 1,716 1,057 2,3292007 65,353 8,906 7,831 7,302 7,028 6,578 5,665 4,378 3,672 3,135 2,965 2,558 1,852 1,144 2,3392008 66,771 9,029 8,020 7,330 7,087 6,599 5,945 4,522 3,823 3,166 2,996 2,648 1,987 1,245 2,3742009 68,214 9,137 8,199 7,397 7,134 6,630 6,154 4,718 3,964 3,232 3,021 2,724 2,114 1,357 2,4332010 69,706 9,288 8,379 7,498 7,163 6,701 6,311 4,964 4,087 3,326 3,035 2,783 2,227 1,468 2,4762011 71,236 9,434 8,555 7,634 7,178 6,785 6,399 5,263 4,196 3,456 3,044 2,830 2,333 1,592 2,5372012 72,804 9,576 8,724 7,801 7,194 6,871 6,444 5,578 4,308 3,606 3,060 2,868 2,433 1,719 2,6222013 74,408 9,719 8,885 7,979 7,234 6,941 6,483 5,860 4,455 3,759 3,094 2,900 2,522 1,846 2,7312014 76,046 9,865 9,040 8,155 7,310 6,992 6,537 6,075 4,655 3,898 3,162 2,925 2,598 1,970 2,864Note: Estimates and projections based on the 1994 census and assumed a decline in fertility and migration, and improvement in mortality.Source: FSM Department of Economic Affairs, Division of StatisticsDivision of Statistics, FSM Department of Economic Affairs 7