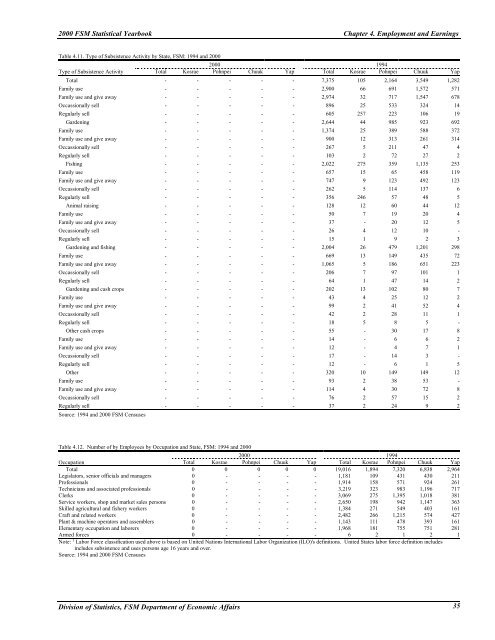
2000 FSM <strong>Statistical</strong> <strong>Yearbook</strong> Chapter 4. Employment and EarningsTable 4.11. Type of Subsistence Activity by State, FSM: 1994 and 20002000 1994Type of Subsistence Activity Total Kosrae Pohnpei Chuuk Yap Total Kosrae Pohnpei Chuuk YapTotal - - - - - 7,375 105 2,164 3,549 1,282Family use - - - - - 2,900 66 691 1,572 571Family use and give away - - - - - 2,974 32 717 1,547 678Occassionally sell - - - - - 896 25 533 324 14Regularly sell - - - - - 605 257 223 106 19Gardening - - - - - 2,644 44 985 923 692Family use - - - - - 1,374 25 389 588 372Family use and give away - - - - - 900 12 313 261 314Occassionally sell - - - - - 267 5 211 47 4Regularly sell - - - - - 103 2 72 27 2Fishing - - - - - 2,022 275 359 1,135 253Family use - - - - - 657 15 65 458 119Family use and give away - - - - - 747 9 123 492 123Occassionally sell - - - - - 262 5 114 137 6Regularly sell - - - - - 356 246 57 48 5Animal raising - - - - - 128 12 60 44 12Family use - - - - - 50 7 19 20 4Family use and give away - - - - - 37 - 20 12 5Occassionally sell - - - - - 26 4 12 10 -Regularly sell - - - - - 15 1 9 2 3Gardening and fishing - - - - - 2,004 26 479 1,201 298Family use - - - - - 669 13 149 435 72Family use and give away - - - - - 1,065 5 186 651 223Occassionally sell - - - - - 206 7 97 101 1Regularly sell - - - - - 64 1 47 14 2Gardening and cash crops - - - - - 202 13 102 80 7Family use - - - - - 43 4 25 12 2Family use and give away - - - - - 99 2 41 52 4Occassionally sell - - - - - 42 2 28 11 1Regularly sell - - - - - 18 5 8 5 -Other cash crops - - - - - 55 - 30 17 8Family use - - - - - 14 - 6 6 2Family use and give away - - - - - 12 - 4 7 1Occassionally sell - - - - - 17 - 14 3 -Regularly sell - - - - - 12 - 6 1 5Other - - - - - 320 10 149 149 12Family use - - - - - 93 2 38 53 -Family use and give away - - - - - 114 4 30 72 8Occassionally sell - - - - - 76 2 57 15 2Regularly sell - - - - - 37 2 24 9 2Source: 1994 and 2000 FSM CensusesTable 4.12. Number of by Employees by Occupation and State, FSM: 1994 and 20002000 1994Occupation Total Kosrae Pohnpei Chuuk Yap Total Kosrae Pohnpei Chuuk YapTotal 0 0 0 0 0 19,016 1,894 7,320 6,838 2,964Legislators, senior officials and managers 0 - - - - 1,181 109 431 430 211Professionals 0 - - - - 1,914 158 571 924 261Technicians and associated professionals 0 - - - - 3,219 323 983 1,196 717Clerks 0 - - - - 3,069 275 1,395 1,018 381Service workers, shop and market sales persons 0 - - - - 2,650 198 942 1,147 363Skilled agricultural and fishery workers 0 - - - - 1,384 271 549 403 161Craft and related workers 0 - - - - 2,482 266 1,215 574 427Plant & machine operators and assemblers 0 - - - - 1,143 111 478 393 161Elementary occupation and laborers 0 - - - - 1,968 181 755 751 281Armed forces 0 - - - - 6 2 1 2 1Note: 1 Labor Force classification used above is based on United Nations International Labor Organization (ILO)'s definitions. United States labor force definition includesincludes subsistence and uses persons age 16 years and over.Source: 1994 and 2000 FSM CensusesDivision of Statistics, FSM Department of Economic Affairs 35
Chapter 4. Employment and Earnings<strong>2002</strong> <strong>Statistical</strong> <strong>Yearbook</strong>Table 4.13. Change in the Number of Employees by Sector and Age Group, FSM: CY1994 to 2000.Number Percent Percent ChangeAge Group 2000 1998 1 1997 1 1994 2000 1998 1997 1994 1998-2000 1997-1998 1994-1997Person 15 years & over - 30,492 30,924 19,016 - 100.0 100.0 100.0 - -1.4 62.615-19 - 2,674 2,474 1,008 - 8.8 8.0 5.3 - 8.1 145.420-24 - 4,175 3,482 2,429 - 13.7 11.3 12.8 - 19.9 43.425-34 - 7,923 7,036 5,502 - 26.0 22.8 28.9 - 12.6 27.935-44 - 7,439 7,888 5,635 - 24.4 25.5 29.6 - -5.7 40.045-54 - 5,664 6,123 2,844 - 18.6 19.8 15.0 - -7.5 115.355-64 - 1,776 2,832 1,302 - 5.8 9.2 6.8 - -37.3 117.565+ - 841 1,089 296 - 2.8 3.5 1.6 - -22.8 267.9Public - 15,775 19,097 9,400 - 100.0 121.1 59.6 - -17.4 103.215-19 - 337 379 265 - 2.1 2.4 1.7 - -11.1 43.020-24 - 1,481 1,112 661 - 9.4 7.0 4.2 - 33.2 68.225-34 - 3,226 4,056 2,332 - 20.5 25.7 14.8 - -20.5 73.935-44 - 4,609 5,438 3,346 - 29.2 34.5 21.2 - -15.2 62.545-54 - 4,169 4,890 1,804 - 26.4 31.0 11.4 - -14.7 171.155-64 - 1,228 2,159 854 - 7.8 13.7 5.4 - -43.1 152.865+ - 725 1,063 138 - 4.6 6.7 0.9 - -31.8 670.3Private - 14,717 11,827 9,616r - 100.0 100.0 100.0 - 24.4 23.015-19 - 2,337 2,095 743r - 15.9 17.7 7.7 - 11.6 182.020-24 - 2,694 2,370 1,768r - 18.3 20.0 18.4 - 13.7 34.025-34 - 4,697 2,980 3,170 - 31.9 25.2 33.0 - 57.6 -6.035-44 - 2,830 2,450 2,289 - 19.2 20.7 23.8 - 15.5 7.045-54 - 1,495 1,233 1,040 - 10.2 10.4 10.8 - 21.2 18.655-64 - 548 673 448 - 3.7 5.7 4.7 - -18.6 50.265+ - 116 26 158 - 0.8 0.2 1.6 - 346.2 -83.5Note: 1998 & 1997 data are provisional and they are not comparable to 1994 data due to the complication on program definition.Sources: 1994 and 2000 FSM Censuses; 1997 Labor Force Survey; 1998 Household Income and Expenditure Survey.Table 4.14. Labor Force Participation Change Overtime in the FSM: 1994 to 2000Number Percent Percent ChangeLabor Force Status 2000 1998 1997 1994 2000 1998 1997 1994 1998-2000 1997-1 998 1994-1997Person 15 years and over - 68,377 64,862 59,573 - 100.0 100.0 100.0 - 5.4 8.9In the Labor Force - 35,033 39,311 25,972 - 51.2 60.6 43.6 - -10.9 51.4Employed - 32,254 30,929 21,756 - 47.2 47.7 36.5 - 4.3 42.2Formal Workforce - 15,940 16,908 14,381 - 23.3 26.1 24.1 - -5.7 17.6Agriculture/Fishing - 16,314 14,021 7,375 - 23.9 21.6 12.4 - 16.4 90.1Subsistence - 10,166 8,368 5,874 - 14.9 12.9 9.9 - 21.5 42.5Market Oriented - 6,148 5,653 1,501 - 9.0 8.7 2.5 - 8.8 276.6Unemployed - 2,779 8,382 4,216 - 4.1 12.9 7.1 - -66.8 98.8Not in the Labor Force - 33,344 25,551 33,601 - 48.8 39.4 56.4 - 30.5 -24.0Could have taken a job - 879 623 6,125 - 1.3 1.0 10.3 - 41.1 -89.8Not available for work - 32,465 24,928 27,476 - 47.5 38.4 46.1 - 30.2 -9.3Note: Data for 1998 and 1997 are provisional and may not be comparable to 1994 data due to the complication on program definition.Sources: 1994 and 2000 FSM Censuses; 1997 Labor Force Survey; 1998 Household Income and Expenditure SurveyTable 4.15. Household, Family and Individual Income by State, FSM: CY1994 to 2000Number Median Income ($)State 2000 1998 1997 1994 2000 1998 1997 1994HouseholdTotal - 14,797 13,210 11,233 - 4,604 5,212 4,694Kosrae - 945 919 907 - 8,642 7,169 6,739Pohnpei - 5,032 4,829 4,025 - 4,787 6,418 7,503Chuuk - 7,026 5,573 4,875 - 3,586 4,073 2,444Yap - 1,794 1,889 1,426 - 6,875 6,131 5,998FamilyTotal - 14,192 12,821 10,649 - 4,693 5,118 4,473Kosrae - 945 907 875 - 8,421 6,942 6,574Pohnpei - 4,765 4,619 3,793 - 4,857 6,428 7,084Chuuk - 6,856 5,548 4,696 - 3,627 4,074 2,268Yap - 1,626 1,747 1,285 - 7,379 6,096 5,810Individuals 15+ years with incomeTotal - 35,141 30,231 20,924 - 1,366 2,130 2,637Kosrae - 2,512 1,742 2,052 - 3,866 4,555 3,253Pohnpei - 10,795 11,427 7,032 - 1,038 3,872 4,312Chuuk - 17,684 11,675 9,283 - 1,859 2,455 987Yap - 4,150 5,387 2,557 - 3,931 1,615 3,509Note: Data for 1998 and 1997 are provisional and may not be comparable to 1994 data due to the complication on program definition.Source: 1994 and 2000 FSM Censuses; 1997 Labor force Survey; 1998 Household Income and Expenditure Survey36Division of Statistics, FSM Department of Economic Affairs