2002 Statistical Yearbook - pacificweb.org
2002 Statistical Yearbook - pacificweb.org
2002 Statistical Yearbook - pacificweb.org
You also want an ePaper? Increase the reach of your titles
YUMPU automatically turns print PDFs into web optimized ePapers that Google loves.
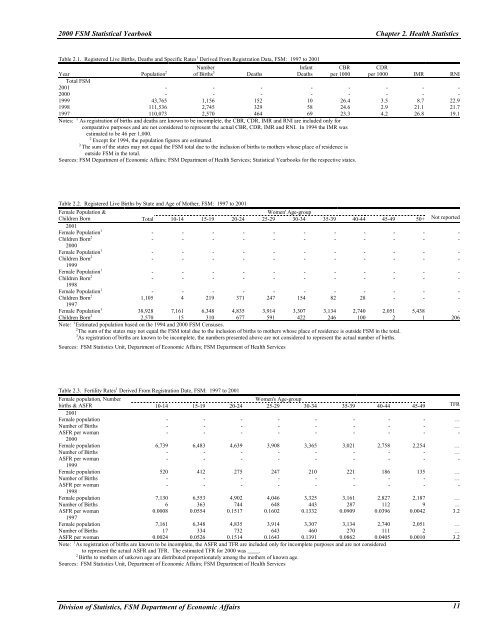
2000 FSM <strong>Statistical</strong> <strong>Yearbook</strong> Chapter 2. Health StatisticsTable 2.1. Registered Live Births, Deaths and Specific Rates 1 Derived From Registration Data, FSM: 1997 to 2001Number Infant CBR CDRYear Population 2 of Births 3 Deaths Deaths per 1000 per 1000 IMR RNITotal FSM2001 - - - - - - - -2000 - - - - - - - -1999 43,765 1,156 152 10 26.4 3.5 8.7 22.91998 111,536 2,745 329 58 24.6 2.9 21.1 21.71997 110,073 2,570 464 69 23.3 4.2 26.8 19.1Notes: 1 As registration of births and deaths are known to be incomplete, the CBR, CDR, IMR and RNI are included only forcomparative purposes and are not considered to represent the actual CBR, CDR, IMR and RNI. In 1994 the IMR wasestimated to be 46 per 1,000.2Except for 1994, the population figures are estimated.3The sum of the states may not equal the FSM total due to the inclusion of births to mothers whose place of residence isoutside FSM in the total.Sources: FSM Department of Economic Affairs; FSM Department of Health Services; <strong>Statistical</strong> <strong>Yearbook</strong>s for the respective states.Table 2.2. Registered Live Births by State and Age of Mother, FSM: 1997 to 2001Female Population &Women' Age-groupChildren Born Total 10-14 15-19 20-24 25-29 30-34 35-39 40-44 45-49 50+ Not reported2001Female Population 1 - - - - - - - - - - -Children Born 2 - - - - - - - - - - -2000Female Population 1 - - - - - - - - - - -Children Born 2 - - - - - - - - - - -1999Female Population 1 - - - - - - - - - - -Children Born 2 - - - - - - - - - - -1998Female Population 1 - - - - - - - - - - -Children Born 2 1,105 4 219 371 247 154 82 28 - - -1997Female Population 1 38,928 7,161 6,348 4,835 3,914 3,307 3,134 2,740 2,051 5,438 -Children Born 2 2,570 15 310 677 591 422 246 100 2 1 206Note: 1 Estimated population based on the 1994 and 2000 FSM Censuses.2 The sum of the states may not equal the FSM total due to the inclusion of births to mothers whose place of residence is outside FSM in the total.3 As registration of births are known to be incomplete, the numbers presented above are not considered to represent the actual number of births.Sources: FSM Statistics Unit, Department of Economic Affairs; FSM Department of Health ServicesTable 2.3. Fertility Rates 1 Derived From Registration Date, FSM: 1997 to 2001Female population, NumberWomen's Age-groupbirths & ASFR 10-14 15-19 20-24 25-29 30-34 35-39 40-44 45-49 TFR2001Female population - - - - - - - - …Number of Births - - - - - - - - …ASFR per woman - - - - - - - - -2000Female population 6,739 6,483 4,639 3,908 3,365 3,021 2,758 2,254 …Number of Births - - - - - - - - …ASFR per woman - - - - - - - - -1999Female population 520 412 275 247 210 221 186 135 …Number of Births - - - - - - - - …ASFR per woman - - - - - - - - -1998Female population 7,130 6,553 4,902 4,046 3,325 3,161 2,827 2,187 …Number of Births 6 363 744 648 443 287 112 9 …ASFR per woman 0.0008 0.0554 0.1517 0.1602 0.1332 0.0909 0.0396 0.0042 3.21997Female population 7,161 6,348 4,835 3,914 3,307 3,134 2,740 2,051 …Number of Births 17 334 732 643 460 270 111 2 …ASFR per woman 0.0024 0.0526 0.1514 0.1643 0.1391 0.0862 0.0405 0.0010 3.2Note: 1 As registration of births are known to be incomplete, the ASFR and TFR are included only for incomplete purposes and are not consideredto represent the actual ASFR and TFR. The estimated TFR for 2000 was ____.2Births to mothers of unkown age are distributed proportionately among the mothers of known age.Sources: FSM Statistics Unit, Department of Economic Affairs; FSM Department of Health ServicesDivision of Statistics, FSM Department of Economic Affairs 11


