2002 Statistical Yearbook - pacificweb.org
2002 Statistical Yearbook - pacificweb.org
2002 Statistical Yearbook - pacificweb.org
You also want an ePaper? Increase the reach of your titles
YUMPU automatically turns print PDFs into web optimized ePapers that Google loves.
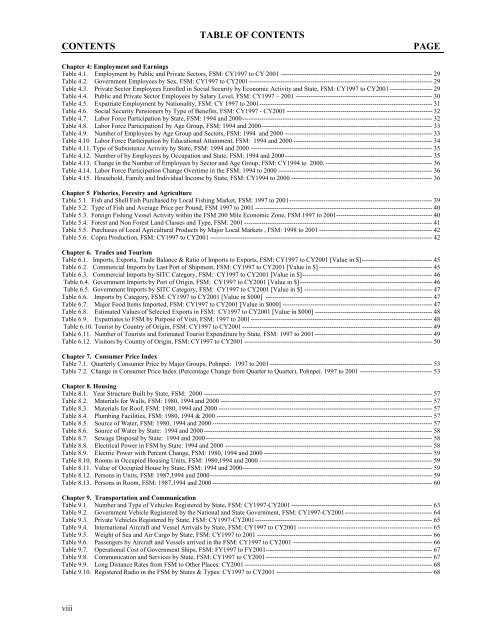
CONTENTSTABLE OF CONTENTSPAGEChapter 4: Employment and EarningsTable 4.1. Employment by Public and Private Sectors, FSM: CY1997 to CY 2001 ----------------------------------------------------------------------- 29Table 4.2. Government Employees by Sex, FSM: CY1997 to CY2001-------------------------------------------------------------------------------------- 29Table 4.3. Private Sector Employees Enrolled in Social Security by Economic Activity and State, FSM: CY1997 to CY2001-------------------- 29Table 4.4. Public and Private Sector Employees by Salary Level, FSM: CY1997 – 2001 ---------------------------------------------------------------- 30Table 4.5. Expatriate Employment by Nationality, FSM: CY 1997 to 2001--------------------------------------------------------------------------------- 31Table 4.6. Social Security Pensioners by Type of Benefits, FSM: CY1997 - CY2001 -------------------------------------------------------------------- 32Table 4.7. Labor Force Participation by State, FSM: 1994 and 2000----------------------------------------------------------------------------------------- 32Table 4.8. Labor Force Participation1 by Age Group, FSM: 1994 and 2000-------------------------------------------------------------------------------- 33Table 4.9. Number of Employees by Age Group and Sectors, FSM: 1994 and 2000 --------------------------------------------------------------------- 33Table 4.10 Labor Force Participation by Educational Attainment, FSM: 1994 and 2000 ----------------------------------------------------------------- 34Table 4.11. Type of Subsistence Activity by State, FSM: 1994 and 2000 ------------------------------------------------------------------------------------- 35Table 4.12. Number of by Employees by Occupation and State, FSM: 1994 and 2000--------------------------------------------------------------------- 35Table 4.13. Change in the Number of Employees by Sector and Age Group, FSM: CY1994 to 2000. -------------------------------------------------- 36Table 4.14. Labor Force Participation Change Overtime in the FSM: 1994 to 2000 ------------------------------------------------------------------------ 36Table 4.15. Household, Family and Individual Income by State, FSM: CY1994 to 2000 ------------------------------------------------------------------ 36Chapter 5 Fisheries, Forestry and AgricultureTable 5.1. Fish and Shell Fish Purchased by Local Fishing Market, FSM: 1997 to 2001------------------------------------------------------------------- 39Table 5.2. Type of Fish and Average Price per Pound, FSM 1997 to 2001 ----------------------------------------------------------------------------------- 40Table 5.3. Foreign Fishing Vessel Activity within the FSM 200 Mile Economic Zone, FSM 1997 to 2001--------------------------------------------- 40Table 5.4. Forest and Non Forest Land Classes and Type, FSM: 2001 ---------------------------------------------------------------------------------------- 41Table 5.5. Purchases of Local Agricultural Products by Major Local Markets , FSM: 1998 to 2001 ----------------------------------------------------- 42Table 5.6. Copra Production, FSM: CY1997 to CY2001 -------------------------------------------------------------------------------------------------------- 42Chapter 6. Trades and TourismTable 6.1. Imports, Exports, Trade Balance & Ratio of Imports to Exports, FSM: CY1997 to CY2001 [Value in $]--------------------------------- 45Table 6.2. Commercial Imports by Last Port of Shipment, FSM: CY1997 to CY2001 [Value in $] ----------------------------------------------------- 45Table 6.3. Commercial Imports by SITC Category, FSM: CY1997 to CY2001 [Value in $]------------------------------------------------------------- 46Table 6.4. Government Imports by Port of Origin, FSM: CY1997 to CY2001 [Value in $]-------------------------------------------------------------- 46Table 6.5. Government Imports by SITC Category, FSM: CY1997 to CY2001 [Value in $] ------------------------------------------------------------ 47Table 6.6. Imports by Category, FSM: CY1997 to CY2001 [Value in $000] ------------------------------------------------------------------------------ 47Table 6.7. Major Food Items Imported, FSM: CY1997 to CY2001 [Value in $000] ---------------------------------------------------------------------- 47Table 6.8. Estimated Values of Selected Exports in FSM: CY1997 to CY2001 [Value in $000] ------------------------------------------------------- 48Table 6.9. Expatriates to FSM by Purpose of Visit, FSM: 1997 to 2001------------------------------------------------------------------------------------- 48Table 6.10. Tourist by Country of Origin, FSM: CY1997 to CY2001 ----------------------------------------------------------------------------------------- 49Table 6.11. Number of Tourists and Estimated Tourist Expenditure by State, FSM: 1997 to 2001 ------------------------------------------------------- 49Table 6.12. Visitors by Country of Origin, FSM: CY1997 to CY2001 ---------------------------------------------------------------------------------------- 50Chapter 7. Consumer Price IndexTable 7.1. Quarterly Consumer Price by Major Groups, Pohnpei: 1997 to 2001 ---------------------------------------------------------------------------- 53Table 7.2. Change in Consumer Price Index (Percentage Change from Quarter to Quarter), Pohnpei. 1997 to 2001 ---------------------------------- 53Chapter 8. HousingTable 8.1. Year Structure Built by State, FSM: 2000 ----------------------------------------------------------------------------------------------------------- 57Table 8.2. Materials for Walls, FSM: 1980, 1994 and 2000 --------------------------------------------------------------------------------------------------- 57Table 8.3. Materials for Roof, FSM: 1980, 1994 and 2000 ---------------------------------------------------------------------------------------------------- 57Table 8.4. Plumbing Facilities, FSM: 1980, 1994 & 2000 ----------------------------------------------------------------------------------------------------- 57Table 8.5. Source of Water, FSM: 1980, 1994 and 2000 ------------------------------------------------------------------------------------------------------- 57Table 8.6. Source of Water by State: 1994 and 2000 ----------------------------------------------------------------------------------------------------------- 58Table 8.7. Sewage Disposal by State: 1994 and 2000 ---------------------------------------------------------------------------------------------------------- 58Table 8.8. Electrical Power in FSM by State: 1994 and 2000 ------------------------------------------------------------------------------------------------- 58Table 8.9. Electric Power with Percent Change, FSM: 1980, 1994 and 2000 ------------------------------------------------------------------------------- 59Table 8.10. Rooms in Occupied Housing Units, FSM: 1980,1994 and 2000 --------------------------------------------------------------------------------- 59Table 8.11. Value of Occupied House by State, FSM: 1994 and 2000----------------------------------------------------------------------------------------- 59Table 8.12. Persons in Units, FSM: 1987,1994 and 2000-------------------------------------------------------------------------------------------------------- 59Table 8.13. Persons in Room, FSM: 1987,1994 and 2000 ------------------------------------------------------------------------------------------------------- 60Chapter 9. Transportation and CommunicationTable 9.1. Number and Type of Vehicles Registered by State, FSM: CY1997-CY2001 ------------------------------------------------------------------ 63Table 9.2. Government Vehicle Registered by the National and State Government, FSM: CY1997-CY2001----------------------------------------- 64Table 9.3. Private Vehicles Registered by State, FSM: CY1997-CY2001----------------------------------------------------------------------------------- 65Table 9.4. International Aircraft and Vessel Arrivals by State, FSM: CY1997 to CY2001 --------------------------------------------------------------- 65Table 9.5. Weight of Sea and Air Cargo by State, FSM: CY1997 to 2001 ---------------------------------------------------------------------------------- 66Table 9.6. Passengers by Aircraft and Vessels arrived in the FSM: CY1997 to CY2001 ----------------------------------------------------------------- 66Table 9.7. Operational Cost of Government Ships, FSM: FY1997 to FY2001------------------------------------------------------------------------------ 67Table 9.8. Communication and Services by State, FSM: CY1997 to CY2001------------------------------------------------------------------------------ 67Table 9.9. Long Distance Rates from FSM to Other Places: CY2001---------------------------------------------------------------------------------------- 68Table 9.10. Registered Radio in the FSM by States & Types: CY1997 to CY2001 ------------------------------------------------------------------------- 68viii


