2002 Statistical Yearbook - pacificweb.org
2002 Statistical Yearbook - pacificweb.org
2002 Statistical Yearbook - pacificweb.org

You also want an ePaper? Increase the reach of your titles
YUMPU automatically turns print PDFs into web optimized ePapers that Google loves.
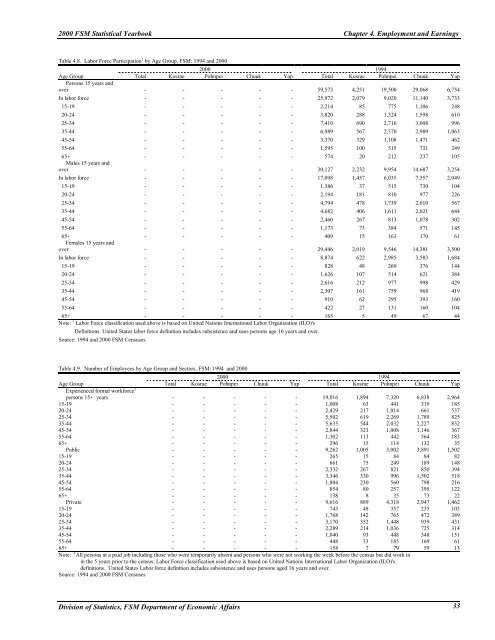
2000 FSM <strong>Statistical</strong> <strong>Yearbook</strong> Chapter 4. Employment and EarningsTable 4.8. Labor Force Participation 1 by Age Group, FSM: 1994 and 20002000 1994Age Group Total Kosrae Pohnpei Chuuk Yap Total Kosrae Pohnpei Chuuk YapPersons 15 years andover - - - - - 59,573 4,251 19,500 29,068 6,754In labor force - - - - - 25,972 2,079 9,020 11,140 3,73315-19 - - - - - 2,214 85 775 1,106 24820-24 - - - - - 3,820 288 1,324 1,598 61025-34 - - - - - 7,410 690 2,716 3,008 99635-44 - - - - - 6,989 567 2,370 2,989 1,06345-54 - - - - - 3,370 329 1,108 1,471 46255-64 - - - - - 1,595 100 515 731 24965+ - - - - - 574 20 212 237 105Males 15 years andover - - - - - 30,127 2,232 9,954 14,687 3,254In labor force - - - - - 17,098 1,457 6,035 7,557 2,04915-19 - - - - - 1,386 37 515 730 10420-24 - - - - - 2,194 181 810 977 22625-34 - - - - - 4,794 478 1,739 2,010 56735-44 - - - - - 4,682 406 1,611 2,021 64445-54 - - - - - 2,460 267 813 1,078 30255-64 - - - - - 1,173 73 384 571 14565+ - - - - - 409 15 163 170 61Females 15 years andover - - - - - 29,446 2,019 9,546 14,381 3,500In labor force - - - - - 8,874 622 2,985 3,583 1,68415-19 - - - - - 828 48 260 376 14420-24 - - - - - 1,626 107 514 621 38425-34 - - - - - 2,616 212 977 998 42935-44 - - - - - 2,307 161 759 968 41945-54 - - - - - 910 62 295 393 16055-64 - - - - - 422 27 131 160 10465+ - - - - - 165 5 49 67 44Note: 1 Labor Force classification used above is based on United Nations International Labor Organization (ILO)'sDefinitions. United States labor force definition includes subsistence and uses persons age 16 years and over.Source: 1994 and 2000 FSM CensusesTable 4.9. Number of Employees by Age Group and Sectors, FSM: 1994 and 20002000 1994Age Group Total Kosrae Pohnpei Chuuk Yap Total Kosrae Pohnpei Chuuk YapExperienced formal workforce 1persons 15+ years - - - - - 19,016 1,894 7,320 6,838 2,96415-19 - - - - - 1,008 63 441 319 18520-24 - - - - - 2,429 217 1,014 661 53725-34 - - - - - 5,502 619 2,269 1,789 82535-44 - - - - - 5,635 544 2,032 2,227 83245-54 - - - - - 2,844 323 1,008 1,146 36755-64 - - - - - 1,302 113 442 564 18365+ - - - - - 296 15 114 132 35Public - - - - - 9,262 1,005 3,002 3,891 1,50215-19 - - - - - 265 15 84 84 8220-24 - - - - - 661 75 249 189 14825-34 - - - - - 2,332 267 821 850 39435-44 - - - - - 3,346 330 996 1,502 51845-54 - - - - - 1,804 230 560 798 21655-64 - - - - - 854 80 257 395 12265+ - - - - - 138 8 35 73 22Private - - - - - 9,616 889 4,318 2,947 1,46215-19 - - - - - 743 48 357 235 10320-24 - - - - - 1,768 142 765 472 38925-34 - - - - - 3,170 352 1,448 939 43135-44 - - - - - 2,289 214 1,036 725 31445-54 - - - - - 1,040 93 448 348 15155-64 - - - - - 448 33 185 169 6165+ - - - - - 158 7 79 59 13Note: 1 All persons at a paid job including those who were temporarily absent and persons who were not working the week before the census but did work inin the 5 years prior to the census; Labor Force classification used above is based on United Nations International Labor Organization (ILO)'sdefinitions. United States Labor force definition includes subsistence and uses persons aged 16 years and over.Source: 1994 and 2000 FSM CensusesDivision of Statistics, FSM Department of Economic Affairs 33