Quarterly Report - Kadin Indonesia
Quarterly Report - Kadin Indonesia
Quarterly Report - Kadin Indonesia

You also want an ePaper? Increase the reach of your titles
YUMPU automatically turns print PDFs into web optimized ePapers that Google loves.
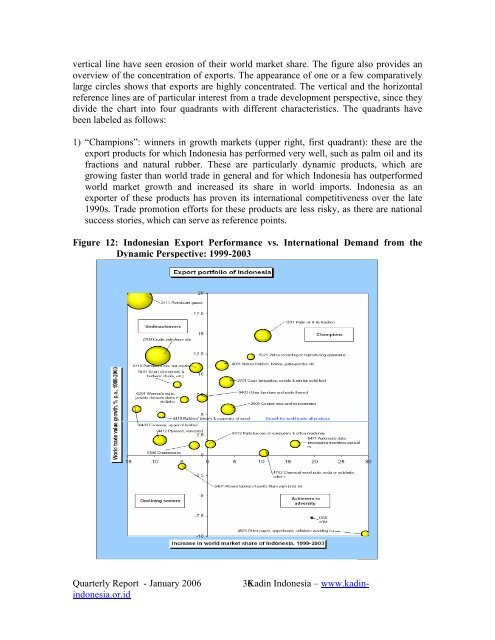
vertical line have seen erosion of their world market share. The figure also provides anoverview of the concentration of exports. The appearance of one or a few comparativelylarge circles shows that exports are highly concentrated. The vertical and the horizontalreference lines are of particular interest from a trade development perspective, since theydivide the chart into four quadrants with different characteristics. The quadrants havebeen labeled as follows:1) “Champions”: winners in growth markets (upper right, first quadrant): these are theexport products for which <strong>Indonesia</strong> has performed very well, such as palm oil and itsfractions and natural rubber. These are particularly dynamic products, which aregrowing faster than world trade in general and for which <strong>Indonesia</strong> has outperformedworld market growth and increased its share in world imports. <strong>Indonesia</strong> as anexporter of these products has proven its international competitiveness over the late1990s. Trade promotion efforts for these products are less risky, as there are nationalsuccess stories, which can serve as reference points.Figure 12: <strong>Indonesia</strong>n Export Performance vs. International Demand from theDynamic Perspective: 1999-200336 <strong>Kadin</strong> <strong>Indonesia</strong> – www.kadin-<strong>Quarterly</strong> <strong>Report</strong> - January 2006indonesia.or.id