Quarterly Report - Kadin Indonesia
Quarterly Report - Kadin Indonesia
Quarterly Report - Kadin Indonesia

You also want an ePaper? Increase the reach of your titles
YUMPU automatically turns print PDFs into web optimized ePapers that Google loves.
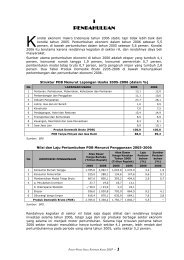
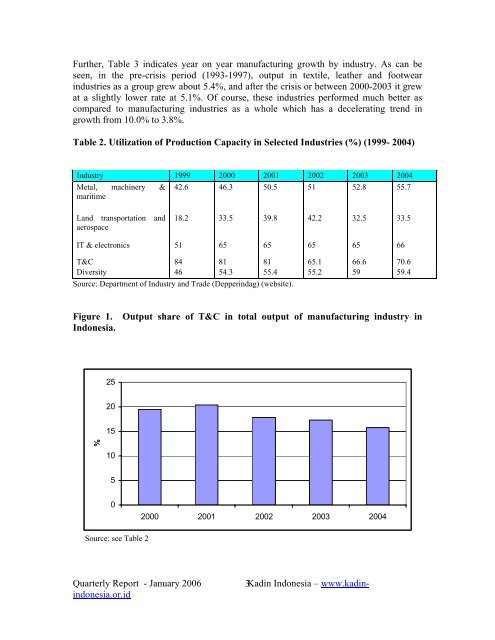
Further, Table 3 indicates year on year manufacturing growth by industry. As can beseen, in the pre-crisis period (1993-1997), output in textile, leather and footwearindustries as a group grew about 5.4%, and after the crisis or between 2000-2003 it grewat a slightly lower rate at 5.1%. Of course, these industries performed much better ascompared to manufacturing industries as a whole which has a decelerating trend ingrowth from 10.0% to 3.8%.Table 2. Utilization of Production Capacity in Selected Industries (%) (1999- 2004)Industry 1999 2000 2001 2002 2003 2004Metal, machinery & 42.6 46.3 50.5 51 52.8 55.7maritimeLand transportation andaerospace18.2 33.5 39.8 42.2 32.5 33.5IT & electronics 51 65 65 65 65 66T&C 84 81 81 65.1 66.6 70.6Diversity 46 54.3 55.4 55.2 59 59.4Source: Department of Industry and Trade (Depperindag) (website).Figure 1. Output share of T&C in total output of manufacturing industry in<strong>Indonesia</strong>.252015%10502000 2001 2002 2003 2004Source: see Table 2<strong>Quarterly</strong> <strong>Report</strong> - January 2006indonesia.or.id3<strong>Kadin</strong> <strong>Indonesia</strong> – www.kadin-