Backdating Executive Option Grants - Nanyang Technological ...
Backdating Executive Option Grants - Nanyang Technological ...
Backdating Executive Option Grants - Nanyang Technological ...
You also want an ePaper? Increase the reach of your titles
YUMPU automatically turns print PDFs into web optimized ePapers that Google loves.
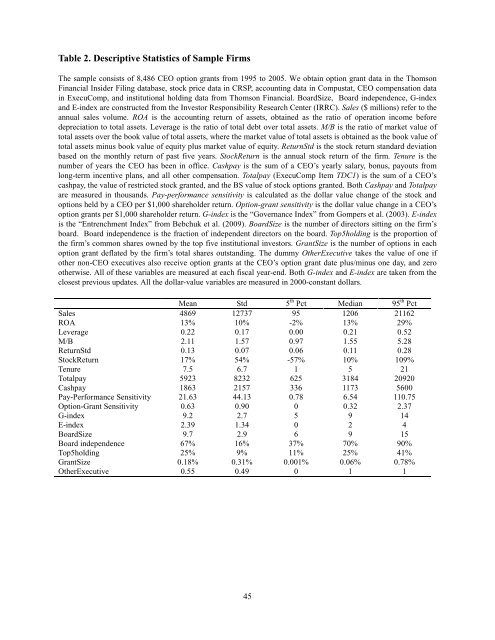
Table 2. Descriptive Statistics of Sample FirmsThe sample consists of 8,486 CEO option grants from 1995 to 2005. We obtain option grant data in the ThomsonFinancial Insider Filing database, stock price data in CRSP, accounting data in Compustat, CEO compensation datain ExecuComp, and institutional holding data from Thomson Financial. BoardSize, Board independence, G-indexand E-index are constructed from the Investor Responsibility Research Center (IRRC). Sales ($ millions) refer to theannual sales volume. ROA is the accounting return of assets, obtained as the ratio of operation income beforedepreciation to total assets. Leverage is the ratio of total debt over total assets. M/B is the ratio of market value oftotal assets over the book value of total assets, where the market value of total assets is obtained as the book value oftotal assets minus book value of equity plus market value of equity. ReturnStd is the stock return standard deviationbased on the monthly return of past five years. StockReturn is the annual stock return of the firm. Tenure is thenumber of years the CEO has been in office. Cashpay is the sum of a CEO’s yearly salary, bonus, payouts fromlong-term incentive plans, and all other compensation. Totalpay (ExecuComp Item TDC1) is the sum of a CEO’scashpay, the value of restricted stock granted, and the BS value of stock options granted. Both Cashpay and Totalpayare measured in thousands. Pay-performance sensitivity is calculated as the dollar value change of the stock andoptions held by a CEO per $1,000 shareholder return. <strong>Option</strong>-grant sensitivity is the dollar value change in a CEO’soption grants per $1,000 shareholder return. G-index is the “Governance Index” from Gompers et al. (2003). E-indexis the “Entrenchment Index” from Bebchuk et al. (2009). BoardSize is the number of directors sitting on the firm’sboard. Board independence is the fraction of independent directors on the board. Top5holding is the proportion ofthe firm’s common shares owned by the top five institutional investors. GrantSize is the number of options in eachoption grant deflated by the firm’s total shares outstanding. The dummy Other<strong>Executive</strong> takes the value of one ifother non-CEO executives also receive option grants at the CEO’s option grant date plus/minus one day, and zerootherwise. All of these variables are measured at each fiscal year-end. Both G-index and E-index are taken from theclosest previous updates. All the dollar-value variables are measured in 2000-constant dollars.Mean Std 5 th Pct Median 95 th PctSales 4869 12737 95 1206 21162ROA 13% 10% -2% 13% 29%Leverage 0.22 0.17 0.00 0.21 0.52M/B 2.11 1.57 0.97 1.55 5.28ReturnStd 0.13 0.07 0.06 0.11 0.28StockReturn 17% 54% -57% 10% 109%Tenure 7.5 6.7 1 5 21Totalpay 5923 8232 625 3184 20920Cashpay 1863 2157 336 1173 5600Pay-Performance Sensitivity 21.63 44.13 0.78 6.54 110.75<strong>Option</strong>-Grant Sensitivity 0.63 0.90 0 0.32 2.37G-index 9.2 2.7 5 9 14E-index 2.39 1.34 0 2 4BoardSize 9.7 2.9 6 9 15Board independence 67% 16% 37% 70% 90%Top5holding 25% 9% 11% 25% 41%GrantSize 0.18% 0.31% 0.001% 0.06% 0.78%Other<strong>Executive</strong> 0.55 0.49 0 1 145


