Supplementary Quarterly Financial Information(unaudited)- 16 -Quarters ended November 30, August 31, May 31, February 29 / 28,($000, except percentages and pershare data)2008$2007 (1)$2008 (1)$2007 (1)$2008 (1)$2007 (1)$2008 (1)$2007 (1)$Revenue 308,375 260,255 292,873 251,300 283,878 249,424 271,894 238,378Operating income from continuingoperations before amortization (2) 124,704 100,174 122,019 100,755 117,206 94,533 109,523 88,065Operating margin (2) 40.4% 38.5% 41.7% 40.1% 41.3% 37.9% 40.3% 36.9%Amortization 64,063 53,039 61,775 54,723 58,564 47,725 56,346 44,018Operating income from continuingoperations 60,641 47,135 60,244 46,032 58,642 46,808 53,177 44,047Financial expense 23,778 16,333 19,066 19,084 17,748 20,345 17,550 24,502Income taxes 9,848 9,277 9,849 (7,480) 10,285 8,055 (14,426) 4,233Loss (gain) on dilution 26 107 19 (27,011) 3 64 (25) (30,990)Non-controlling interest 15,936 13,762 21,559 24,240 21,068 13,318 33,763 9,647Income from continuing operations 11,053 7,656 9,656 37,097 9,538 5,025 16,315 36,655Loss from discontinued operations - (17,632) – (6,713) – (1,966) (425) (2,109)Net income (loss) 11,053 (9,976) 9,656 30,384 9,538 3,059 15,890 34,546Cash flow from operations fromcontinuing operations (2) 95,626 81,377 99,969 78,153 96,068 76,862 85,374 63,353Cash flow from operating activities fromcontinuing operations 30,470 46,604 146,052 107,155 112,893 51,669 92,942 61,484Free cash flow (2) 21,771 22,974 20,981 9,131 37,107 19,052 19,374 10,461Earnings (loss) per shareBasicIncome from continuing operations 0.66 0.46 0.58 2.23 0.57 0.30 0.98 2.21Loss from discontinued operations – (1.06) – (0.40) – (0.12) (0.03) (0.13)Net income (loss) 0.66 (0.60) 0.58 1.83 0.57 0.18 0.95 2.08DilutedIncome from continuing operations 0.66 0.46 0.58 2.21 0.57 0.30 0.97 2.20Loss from discontinued operations – (1.06) – (0.40) – (0.12) (0.03) (0.13)Net income (loss) 0.66 (0.60) 0.58 1.81 0.57 0.18 0.95 2.07(1)Certain comparative figures have been reclassified to conform to the current year’s presentation. Financial information for the first quarter of fiscal 2008 and thesecond through fourth quarters of fiscal 2007 has been restated to reflect the termination of our investment in the TQS Group, which is no longer consolidatedsince December 18, 2007 (see note 14 to the consolidated financial statement). Financial information for the four quarters of fiscal 2008 and second throughfourth quarters of fiscal 2007 reflects the presentation of foreign exchange gains or losses as financial expense instead of operating costs.(2)The indicated terms do not have standardized definitions prescribed by Canadian Generally Accepted Accounting Principles (“GAAP”) and therefore, may not becomparable to similar measures presented by other companies. For more details, please consult the “Non-GAAP financial measures” section of theManagement’s discussion and analysis.The cable sector’s operating results are not generally subject to material seasonal fluctuations. However, the loss in BasicCable service customers is usually greater, and the addition of HSI service customers is generally lower in the thirdquarter, mainly because students leave their campus at the end of the school year. <strong>Cogeco</strong> Cable offers its services inseveral university and college towns such as Kingston, Windsor, St. Catharines, Hamilton, Peterborough, Trois-Rivièresand Rimouski in Canada, and Aveiro, Covilhã, Evora, Guarda and Coimbra in Portugal.The radio activities’ operating results may be subject to significant seasonal variations. Advertising revenue depends onaudience ratings and the market for radio advertising expenditures in the Province of Québec. Audience ratings may varydue to a number of factors, including on-air personalities, programming content and promotional activities. Advertisinglevel may also vary due to many factors, including general economic and consumer retail market conditions and cycles.Advertising sales, mainly for national advertising, are normally weaker in the second and fourth quarters and, accordingly,the operating margin is generally lower in those quarters.
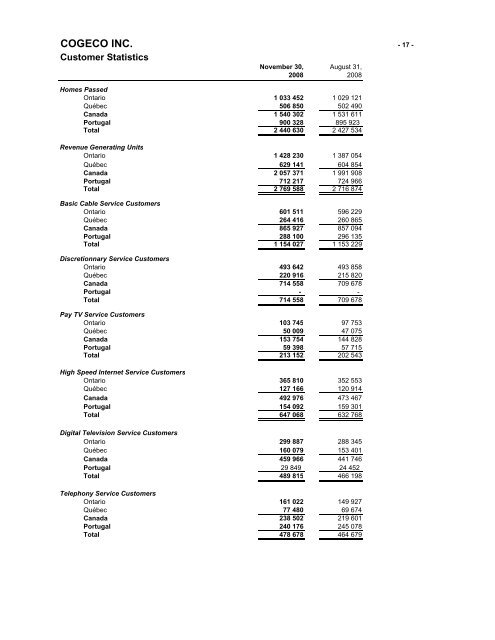
COGECO INC. - 17 -Customer StatisticsNovember 30, August 31,2008 2008Homes PassedOntario 1 033 452 1 029 121Québec 506 850 502 490Canada 1 540 302 1 531 611Portugal 900 328 895 923Total 2 440 630 2 427 534Revenue Generating UnitsOntario 1 428 230 1 387 054Québec 629 141 604 854Canada 2 057 371 1 991 908Portugal 712 217 724 966Total 2 769 588 2 716 874Basic Cable Service CustomersOntario 601 511 596 229Québec 264 416 260 865Canada 865 927 857 094Portugal 288 100 296 135Total 1 154 027 1 153 229Discretionnary Service CustomersOntario 493 642 493 858Québec 220 916 215 820Canada 714 558 709 678Portugal - -Total 714 558 709 678Pay TV Service CustomersOntario 103 745 97 753Québec 50 009 47 075Canada 153 754 144 828Portugal 59 398 57 715Total 213 152 202 543High Speed Internet Service CustomersOntario 365 810 352 553Québec 127 166 120 914Canada 492 976 473 467Portugal 154 092 159 301Total 647 068 632 768Digital Television Service CustomersOntario 299 887 288 345Québec 160 079 153 401Canada 459 966 441 746Portugal 29 849 24 452Total 489 815 466 198Telephony Service CustomersOntario 161 022 149 927Québec 77 480 69 674Canada 238 502 219 601Portugal 240 176 245 078Total 478 678 464 679