
Create successful ePaper yourself
Turn your PDF publications into a flip-book with our unique Google optimized e-Paper software.
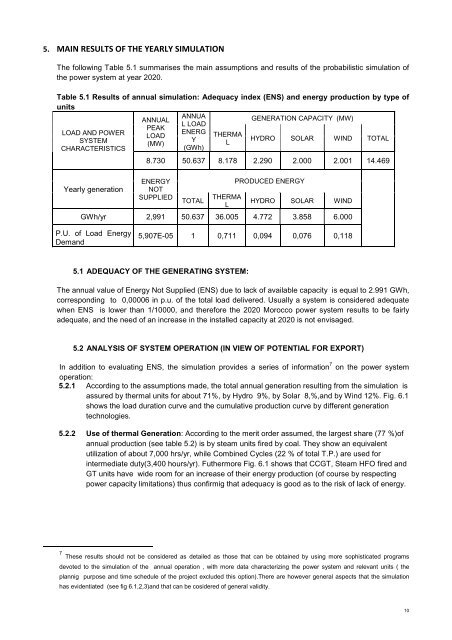
5. MAIN RESULTS OF THE YEARLY SIMULATIONThe following Table 5.1 summarises the main assumptions and results of the probabilistic simulation ofthe power system at year 2020.Table 5.1 Results of annual simulation: Adequacy index (ENS) and energy production by type ofunitsANNUAANNUALGENERATION CAPACITY (MW)L LOADPEAKLOAD AND POWERENERGLOADTHERMASYSTEMYHYDRO SOLAR WIND TOTAL(MW)LCHARACTERISTICS(GWh)Yearly generation8.730 50.637 8.178 2.290 2.000 2.001 14.469ENERGYNOTSUPPLIEDTOTALTHERMALPRODUCED ENERGYHYDRO SOLAR WINDGWh/yr 2,991 50.637 36.005 4.772 3.858 6.000P.U. of Load EnergyDemand5,907E-05 1 0,711 0,094 0,076 0,1185.1 ADEQUACY OF THE GENERATING SYSTEM:The annual value of Energy Not Supplied (ENS) due to lack of available capacity is equal to 2.991 GWh,corresponding to 0,00006 in p.u. of the total load delivered. Usually a system is considered adequatewhen ENS is lower than 1/10000, and therefore the 2020 Morocco power system results to be fairlyadequate, and the need of an increase in the installed capacity at 2020 is not envisaged.5.2 ANALYSIS OF SYSTEM OPERATION (IN VIEW OF POTENTIAL FOR EXPORT)In addition to evaluating ENS, the simulation provides a series of information 7 on the power systemoperation:5.2.1 According to the assumptions made, the total annual generation resulting from the simulation isassured by thermal units for about 71%, by Hydro 9%, by Solar 8,%,and by Wind 12%. Fig. 6.1shows the load duration curve and the cumulative production curve by different generationtechnologies.5.2.2 Use of thermal Generation: According to the merit order assumed, the largest share (77 %)ofannual production (see table 5.2) is by steam units fired by coal. They show an equivalentutilization of about 7,000 hrs/yr, while Combined Cycles (22 % of total T.P.) are used forintermediate duty(3,400 hours/yr). Futhermore Fig. 6.1 shows that CCGT, Steam HFO fired andGT units have wide room for an increase of their energy production (of course by respectingpower capacity limitations) thus confirmig that adequacy is good as to the risk of lack of energy.7 These results should not be considered as detailed as those that can be obtained by using more sophisticated programsdevoted to the simulation of the annual operation , with more data characterizing the power system and relevant units ( theplannig purpose and time schedule of the project excluded this option).There are however general aspects that the simulationhas evidentiated (see fig 6.1,2,3)and that can be cosidered of general validity.10