Financial Report (January 1, 2010 - December 31, 2010)
Financial Report (January 1, 2010 - December 31, 2010)
Financial Report (January 1, 2010 - December 31, 2010)

Create successful ePaper yourself
Turn your PDF publications into a flip-book with our unique Google optimized e-Paper software.
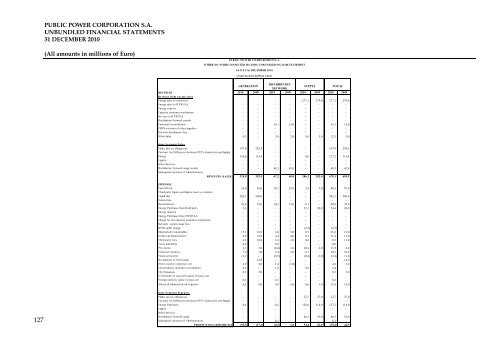
PUBLIC POWER CORPORATION S.A.UNBUNDLED FINANCIAL STATEMENTS<strong>31</strong> DECEMBER <strong>2010</strong>(All amounts in millions of Euro)PUBLIC PO WER CO RPO RATIO N S.A.O THER NO INTERCO NNECTED ISLANDS UNBUNDLED INCO ME STATEMENTAS OF <strong>31</strong>st DECEMBER <strong>2010</strong>(expressed in million euro)GENERATIONDISTRIBUTIONNETWORKSUPPLYTOTALREVENUES <strong>2010</strong> 2009 <strong>2010</strong> 2009 <strong>2010</strong> 2009 <strong>2010</strong> 2009Revenue from energy salesEnergy sales to customers - - - - 277,1 279,0 277,1 279,0Energy sales to HT SO S.A. - - - - - - - -Energy exports - - - - - - - -Capacity assurance mechanism - - - - - - - -Services t o HTSO S.A. - - - - - - - -Distribution Network rentals - - - - - - - -Customer's contribution - - 15,1 13,0 - - 15,1 13,0PSO'S revenues of other suppliers - - - - - - - -Network distribution fees - - - - - - - -Other Sales 0,3 - 3,8 2,0 8,4 3,0 12,5 5,0Inter-Segment SalesPublic Service obligations 197,9 238,5 - - - - 197,9 238,5Contract for Differences between PPC's Generation and Supply - - - - - - - -Energy 126,6 114,4 - - 0,6 - 127,2 114,4Lignite - - - - - - - -Other Services - - - - - - - -Distribution Network usage rentals - - 48,3 45,0 - - 48,3 45,0Managerial expenses of Administrators - - - - - - - -REVENUES (SALES) 324,8 352,9 67,2 60,0 286,1 282,0 678,1 694,9EXPENS ESPayroll Cost 54,0 65,0 24,1 29,0 2,4 3,0 80,5 97,0Third party lignite and lignite reserve variation - - - - - - - -Liquid fuel 282,1 206,0 - - - - 282,1 206,0Natural Gas - - - - - - - -Depreciations 26,4 23,0 14,3 12,0 0,1 - 40,8 35,0Energy Purchases from third party 2,3 - - - 22,1 20,0 24,4 20,0Energy imports - - - - - - - -Energy Purchases from HTSO S.A. - - - - - - - -Charge for the capacity assurance mechanism - - - - - - - -Network system usage fees - - - - - - - -HTSO uplift charge - - - - (2,5) - (2,5) -Materials & Consumables 17,1 16,0 3,8 5,0 0,7 - 21,6 21,0Utilities & Maintenance 6,9 13,0 4,4 4,0 0,1 - 11,4 17,0Thrid party fees 6,3 10,0 1,6 1,0 0,6 - 8,5 11,0T axes and duties 0,4 - 0,2 - - - 0,6 -Provisions 2,1 3,0 (0,6) 1,0 10,4 2,0 11,9 6,0<strong>Financial</strong> expenses 7,0 7,0 3,4 3,0 0,1 - 10,5 10,0<strong>Financial</strong> income (1,1) - (0,5) - (0,8) (1,0) (2,4) (1,0)Devaluation of fixed assets - 12,0 - - - - - 12,0Other income/ (expense), net 2,9 4,0 1,4 (1,0) - - 4,3 3,0Extraordinary insurance contribution 4,3 - 1,9 - 0,2 - 6,4 -CO 2 Emissions 0,3 2,0 - - - - 0,3 2,0Investments in associates gains/ (losses), net - - - - - - - -Foreign currency gains/ (losses), net 0,1 - 0,1 - - - 0,2 -Allocated Administration expenses 6,2 9,0 5,0 5,0 0,6 1,0 11,8 15,0127Inter-Segment ExpensesPublic service oblications - - - - 22,7 27,0 22,7 27,0Contract for Differences between PPC's Generation and Supply - - - - - - - -Energy Purchases 0,4 - 0,2 - 126,6 114,0 127,2 114,0Lignite - - - - - - - -Other Services - - - - - - - -Distribution Network usage - - - - 48,3 53,0 48,3 53,0Managerial expenses of Administrators - - 8,1 - - - 8,1 -PROFIT (LOSS) BEFORE TAX (93,5) (17,1) (0,3) 1,0 54,4 63,0 (39,4) 46,9