Urban Planning for City Leaders - Cities Alliance
Urban Planning for City Leaders - Cities Alliance
Urban Planning for City Leaders - Cities Alliance
Create successful ePaper yourself
Turn your PDF publications into a flip-book with our unique Google optimized e-Paper software.
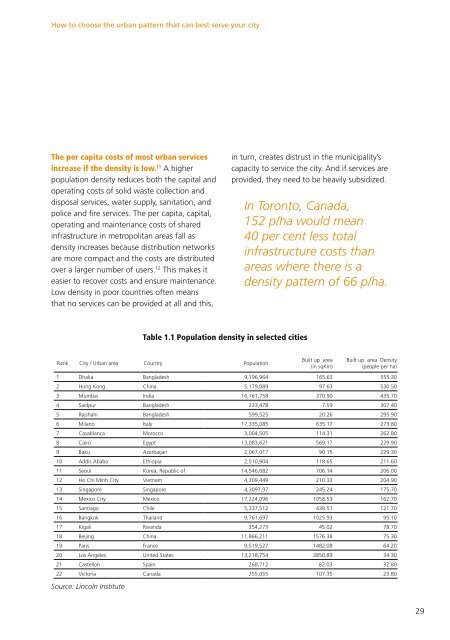
How to choose the urban pattern that can best serve your cityThe per capita costs of most urban servicesincrease if the density is low. 11 A higherpopulation density reduces both the capital andoperating costs of solid waste collection anddisposal services, water supply, sanitation, andpolice and fire services. The per capita, capital,operating and maintenance costs of sharedinfrastructure in metropolitan areas fall asdensity increases because distribution networksare more compact and the costs are distributedover a larger number of users. 12 This makes iteasier to recover costs and ensure maintenance.Low density in poor countries often meansthat no services can be provided at all and this,in turn, creates distrust in the municipality’scapacity to service the city. And if services areprovided, they need to be heavily subsidized.In Toronto, Canada,152 p/ha would mean40 per cent less totalinfrastructure costs thanareas where there is adensity pattern of 66 p/ha.Table 1.1 Population density in selected citiesRank <strong>City</strong> / <strong>Urban</strong> area Country PopulationBuilt up area(in sqKm)Built up area Density(people per ha)1 Dhaka Bangladesh 9,196,964 165.63 555.302 Hong Kong China 5,179,089 97.63 530.503 Mumbai India 16,161,758 370.90 435.704 Saidpur Bangladesh 233,478 7.59 307.405 Rajshahi Bangladesh 599,525 20.26 295.906 Milano Italy 17,335,085 635.17 273.807 Casablanca Morocco 3,004,505 114.31 262.808 Cairo Egypt 13,083,621 569.17 229.909 Baku Azerbaijan 2,067,017 90.15 229.3010 Addis Ababa Ethiopia 2,510,904 118.65 211.6011 Seoul Korea, Republic of 14,546,082 706.14 206.0012 Ho Chi Minh <strong>City</strong> Vietnam 4,309,449 210.33 204.9013 Singapore Singapore 4,3097,97 245.24 175.7014 Mexico <strong>City</strong> Mexico 17,224,096 1058.53 162.7015 Santiago Chile 5,337,512 438.51 121.7016 Bangkok Thailand 9,761,697 1025.93 95.1017 Kigali Rwanda 354,273 45.02 78.7018 Beijing China 11,866,211 1576.38 75.3019 Paris France 9,519,527 1482.08 64.2020 Los Angeles United States 13,218,754 3850.89 34.3021 Castellon Spain 268,712 82.03 32.8022 Victoria Canada 255,055 107.35 23.80Source: Lincoln Institute29


