Performance update for the half year ended 30 September 2009
Performance update for the half year ended 30 September 2009
Performance update for the half year ended 30 September 2009

You also want an ePaper? Increase the reach of your titles
YUMPU automatically turns print PDFs into web optimized ePapers that Google loves.
Dear Shareholder,<strong>Per<strong>for</strong>mance</strong> <strong>update</strong> <strong>for</strong> <strong>the</strong> <strong>half</strong> <strong>year</strong> <strong>ended</strong> <strong>30</strong>th <strong>September</strong>, <strong>2009</strong>I am pleased to in<strong>for</strong>m you that your Company continued to pursue distinct strategic objectives across its businesses, defined asindicated:• be a leader and role model in Financial Services with a broad based and integrated business;• building sustainable competitiveness while maintaining growth momentum in Telecom;• building a strong order book with a focus on non-voice segment in BPO;• capitalising on expanded retail space to achieve profitable growth in Garments and• capturing sector-growth and full potential in <strong>the</strong> manufacturing businesses.As a result, your company has achieved its highest ever <strong>half</strong>-<strong>year</strong>ly PBDIT at Rs. 748.8 Crores during <strong>the</strong> <strong>half</strong> <strong>year</strong> <strong>ended</strong><strong>September</strong> <strong>30</strong>, <strong>2009</strong> driven by streng<strong>the</strong>ned earnings across <strong>the</strong> businesses.Your Company’s consolidated net income from operations rose by 64% from Rs. 6,262.8 Crores to Rs. 10,252 Crores largely due tohigher investment income on policyholders’ funds. Consolidated PBDIT grew by 47% from Rs. 510.1 Crores to Rs. 748.8 Croresdriven by improved profitability in <strong>the</strong> BPO, Rayon and Carbon Black businesses coupled with reduced losses in <strong>the</strong> Life Insuranceand Garments businesses. As a result, consolidated net profit improved considerably even after absorbing higher depreciationconsequent to expansion in <strong>the</strong> Telecom business.Standalone PBDIT grew from Rs. 355.6 Crores to Rs. 362.3 Crores. However, standalone net profit de-grew from Rs. 106.9 Croresto Rs. 57 Crores due to higher interest costs. Interest costs increased due to higher debt level to fund capital expenditure requirementsin standalone businesses and capital infusion in <strong>the</strong> Life Insurance business.Equity infusion by <strong>the</strong> Promoters to streng<strong>the</strong>n <strong>the</strong> balance sheetYour Company issued and allotted 1.85 Crore warrants to <strong>the</strong> Promoter Group Companies on a preferential basis in June <strong>2009</strong> onreceipt of Rs. 250.3 Crores as 25% application money. The Promoter Group fur<strong>the</strong>r infused Rs. 324.71 Crores (being balance 75%amount payable) on conversion of 80 Lacs warrants into equity shares on <strong>30</strong> th October, <strong>2009</strong>. As a result, <strong>the</strong> paid up capital of yourCompany increased from Rs. 95.01 Crores to Rs. 103.01 Crores on allotment of 80 Lacs equity shares.Business – wise per<strong>for</strong>mance reviewLife Insurance [Birla Sun Life Insurance Company Limited (BSLI)]During <strong>the</strong> <strong>half</strong>-<strong>year</strong>, private players de-grew <strong>year</strong> on <strong>year</strong> (y-o-y) by 14% in terms of new business premium while BSLI containedde-growth to 6%. Its market share amongst private players increased from 8.2% to 8.9%. Total premium income grew by 15% toRs. 2,071.8 Crores led by 53% growth in renewal premium. Its assets under management (AUM) registered 78% y-o-y growth toreach Rs. 13575.3 Crores as on <strong>September</strong> <strong>30</strong>, <strong>2009</strong>. Net loss reduced from Rs. 346.8 Crores to Rs. 238.4 Crores, aided by higherprofitability arising out of in-<strong>for</strong>ce business. A sum of Rs. 175 Crores was infused during <strong>the</strong> <strong>half</strong> <strong>year</strong>, taking total capital toRs. 2,174.5 Crores. Your Company invested Rs. 129.5 Crores <strong>for</strong> its 74% share. The embedded value of BSLI is measured atRs. 3,060.1 Crores as at March 31, <strong>2009</strong>. The VNB margins, a measure used <strong>for</strong> gauging profitability of new business stood at20.3% <strong>for</strong> FY 2008-09. EV reflects <strong>the</strong> value of future profits embedded in <strong>the</strong> in-<strong>for</strong>ce policies written by <strong>the</strong> life insurancecompany.Asset Management [Birla Sun Life Asset Management Company Limited (BSAMC)]BSAMC registered 68% y-o-y growth in average domestic AUM as on <strong>September</strong> <strong>30</strong>, <strong>2009</strong> while industry grew by 41%. Its marketshare increased from 7.1% to 8.5%. Average domestic equity AUM doubled since March <strong>2009</strong>, registering highest growth rate in thiscategory among top 5 players. This was driven by strong fund per<strong>for</strong>mance that got recognised in India as well as abroad. One of itsequity funds ‘Birla Sun Life Tax Relief ‘96’ has been adjudged ‘World’s Best-Per<strong>for</strong>ming Equity Fund’ <strong>for</strong> <strong>the</strong> 13-<strong>year</strong> period <strong>ended</strong> <strong>30</strong><strong>September</strong> <strong>2009</strong>, according to Lipper global data. During <strong>the</strong> <strong>half</strong> <strong>year</strong>, revenues rose from Rs. 84.9 Crores to Rs. 116.6 Crores andnet profit from Rs. 9.6 Crores to Rs. 14.1 Crores.O<strong>the</strong>r Financial ServicesApollo Sindhoori Capital Investments, <strong>the</strong> retail broking company has been rebranded as Aditya Birla Money Ltd. ‘Aditya BirlaPrivate Equity - Fund I’, has received commitments in excess of Rs. 500 Crores. It will shortly announce <strong>the</strong> first close <strong>for</strong>subscription to this fund in India.1
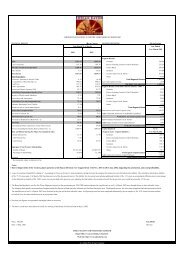
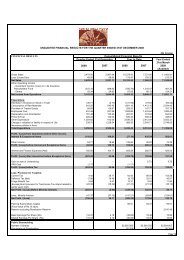
FINANCIAL RESULTS FOR THE QUARTER AND THE HALF YEAR ENDED <strong>30</strong>TH SEPTEMBER, <strong>2009</strong>(Rs. Crores)Consolidated Financial ResultsStandalone Financial ResultsQuarter <strong>ended</strong> Half Year <strong>ended</strong> Year <strong>ended</strong> Quarter <strong>ended</strong> Half Year <strong>ended</strong> Year <strong>ended</strong><strong>30</strong>th <strong>September</strong> <strong>30</strong>th <strong>September</strong> 31st March FINANCIAL RESULTS <strong>30</strong>th <strong>September</strong> <strong>30</strong>th <strong>September</strong> 31st March<strong>2009</strong> 2008 <strong>2009</strong> 2008 <strong>2009</strong> <strong>2009</strong> 2008 <strong>2009</strong> 2008 <strong>2009</strong>(Audited)(Audited)3,662.2 3,575.8 6,876.5 6,674.5 14,202.1 Net Sales 1,198.4 1,310.6 2,164.2 2,362.4 4,687.6O<strong>the</strong>r Operating Income- Investment Income /(Loss) on1,188.6 5.7 3,310.0 (470.7) (670.7) Life Insurance Policyholders’ Fund - - - - -31.9 28.1 65.5 59.0 113.4 - O<strong>the</strong>rs 29.5 26.0 60.5 53.2 98.64,882.6 3,609.6 10,252.0 6,262.8 13,644.8 Net Income from Operations 1,227.9 1,336.6 2,224.8 2,415.6 4,786.2Expenditure:14.4 (48.9) 35.2 (85.8) (48.7) Decrease / (Increase) in Stock in Trade 7.6 (39.0) 22.4 (59.8) (21.7)555.4 680.1 1,033.1 1,251.9 2,444.1 Consumption of Raw Materials 536.0 650.3 995.0 1,193.1 2,322.050.2 77.8 92.4 1<strong>30</strong>.6 261.6 Purchase of Traded Goods 43.6 79.5 80.3 122.3 242.7567.4 640.0 1,129.8 1,220.5 2,403.1 Employees Cost 79.0 78.3 158.4 147.7 294.4212.6 160.4 415.3 316.5 695.6 Depreciation and Amortisation 44.9 40.5 89.1 79.3 166.0180.2 202.8 336.7 3<strong>30</strong>.0 701.6 Power & Fuel 112.1 166.5 201.0 261.8 537.41,341.3 1,205.1 2,558.5 2,271.3 5,062.5 O<strong>the</strong>r Expenditure 235.8 213.3 442.8 415.7 857.71,8<strong>30</strong>.9 681.1 4,455.1 729.8 2,215.3 Change in valuation of liability in respect of Life - - - - -Insurance policies in <strong>for</strong>ce4,752.5 3,598.4 10,056.0 6,164.8 13,735.0 Total Expenditure 1,059.0 1,189.4 1,989.0 2,160.1 4,398.5Profit / (Loss) from Operations be<strong>for</strong>e1<strong>30</strong>.1 11.1 196.0 98.0 (90.2) O<strong>the</strong>r Income, Interest & Exceptional Items 168.9 147.3 235.7 255.6 387.770.3 60.2 137.5 95.6 264.2 O<strong>the</strong>r Income 21.2 13.7 37.4 20.8 65.3Profit / (Loss) be<strong>for</strong>e Interest and200.4 71.3 333.5 193.6 174.0 Exceptional Items 190.2 160.9 273.2 276.4 453.0166.9 178.6 356.7 323.0 721.0 Interest and Finance Expenses 86.1 59.3 180.8 110.3 290.6Profit / (Loss) after Interest but33.5 (107.3) (23.2) (129.4) (547.0) be<strong>for</strong>e Exceptional Items 104.1 101.6 92.3 166.1 162.3- - - - (2.2) Gain / (Loss) on sale of Subsidiary and VRS Cost - - - - -33.5 (107.3) (23.2) (129.4) (549.3) Profit / (Loss) be<strong>for</strong>e Tax 104.1 101.6 92.3 166.1 162.365.5 51.4 76.2 96.7 116.9 Tax Expenses 44.8 36.3 39.6 59.1 60.0- (0.0) (4.2) 0.7 (35.8) Provision <strong>for</strong> Tax <strong>for</strong> earlier <strong>year</strong>s written back (net) - - (4.2) - (35.1)(32.0) (158.8) (95.1) (226.8) (6<strong>30</strong>.3) Net Profit / (Loss) (Be<strong>for</strong>e Minority Interest) 59.2 65.3 57.0 106.9 137.4(33.4) (54.2) (61.3) (93.8) (194.6) Less : Minority Interest - - - - -1.4 (104.6) (33.8) (132.9) (435.7) Net Profit / (Loss) 59.2 65.3 57.0 106.9 137.495.01 95.01 95.01 Paid Up Equity Share Capital 95.01 95.01 95.01(Face Value of Rs.10 each)5,244.3 Reserves excluding Revaluation Reserve 3,649.20.15 (11.06) (3.56) (14.21) (46.28) Basic Earnings Per Share (Rs) 6.24 6.87 6.00 11.26 14.460.14 (11.06) (3.56) (14.21) (46.28) Diluted Earnings Per Share (Rs) 5.85 6.87 5.79 11.25 14.46Aggregate of Public Shareholding52,287,170 53,520,574 52,286,778 Number of Shares 52,287,170 53,520,574 52,286,77855.0% 56.3% 55.0% Percentage of Shareholding 55.0% 56.3% 55.0%Notes:1 The Paid up Capital of <strong>the</strong> Company has increased to Rs. 103.01 crores from Rs. 95.01 crores on allotment of 80 Lacs equity shares on <strong>30</strong>th October, <strong>2009</strong>. The Promoter Grouphas infused Rs. 324.71 crores (being balance 75% amount payable) <strong>for</strong> conversion of 80 Lacs warrants into equity shares in accordance with SEBI Guidelines out of 1.85 crorewarrants.2 Board of Directors of <strong>the</strong> Company, at its meeting held on <strong>30</strong>th October, <strong>2009</strong>, have approved subject to necessary approvals, amalgamation of Madura Garments Exports Limitedand MG Lifestyle Clothing Company Private Limited and demerger of certain business of Peter England Fashions and Retail Company Limited, wholly owned subsidiaries with <strong>the</strong>Company through a composite Scheme of Arrangement u/s 391-394 of <strong>the</strong> Companies Act, 1956. The Appointed Date <strong>for</strong> <strong>the</strong> above Scheme of Arrangement shall be 1st January,2010.3 a) On receipt of requisite approvals during <strong>the</strong> quarter <strong>ended</strong> <strong>30</strong>th <strong>September</strong> <strong>2009</strong>, <strong>the</strong> financial restructuring scheme and <strong>the</strong> scheme of arrangement pertaining to <strong>the</strong> de-mergerof passive infrastructure in specified circles of Idea Cellular Limited (IDEA) , a Joint Venture company have become effective with effect from <strong>the</strong> appointed date i.e. July 01,2008 and January 01, <strong>2009</strong> respectively. Accordingly FY 2008-09 consolidated results of IDEA as well as <strong>the</strong> Company’s share in it have been substituted in <strong>the</strong> Company’sAudited consolidated results to give effects <strong>the</strong>reof. As a result <strong>the</strong> Consolidated Net Loss has been increased by Rs 5.21 Crores, Capital Employed and Reserves has beendecreased by Rs 153.34 Crores and Rs 152.17 Crores respectively.b) A Scheme of Arrangement to de-merge <strong>the</strong> Unified Access Services License (UASL) of Bihar (including Jharkhand) Service Area and certain o<strong>the</strong>r assets and liabilities of AdityaBirla Telecom Ltd (a wholly owned subsidiary of IDEA) and merge <strong>the</strong>m into IDEA with an appointed date of 1st April <strong>2009</strong> have been filed with <strong>the</strong> High Courts of Gujaratand Mumbai during <strong>the</strong> quarter <strong>ended</strong> <strong>30</strong>th <strong>September</strong> <strong>2009</strong>. Pending approval of <strong>the</strong> scheme, no effect has been given in <strong>the</strong>se results.c) The Shareholders and Creditors have given <strong>the</strong>ir approval to <strong>the</strong> scheme of amalgamation of Spice Communications Limited (Spice) with IDEA vide court convened meetingsheld on <strong>September</strong> 04, <strong>2009</strong>, following which <strong>the</strong> Hon’ble High Court of Gujarat and <strong>the</strong> Hon’ble High Court of Delhi have now fixed dates <strong>for</strong> final hearing in October <strong>2009</strong>and December <strong>2009</strong> respectively. IDEA currently holds 41.09% in Spice. The appointed date of <strong>the</strong> scheme will be <strong>the</strong> effective date.2
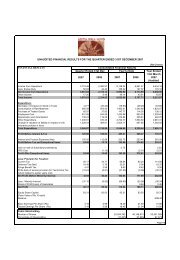
SEGMENTAL REPORTING FOR THE QUARTER AND THE HALF YEAR ENDED <strong>30</strong>TH SEPTEMBER, <strong>2009</strong>3(Rs. Crores)Consolidated Financial ResultsStandalone Financial ResultsQuarter <strong>ended</strong> Half Year <strong>ended</strong> Year <strong>ended</strong> Quarter <strong>ended</strong> Half Year <strong>ended</strong> Year <strong>ended</strong><strong>30</strong>th <strong>September</strong> <strong>30</strong>th <strong>September</strong> 31st March SEGMENT REPORTING <strong>30</strong>th <strong>September</strong> <strong>30</strong>th <strong>September</strong> 31st March<strong>2009</strong> 2008 <strong>2009</strong> 2008 <strong>2009</strong> <strong>2009</strong> 2008 <strong>2009</strong> 2008 <strong>2009</strong>(Audited)(Audited)Segment Revenue341.6 325.0 596.7 550.0 1,115.8 Garments 296.7 283.1 506.6 461.4 906.4134.4 139.9 274.5 274.2 537.1 Rayon Yarn (Including Caustic & Allied Chemicals) 134.4 139.9 274.5 274.2 537.1286.7 338.0 532.4 635.6 1,095.6 Carbon Black 286.7 338.0 532.4 635.6 1,095.691.0 105.9 169.4 196.7 424.8 Insulators 91.0 105.9 169.4 196.7 424.8138.0 149.3 269.2 298.0 573.2 O<strong>the</strong>r Textiles (Spun Yarn & Fabrics) 138.0 149.3 269.2 298.0 573.2281.2 320.2 472.6 549.5 1,249.8 Fertilisers 281.2 320.2 472.6 549.5 1,249.897.3 69.4 181.9 133.0 249.6 Financial Services - 0.3 - 0.3 0.31,142.5 1,009.1 2,071.8 1,805.5 4,414.3 Life Insurance -Premium Income (Shown in Net Sales) - - - - -1,188.6 5.7 3,310.0 (470.7) (670.7) - Investment Income /(Loss) on Policyholders’ Fund - - - - -387.0 477.8 779.2 933.9 1,777.2 BPO & IT - - - - -801.9 672.4 1,605.6 1,363.1 2,891.8 Telecom - - - - -4,890.2 3,612.5 10,263.3 6,268.8 13,658.6 Total Segmental Revenue 1,228.0 1,336.5 2,224.7 2,415.7 4,787.3(7.5) (3.0) (11.3) (5.9) (13.8) Less: Inter Segment Revenue (0.0) 0.1 0.0 (0.1) (1.1)4,882.6 3,609.6 10,252.0 6,262.8 13,644.8 Net Income from Operations 1,227.9 1,336.6 2,224.8 2,415.6 4,786.2Segment Results (Profit be<strong>for</strong>eInterest and Tax)(12.2) (<strong>30</strong>.5) (57.3) (87.3) (227.4) Garments 5.1 14.9 (18.1) (8.9) (48.5)32.8 18.7 71.3 48.1 89.8 Rayon Yarn (Including Caustic & Allied Chemicals) 32.8 18.7 71.3 48.1 89.878.2 23.3 103.2 64.8 24.7 Carbon Black 78.2 23.3 103.2 64.8 24.717.2 28.5 34.2 53.3 108.2 Insulators 17.2 28.5 34.2 53.3 108.29.9 12.6 14.4 23.7 32.7 O<strong>the</strong>r Textiles (Spun Yarn & Fabrics) 9.9 12.6 14.4 23.7 32.733.5 56.7 44.9 89.7 209.7 Fertilisers 33.5 56.7 44.9 89.7 209.715.5 16.1 32.3 39.0 47.3 Financial Services - (2.9) - (3.7) (8.5)(124.9) (194.3) (233.3) (338.6) (686.6) Life Insurance - - - - -9.7 (8.4) 16.9 (14.7) (63.6) BPO & IT - - - - -102.2 102.8 224.6 249.7 475.0 Telecom - - - - -161.9 25.5 251.1 127.6 10.0 Total Segment Result 176.7 151.8 249.8 267.0 408.1(144.7) (153.8) (311.6) (278.1) (636.8) Less: Interest & Finance Expenses (86.1) (59.1) (180.8) (110.1) (290.4)16.4 20.9 37.3 21.1 79.7 Add: Net of Unallocable Income/(Expenditure) 13.5 8.9 23.3 9.2 44.633.5 (107.3) (23.2) (129.4) (547.0) Profit / (Loss) Be<strong>for</strong>e Tax and Exceptional Items 104.1 101.6 92.3 166.1 162.3- - - - (2.2) Gain / (Loss) on sale of Subsidiary and VRS Cost - - - - -33.5 (107.3) (23.2) (129.4) (549.3) Profit / (Loss) be<strong>for</strong>e tax 104.1 101.6 92.3 166.1 162.3As on <strong>30</strong>th As on <strong>30</strong>th As on 31st Capital Employed As on <strong>30</strong>th As on <strong>30</strong>th As on 31st<strong>September</strong> <strong>September</strong> March (Segment Assets - Segment Liabilities) <strong>September</strong> <strong>September</strong> March<strong>2009</strong> 2008 <strong>2009</strong> <strong>2009</strong> 2008 <strong>2009</strong>592.6 846.0 678.8 Garments 334.5 552.8 411.6423.4 441.2 436.9 Rayon Yarn (Including Caustic & Allied Chemicals) 423.4 441.2 436.9797.8 974.4 753.1 Carbon Black 797.8 974.4 753.1270.4 238.7 264.3 Insulators 270.4 238.7 264.3<strong>30</strong>2.5 424.1 345.1 O<strong>the</strong>r Textiles (Spun Yarn & Fabrics) <strong>30</strong>2.5 424.1 345.1414.6 382.8 586.6 Fertilisers 414.6 382.8 586.6481.5 331.3 331.6 Financial Services - 13.0 (0.3)344.2 388.0 407.5 Life Insurance - - -952.2 1,090.0 963.6 BPO & IT - - -5,717.2 5,736.7 6,022.1 Telecom - - -10,296.2 10,853.3 10,789.6 Total Segment Capital Employed 2,543.2 3,026.9 2,797.42,665.3 2,099.3 3,142.5 Add: Unallocated Corporate Assets 5,598.2 4,380.3 5,724.112,961.5 12,952.6 13,932.1 Total Capital Employed 8,141.3 7,407.2 8,521.5Notes:d) The scheme of arrangement <strong>for</strong> de-merging <strong>the</strong> UASL licenses of Punjab and Karnataka in IDEA is currently pending be<strong>for</strong>e <strong>the</strong> High Court of Gujarat.e) O<strong>the</strong>r Income in Consolidated Financial Results includes Rs 8.56 Crores being <strong>the</strong> Company’s share of surplus on prepayment of loan by IDEA.4 Figures pertaining to Consolidated Financial Results <strong>for</strong> <strong>the</strong> quarter and <strong>the</strong> <strong>half</strong> <strong>year</strong> <strong>ended</strong> <strong>30</strong>th <strong>September</strong> <strong>2009</strong> are not comparable with that of <strong>the</strong> corresponding previousperiods since <strong>the</strong>re has been acquisitions/disposals/stake changes/mergers/de-mergers in subsidiaries and joint ventures of <strong>the</strong> Company.5 Status of Investor Complaints <strong>for</strong> <strong>the</strong> quarter <strong>ended</strong> <strong>September</strong> <strong>30</strong>, <strong>2009</strong>Opening Received Redressed Pending0 12 12 06 Previous <strong>year</strong>’s / period’s figures are regrouped / rearranged wherever necessary.7 The above results have been reviewed by <strong>the</strong> Audit Committee of <strong>the</strong> Board and taken on record at <strong>the</strong> meeting of <strong>the</strong> Board of Directors held on October <strong>30</strong>, <strong>2009</strong>. The StatutoryAuditors of <strong>the</strong> Company have carried out Limited Review of <strong>the</strong> Unaudited Standalone and Consolidated Financial Results as required under Clause 41 of Listing Agreement and<strong>the</strong> related report will be submitted to <strong>the</strong> concerned stock exchanges.
Telecom [Idea Cellular Limited (Idea)]Idea expanded its footprint to 20 services areas with roll out in five new service areas during <strong>the</strong> <strong>half</strong> <strong>year</strong>. With <strong>the</strong> planned launchin remaining two services areas, Idea will become a pan India player. Idea has added <strong>half</strong> of its existing subscriber base in just past oneand a <strong>half</strong> <strong>year</strong> amidst hyper competitive market conditions. Idea ranked 5 th with an all India market share at 10.9% serving 51.45million subscribers as on <strong>September</strong> <strong>30</strong>, <strong>2009</strong>. In 9 operating circles where it holds 900 MHz spectrum, Idea ranks 2 nd with 18.2%market share. Idea posted 33% rise in revenues at Rs. 5,943.1 Crores. Cash profits grew by 48% to Rs. 1,508.3 Crores. Net profitgrew by 27% to Rs. 517.2 Crores. The net debt-equity ratio stood at 0.35 as on <strong>September</strong> <strong>30</strong>, <strong>2009</strong>. Strong balance sheet, internalcash generation and leveraging capacity will cushion financing of capital expenditure requirements as well as bidding <strong>for</strong> <strong>the</strong> 3Gspectrum auction.BPO & IT [Aditya Birla Minacs Worldwide Limited & Aditya Birla Minacs IT Services Limited]Aditya Birla Minacs, <strong>the</strong> BPO subsidiary, bagged deals worth over USD 500 million (Total Contract Value) in <strong>the</strong> first <strong>half</strong> ofFY<strong>2009</strong>-10 itself. This includes USD 125 million (TCV) deal with Idea Cellular - a step ahead towards leveraging Aditya BirlaGroup’s ecosystem. Besides it has built a strong sales pipeline of around USD 1 billion (TCV). Net loss has been reduced considerablyfrom Rs. 49.5 Crores to Rs. 17.1 Crores, driven by site rationalisation and cash conservation ef<strong>for</strong>ts. However, revenues de-grew fromRs. 884 Crores to Rs. 745.1 Crores due to lower business from few of <strong>the</strong> existing clients suffering slowdown. Benefit of recently wonUSD 500 million deals will accrue largely in later <strong>half</strong> of FY <strong>2009</strong>-10 and onwards.Aditya Birla Minacs IT Services Limited reported revenues at Rs. 42.8 Crores and net profit at Rs. 4 Crores vis-à-vis revenuesRs. 51.1 Crores and net profit of Rs. 1.5 Crores attained in <strong>the</strong> corresponding period of <strong>the</strong> last <strong>year</strong>.Garments [Madura Garments]Revenues grew by 8% from Rs. 550 Crores to Rs. 596.7 Crores. Driven by rent negotiation, overheads reduction and manpowerrationalisation measures, loss be<strong>for</strong>e interest and taxes has reduced considerably from Rs. 87.3 Crores to Rs. 57.3 Crores. Thebusiness is focusing on capitalising expanded retail space to achieve profitable growth besides improving retail productivity <strong>for</strong> highersell through and controlling overheads to regain profitability.Manufacturing businesses (Carbon Black, Fertilisers, Rayon, Textiles and Insulators)Combined revenues de-grew from Rs. 1,954 Crores to Rs. 1,718.1 Crores. This was largely because peak commodity prices prevailingduring first <strong>half</strong> of <strong>the</strong> previous financial <strong>year</strong> were reflected in higher realisation last <strong>year</strong> in <strong>the</strong> Fertilisers, Carbon Black and Textilesbusinesses. Combined PBIT was maintained at Rs. 268 Crores. This was despite lower profitability in fertilisers business due tomaintenance shutdown in <strong>the</strong> current <strong>year</strong> and receipt of Rs. 24 Crores subsidy arrear in <strong>the</strong> previous <strong>year</strong>. Carbon Black and Rayonbusinesses posted considerable rise in profits supported by consumption of low cost CBFS and higher VFY realisation respectively. In<strong>the</strong> Insulators business, profitability remained under pressure due to lower domestic realisation caused by increased competition.Textiles business was impacted by usage of high priced stock during first quarter of <strong>the</strong> current financial <strong>year</strong> due to sudden fall ininput prices.Aditya Birla Insulators has expanded capacity by 10,000 MT at Rishra plant. It has gone on stream recently and full capacityutilisation is expected in <strong>the</strong> coming quarters. The 75,000 MTPA capacity expansion in Carbon Black business at Patalganga istargeted <strong>for</strong> completion by March 2010 to tap <strong>the</strong> robust demand.Your Company is well positioned to emerge stronger with <strong>the</strong> continuous pursuit of strategic initiatives and is looking beyondimmediate challenges. It is moving closer to achieving ‘path to profitability’ in <strong>the</strong> ‘Growth’ businesses. The investments made,specifically in <strong>the</strong> Financial Services, BPO and Garments businesses, are geared towards building businesses with long term goalswhile creating value <strong>for</strong> <strong>the</strong> shareholdersA detailed presentation is available on your Company’s website in <strong>the</strong> ‘Investors’ section. Should you require a copy of <strong>the</strong> same,please email us at nuvo-investors@adityabirla.com / abnlsecretarial@adityabirla.comYours sincerely,Sushil AgarwalChief Financial OfficerMumbai, 17 th November <strong>2009</strong>Aditya Birla Nuvo LimitedRegd. Office: Indian Rayon Compound, Veraval – 362 266, Gujarat, IndiaCorporate Office: 4 th Floor ‘A’ Wing, Aditya Birla Centre, S.K. Ahire Marg, Worli, Mumbai – 400 0<strong>30</strong>Website: www.adityabirlanuvo.com / www.adityabirla.com4