Q3 results - Aditya Birla Nuvo, Ltd
Q3 results - Aditya Birla Nuvo, Ltd
Q3 results - Aditya Birla Nuvo, Ltd

Create successful ePaper yourself
Turn your PDF publications into a flip-book with our unique Google optimized e-Paper software.
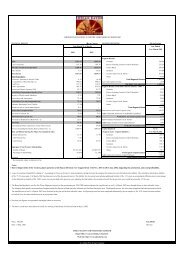
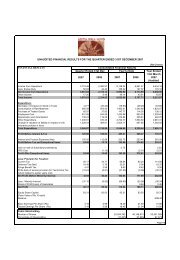
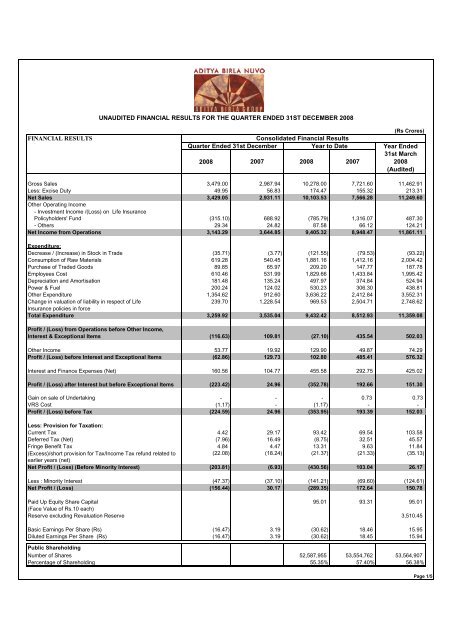
UNAUDITED FINANCIAL RESULTS FOR THE QUARTER ENDED 31ST DECEMBER 2008FINANCIAL RESULTS(Rs Crores)Consolidated Financial ResultsQuarter Ended 31st DecemberYear to DateYear Ended31st March2008 2007 2008 2007 2008(Audited)Gross Sales 3,479.00 2,987.94 10,278.00 7,721.60 11,462.91Less: Excise Duty 49.95 56.83 174.47 155.32 213.31Net Sales 3,429.05 2,931.11 10,103.53 7,566.28 11,249.60Other Operating Income- Investment Income /(Loss) on Life InsurancePolicyholders' Fund (315.10) 688.92 (785.79) 1,316.07 487.30- Others 29.34 24.82 87.58 66.12 124.21Net Income from Operations 3,143.29 3,644.85 9,405.32 8,948.47 11,861.11Expenditure:Decrease / (Increase) in Stock in Trade (35.71) (3.77) (121.55) (79.53) (93.22)Consumption of Raw Materials 619.28 540.45 1,881.16 1,412.16 2,004.42Purchase of Traded Goods 89.85 65.97 209.20 147.77 187.78Employees Cost 610.46 531.99 1,829.66 1,433.84 1,995.42Depreciation and Amortisation 181.48 135.24 497.97 374.84 524.94Power & Fuel 200.24 124.02 530.23 306.30 438.81Other Expenditure 1,354.62 912.60 3,636.22 2,412.84 3,552.31Change in valuation of liability in respect of Life 239.70 1,228.54 969.53 2,504.71 2,748.62Insurance policies in forceTotal Expenditure 3,259.92 3,535.04 9,432.42 8,512.93 11,359.08Profit / (Loss) from Operations before Other Income,Interest & Exceptional Items (116.63) 109.81 (27.10) 435.54 502.03Other Income 53.77 19.92 129.90 49.87 74.29Profit / (Loss) before Interest and Exceptional Items (62.86) 129.73 102.80 485.41 576.32Interest and Finance Expenses (Net) 160.56 104.77 455.58 292.75 425.02Profit / (Loss) after Interest but before Exceptional Items (223.42) 24.96 (352.78) 192.66 151.30Gain on sale of Undertaking - - - 0.73 0.73VRS Cost (1.17) - (1.17) - -Profit / (Loss) before Tax (224.59) 24.96 (353.95) 193.39 152.03Less: Provision for Taxation:Current Tax 4.42 29.17 93.42 69.54 103.58Deferred Tax (Net) (7.96) 16.49 (8.75) 32.51 45.57Fringe Benefit Tax 4.84 4.47 13.31 9.63 11.84(Excess)/short provision for Tax/Income Tax refund related to(22.08) (18.24) (21.37) (21.33) (35.13)earlier years (net)Net Profit / (Loss) (Before Minority Interest) (203.81) (6.93) (430.56) 103.04 26.17Less : Minority Interest (47.37) (37.10) (141.21) (69.60) (124.61)Net Profit / (Loss) (156.44) 30.17 (289.35) 172.64 150.78Paid Up Equity Share Capital 95.01 93.31 95.01(Face Value of Rs.10 each)Reserve excluding Revaluation Reserve 3,510.45Basic Earnings Per Share (Rs) (16.47) 3.19 (30.62) 18.46 15.95Diluted Earnings Per Share (Rs) (16.47) 3.19 (30.62) 18.45 15.94Public ShareholdingNumber of Shares 52,587,955 53,554,762 53,564,907Percentage of Shareholding 55.35% 57.40% 56.38%Page 1/5
Contd. from Page 1SEGMENT REPORTINGUNAUDITED FINANCIAL RESULTS FOR THE QUARTER ENDED 31ST DECEMBER 2008Consolidated Financial ResultsQuarter Ended 31st DecemberYear to Date(Rs Crores)Year Ended31st March2008 2007 2008 2007 2008(Audited)Segment RevenueGarments 293.26 278.83 842.52 749.55 1,025.84Rayon Yarn (Including Caustic & Allied Chemicals) 125.81 119.96 400.01 348.18 475.96Carbon Black 221.93 245.33 857.54 596.76 863.84Insulators 112.84 98.17 309.50 283.57 398.86Other Textiles (Spun Yarn & Fabrics) 139.93 149.91 437.96 446.61 600.35Fertilizers 362.55 263.46 912.01 518.25 787.46Financial Services 58.66 53.92 191.62 131.63 197.46Life Insurance - Premium Income (Shown in Gross Sales) 972.86 778.76 2,778.34 1,832.10 3,223.07-Investment Income /(Loss) on Policyholders' Fund (315.10) 688.92 (785.79) 1,316.07 487.30Software 22.33 25.64 73.38 74.31 101.09BPO 416.02 403.08 1,300.05 1,149.22 1,577.65Telecom 737.16 542.83 2,100.24 1,508.80 2,135.63Total Segmental Revenue 3,148.25 3,648.81 9,417.38 8,955.05 11,874.51Less: Inter Segment Revenue (4.96) (3.96) (12.06) (6.58) (13.40)Net Income from Operations 3,143.29 3,644.85 9,405.32 8,948.47 11,861.11Segment Results (Profit beforeInterest and Tax - PBIT)Garments (57.83) 5.16 (145.20) 4.45 0.01Rayon Yarn (Including Caustic & Allied Chemicals) 12.98 19.27 61.10 66.08 91.52Carbon Black (26.34) 37.42 38.45 99.41 130.32Insulators 25.21 31.89 78.55 85.16 122.53Other Textiles (Spun Yarn & Fabrics) 4.91 11.89 28.58 37.35 48.69Fertilizers 43.23 29.23 132.93 53.35 84.45Financial Services 7.19 9.86 46.23 26.77 44.35Life Insurance (161.05) (122.49) (499.67) (237.10) (437.68)Software (4.71) 1.60 (0.83) 3.55 6.45BPO (24.65) (23.39) (43.27) (17.75) (26.48)Telecom 105.38 119.89 355.07 338.21 476.34Total Segment Result (75.68) 120.33 51.94 459.48 540.50Less: Interest & Finance Expenses (Net) (144.42) (90.05) (399.63) (254.36) (367.01)Add: Net of Unallocable Income/(Expenditure) (3.32) (5.32) (5.09) (12.46) (22.19)Profit / (Loss) Before Tax and Exceptional Items (223.42) 24.96 (352.78) 192.66 151.30Gain on sale of Undertaking - - - 0.73 0.73VRS Cost (1.17) - (1.17) - -Profit / (Loss) After Exceptional Items (224.59) 24.96 (353.95) 193.39 152.03Capital Employed As on As on As on(Segment Assets - Segment Liabilities) 31st Dec 08 31st Dec 07 31st March 08Garments 791.36 663.81 746.06Rayon Yarn (Including Caustic & Allied Chemicals) 439.55 430.38 453.69Carbon Black 887.05 563.54 667.54Insulators 268.89 222.87 239.96Other Textiles (Spun Yarn & Fabrics) 399.38 362.96 359.33Fertilizers 444.86 359.12 531.27Financial Services 311.41 289.87 306.98Life Insurance 397.09 312.21 384.64Software 19.78 26.26 31.62BPO 895.31 924.28 1,005.59Telecom 6,600.24 2,732.39 3,218.11Total Segment Capital Employed 11,454.92 6,887.69 7,944.79Add: Unallocated Corporate Assets 2,267.56 2,092.37 2,139.86Total Capital Employed 13,722.48 8,980.06 10,084.65Page 2/5
Contd. from Page 2UNAUDITED FINANCIAL RESULTS FOR THE QUARTER ENDED 31ST DECEMBER 2008FINANCIAL RESULTS(Rs Crores)Standalone Financial ResultsQuarter Ended 31st DecemberYear to DateYear Ended31st March2008 2007 2008 2007 2008(Audited)Gross Sales 1,222.41 1,132.24 3,709.35 2,895.30 4,055.62Less: Excise Duty 49.95 56.83 174.47 155.32 213.31Net Sales 1,172.46 1,075.41 3,534.88 2,739.98 3,842.31Other Operating Income 24.18 22.22 77.39 59.17 110.75Net Income from Operations 1,196.64 1,097.63 3,612.27 2,799.15 3,953.06Expenditure:Decrease / (Increase) in Stock in Trade (35.94) (6.53) (95.71) (78.07) (83.68)Consumption of Raw Materials 596.25 500.82 1,789.31 1,306.12 1,874.02Purchase of Traded Goods 82.38 65.97 204.70 147.75 187.76Employees Cost 79.20 67.77 225.61 194.57 258.20Depreciation and Amortisation 42.05 37.12 121.30 103.35 141.10Power & Fuel 162.13 102.29 423.98 250.18 357.01Other Expenditure 226.14 196.84 643.10 534.33 738.54Total Expenditure 1,152.21 964.28 3,312.29 2,458.23 3,472.95Profit from Operations before Other Income, Interest &Exceptional Items 44.43 133.35 299.98 340.92 480.11Other Income 3.02 1.74 12.20 9.70 12.74Profit before Interest and Exceptional Items 47.45 135.09 312.18 350.62 492.85Interest and Finance Expenses (Net) 72.75 37.94 171.42 128.81 179.02Profit / (Loss) after Interest but before Exceptional Items (25.30) 97.15 140.76 221.81 313.83Gain on sale of Undertaking - - - 0.73 0.73Profit / (Loss) before Tax (25.30) 97.15 140.76 222.54 314.56Less: Provision for Taxation:Current Tax (1.01) 20.82 67.60 50.19 78.14Deferred Tax (Net) (7.35) 9.44 (18.99) 18.23 25.24Fringe Benefit Tax 1.01 1.12 3.16 2.87 3.86(Excess)/short provision for Tax/Income Tax refund related to(22.06) (18.24) (22.06) (21.34) (35.75)earlier years (net)Net Profit 4.11 84.01 111.05 172.59 243.07Paid Up Equity Share Capital 95.01 93.31 95.01(Face Value of Rs.10 each)Reserve excluding Revaluation Reserve 3,551.32Basic Earnings Per Share (Rs) 0.43 9.00 11.69 18.50 26.05Diluted Earnings Per Share (Rs) 0.43 9.00 11.68 18.49 26.04Public ShareholdingNumber of Shares 52,587,955 53,554,762 53,564,907Percentage of Shareholding 55.35% 57.40% 56.38%Page 3/5
Contd. from Page 3UNAUDITED FINANCIAL RESULTS FOR THE QUARTER ENDED 31ST DECEMBER 2008SEGMENT REPORTING(Rs Crores)Standalone Financial ResultsQuarter Ended 31st DecemberYear to DateYear Ended31st March2008 2007 2008 2007 2008(Audited)Segment RevenueGarments 234.44 221.50 695.87 603.42 825.71Rayon Yarn (Including Caustic & Allied Chemicals) 125.81 119.96 400.01 348.18 475.96Carbon Black 221.93 245.33 857.54 596.76 863.84Insulators 112.84 98.17 309.50 283.57 398.86Other Textiles (Spun Yarn & Fabrics) 139.93 149.91 437.96 446.61 600.35Fertilizers 362.55 263.46 912.01 518.25 787.46Financial Services - 1.11 0.31 5.04 5.27Total Segmental Revenue 1,197.50 1,099.44 3,613.20 2,801.83 3,957.45Less: Inter Segment Revenue (0.86) (1.81) (0.93) (2.68) (4.39)Net Income from Operations 1,196.64 1,097.63 3,612.27 2,799.15 3,953.06Segment Results (Profit beforeInterest and Tax - PBIT)Garments (7.17) 10.48 (16.05) 18.60 35.08Rayon Yarn (Including Caustic & Allied Chemicals) 12.98 19.27 61.10 66.08 91.52Carbon Black (26.34) 37.42 38.45 99.41 130.32Insulators 25.21 31.89 78.55 85.16 122.53Other Textiles (Spun Yarn & Fabrics) 4.91 11.89 28.58 37.35 48.69Fertilizers 43.23 29.23 132.93 53.35 84.45Financial Services (1.93) (0.95) (5.61) (1.11) (2.44)Total Segment Result 50.89 139.23 317.95 358.84 510.15Less: Interest & Finance Expenses (Net) (72.75) (36.82) (171.21) (125.36) (174.86)Add: Net of Unallocable Income/(Expenditure) (3.44) (5.26) (5.98) (11.67) (21.46)Profit / (Loss) Before Tax and Exceptional Items (25.30) 97.15 140.76 221.81 313.83Gain on sale of Undertaking - - - 0.73 0.73Profit / (Loss) After Exceptional Items (25.30) 97.15 140.76 222.54 314.56Capital Employed As on As on As on(Segment Assets - Segment Liabilities) 31st Dec 08 31st Dec 07 31st March 08Garments 491.58 414.68 471.25Rayon Yarn (Including Caustic & Allied Chemicals) 439.55 430.38 453.69Carbon Black 887.05 563.54 667.54Insulators 268.89 222.87 239.96Other Textiles (Spun Yarn & Fabrics) 399.38 362.96 359.33Fertilizers 444.86 359.12 531.27Financial Services 13.09 7.94 14.03Total Segment Capital Employed 2,944.40 2,361.49 2,737.07Add: Unallocated Corporate Assets 4,717.84 3,667.54 3,949.09Total Capital Employed 7,662.24 6,029.03 6,686.16Page 4/5
Notes:Contd. from Page 412The Company has entered into a Share Purchases Agreement with the promoters of Apollo Sindhoori Capital Investments Limited (“ASCIL”), toacquire 3,10,24,000 equity shares in ASCIL representing 56% of its Paid up capital at a price of Rs 64.08 per share aggregating to Rs 198.81Crores, subject to compliance of the formalities and conditions precedents as mentioned in the Agreement. The Company has made an openoffer to acquire upto 20% of the stake in the share capital of ASCIL on 20th January 2009 which will close on 9th Feburary 2009 , as per SEBIregulations. The effect of these transactions will be given as and when completed.Idea Cellular Limited (IDEA), a Joint Venture Company has paid a non-compete fee of Rs. 543.98 Crores to MCorp in July 2008 pursuant to theNon-Compete Agreement entered into for a period of three years as a part of the acquisition of 40.8% equity in Spice Communications Limited(Spice). The scheme of arrangement which includes proposed adjustment of the non compete fee against the balance in the SecuritiesPremium Account has been filed with the stock exchanges. Consequent to court approvals, the accounting effects to the scheme ofarrangement would be given. In light of the above, no amortisation of the Company's Share of non-compete fee amounting to Rs. 12.42 Croresfor the current quarter and Rs. 24.83 Crores for the period ended 31st December 2008 was considered necessary.3IDEA has acquired an equity stake in Spice and it intends to merge Spice into itself. Spice has operations in Punjab and Karnataka serviceareas. IDEA also holds UAS Licenses for these service areas where no roll out has happened. A decision has therefore been taken to de-mergethese UAS Licenses. These UAS Licenses are being de-merged through a Court approved scheme of arrangement into a separate independententity which is eligible to hold these licenses. Consequent to court approvals, the difference between the carrying values and the considerationfor demerger of these licenses is proposed to be adjusted against the balance in the Securities Premium Account as a part of the scheme ofarrangement. In light of this background, IDEA has decided to carry these UAS Licenses at cost as on 31st December 2008.4During the current quarter <strong>Aditya</strong> <strong>Birla</strong> Financial Services Private Limited, <strong>Aditya</strong> <strong>Birla</strong> Capital Advisors Private Limited, <strong>Aditya</strong> <strong>Birla</strong> SecuritiesPrivate Limited, <strong>Aditya</strong> <strong>Birla</strong> Trustee Company Private Limited and <strong>Aditya</strong> <strong>Birla</strong> Customer Services Private Limited have become wholly ownedsubsidiaries of the Company.5 Previous year’s / period’s figures are regrouped / rearranged wherever necessary.6 Status of Investor Complaints for the quarter ended December 31, 2008.Opening Received Redressed Pending2 13 13 27The above <strong>results</strong> have been reviewed by the Audit Committee of the Board and taken on record at the meeting of the Board of Directors. TheStatutory Auditors of the Company have carried out Limited Review of the Unaudited Standalone and Consolidated Financial Results asrequired under Clause 41 of Listing Agreement and the related report will be submitted to the concerned stock exchanges.Place: MumbaiDate: January 29, 2009ADITYA BIRLA NUVO LIMITEDRegd. Office: Indian Rayon Compound, Veraval 362266, GUJARAT.Web Site: http://www.adityabirlanuvo.com / adityabirlanuvo.co.inAn <strong>Aditya</strong> <strong>Birla</strong> Group CompanyDr. Bharat K. SinghManaging DirectorPage 5/5