Q1 FY12 - Aditya Birla Nuvo, Ltd
Q1 FY12 - Aditya Birla Nuvo, Ltd
Q1 FY12 - Aditya Birla Nuvo, Ltd

Create successful ePaper yourself
Turn your PDF publications into a flip-book with our unique Google optimized e-Paper software.
Stock Code: BSE : 500303 NSE : ABIRLANUVO Reuters : ABRL.BO / ABRL.NS / IRYN.LU Bloomberg : ABNL IN / IRIG LX
Contents<strong>Aditya</strong> <strong>Birla</strong> <strong>Nuvo</strong> : Key Highlights 3 – 8Business-wise Performance 9 – 17Financial Results 18 – 23Annexure 24 – 45Note 1 : The financial results of ABNL are consolidated financials unless otherwise specifiedNote 2 : USD 1 = ` 45Note 3 : The financial figures in this presentation have been rounded off to the nearest ` 1 Crore2
India Inc.Indian economy grew by 8.5% in 2010-11In 2011-12, moderation in the GDP growth is projectedIndustrial GDP growth and investment activities have slowed down due to rise in cost of borrowings andincrease in input and fuel costsInflationary pressure has led to moderation in domestic demand and household spendingHaving withstood economic turns in the past, growth outlook for Indian economy remainspositive in the medium to long term. India remains strongly positioned as one of the fastestgrowing economies in the worldAmidst these challenges, <strong>Aditya</strong> <strong>Birla</strong> <strong>Nuvo</strong> continued its profitable growth journey withstrengthened market positioning and robust growth across its businesses3
<strong>Aditya</strong> <strong>Birla</strong> <strong>Nuvo</strong> : Profitable growth journey continues ...Achieved highest ever consolidated quarterly EBITDAPosted healthy earnings growth across the businessesStrengthened market positioning<strong>Birla</strong> Sun Life Insurance moved one step up to rank 5 th among private life insurers in India in terms of newbusiness with an improved market share of 8.8%Revenue market share of Idea, the 3 rd largest cellular operator in India, grew q-o-q from 13.3% to 13.6% 1Madura Fashion & Lifestyle, the largest branded apparel player in India, outperformed market growth<strong>Aditya</strong> <strong>Birla</strong> Minacs named among „top five emerging outsourcers to watch for in North America‟ 2Attained robust volume growth year on yearIdea‟s total minutes on network (MoN) rose by 32% outperforming the sector growthMadura Fashion & Lifestyle achieved 39% growth in sales volume amidst rise in apparel prices<strong>Aditya</strong> <strong>Birla</strong> Minacs sold Total contract value (TCV) of ~USD 128 million (New business - 93% of TCV)Carbon Black business registered 32% growth in volumes led by expansion in the previous yearTextiles business posted 29% volume growth in linen fabric segment driven by buoyant demand1 Based on gross revenue for UAS & Mobile license only, released by TRAI, for March 2011 quarter2Source: Frost & Sullivan4
... supported by earnings growth across the businessesBusiness-wise earnings growth in <strong>Q1</strong><strong>FY12</strong> (y-o-y)RevenueEBITDAFinancial Services4%97%Telecom24%35%Fashion & Lifestyle39%27%IT-ITeS21%Manufacturing43%21%5
Consolidated earnings registered strong growthRevenue @ ~USD 1.1 billion( ` Crore)EBITDA @ ~USD 179 million( ` Crore)3,85724%4,76755645%808<strong>Q1</strong> FY 11 <strong>Q1</strong> FY 12<strong>Q1</strong> FY 11 <strong>Q1</strong> FY 12Net Profit @ ~USD 56 million( ` Crore)25314970%<strong>Q1</strong> FY11<strong>Q1</strong> <strong>FY12</strong>6
Profitability stepping up quarter after quarterConsolidated EBITDA( ` Crore)745779808516556621336413 421<strong>Q1</strong>FY10 Q2FY10 Q3FY10 Q4FY10 <strong>Q1</strong>FY11 Q2FY11 Q3FY11 Q4FY11 <strong>Q1</strong><strong>FY12</strong>7
Strengthening Balance Sheet year after yearStandalone Net DebtStandalone Ratios( ` Crore)Net Debt / EBITDANet Debt / Equity84426171102 1285WorkingCapital Loans4.120401830Other Loans(Net of surplus)0.743.2 3.2Mar'10 Mar'11 Jun'11Total3,460 3,142 3,1150.58 0.57FY10 FY11 <strong>Q1</strong> FY 12Balance Sheet strengthened & Financial ratios improved considerably8
<strong>Aditya</strong> <strong>Birla</strong> Financial Services (ABFS)Revenue 1EBT 1AUM21283( ` Crore)1330( ` Crore)177( ` Crore)88,22492,2594% 782.5x83,410<strong>Q1</strong> FY11<strong>Q1</strong> <strong>FY12</strong><strong>Q1</strong> FY11<strong>Q1</strong> <strong>FY12</strong>FY10 FY11 <strong>Q1</strong><strong>FY12</strong>While the Indian financial services industry is undergoing a rapidly evolving phase, driven byregulatory changes and uncertain markets, ABFS has strengthened its position as a significant nonbank Financial Services player : Managing AUM of ~USD 20.5 billion, ABFS is one of the two non bankplayers in India which rank among top 7 players in both life insurance and asset management businessesDuring <strong>Q1</strong>, revenue grew by 4%. However, earnings before tax grew 2.5 times to ` 177 Cr.Post new IRDA guidelines effective from 1 st Sep‟10, life insurance industry witnessed subdued ULIP sales,affecting ABFS revenue growth too.While there was a focus on profitable growth across all the businesses, life insurance was the majorcontributor to the bottom-line growthNote 1 : Include full figures of Asset Management business. Being a JV, Asset Management business is consolidated at 50% in ABNL‟s consolidated financials as per AS 27.Note 2 : Includes assets of Life Insurance, quarterly AAUM of Asset Management and Private EquityModerate growth in top-line – Strong growth in profitability10
<strong>Birla</strong> Sun Life Asset Management (BSAMC)Industry’s domestic avg. AUM (AAUM) at ~ ` 743,000 Cr. grew q-o-q by 6%Witnessing inflows largely in liquid funds and FMPs since past two quarters led by improved liquidityconditions in the marketBSAMC‟s domestic AAUM of achieved 3 rd highest growth q-o-q among top 5 playersRanks 5 th with a market share of 9.1%Total AAUM of BSAMC at ` 71,394 Cr. grew 6% q-o-qEquity & alternate assets AAUM is at ` 15,349 Cr.Garnered 18% share in industry‟s net equity sales during the quarterReal estate fund : Out of ` 1,088 Cr., ~15% has been deployedBSAMC has highest number of funds with 5 star ratings in the industryBSAMC : Total AAUM(` Crore)67,584 71,39452,383 56,04515,200 15,349Q4FY11<strong>Q1</strong><strong>FY12</strong>1 Equity AAUM (Domestic & Offshore) +Debt &LiquidEquity &AlternateAssets 1Quarterly revenue at ` 85 Cr. and EBT at ` 30 Cr.Q-o-Q, revenue grew by 28% and EBT rose by 53%PMS + Real Estate Onshore FundGoing forward : Increasing market share profitably with a strong focus on distribution and high margin assetsbesides fund performance and superior customer service12
Other Financial ServicesNBFC : <strong>Aditya</strong> <strong>Birla</strong> Finance (ABFL)During the quarter, closing book size of ABFL grew y-o-y by 77%Revenue more than doubled to ` 60 Cr. in line with growth in book sizeEarnings before tax was flat at ` 10 Cr.Rise in interest rates continue to put pressure on NIMs across the industryFocusing to grow the book profitably while managing risk optimally~1125Book Size(` Crore)77%~1975<strong>Aditya</strong> <strong>Birla</strong> Private Equity (ABPE)<strong>Q1</strong> FY11 <strong>Q1</strong> FY 12“Sunrise Fund” – the second private equity fund is targeting its first closure in August 2011.About 22% of the USD 200 million ABPE Fund - I has been invested in four companies.<strong>Aditya</strong> <strong>Birla</strong> Money and <strong>Aditya</strong> <strong>Birla</strong> Money Mart (Broking and Wealth Management)Losses reduced quarter on quarter<strong>Aditya</strong> <strong>Birla</strong> Money Mart is amongst the top mutual fund distributors in the country, the largest corporateagent for <strong>Birla</strong> Sun Life Insurance and a significant player in wealth management<strong>Aditya</strong> <strong>Birla</strong> Money : Retail market share in cash segment enhanced q-o-q. Market share incommodities segment has also increased.<strong>Aditya</strong> <strong>Birla</strong> Insurance brokers, the general insurance advisory arm, wrote a premium of ` 84 Cr.13
Telecom : Idea Cellular( ` Crore)RevenueEBITDA4516365024%<strong>Q1</strong>FY11 <strong>Q1</strong><strong>FY12</strong>Earnings909 122535%<strong>Q1</strong>FY11 <strong>Q1</strong><strong>FY12</strong>Minutes on Network( In billion)1091029482 85<strong>Q1</strong>FY11 Q2 Q3 Q4 <strong>Q1</strong><strong>FY12</strong>Deriving cost efficiencies0.580.430.440.35Avg. Revenue per minute(`)Avg. Cost per minute(`)0.410.32<strong>Q1</strong>FY10 <strong>Q1</strong>FY11 <strong>Q1</strong><strong>FY12</strong>In <strong>Q1</strong>, a robust 32% growth in total MoN drove y-o-y earnings growth absorbing ~6% decline in ARPM 1Rising revenue share and scale benefit led cost efficiencies also contributed to 35% growth in EBITDANet profit de-grew from ` 201 Cr. to ` 177 Cr. : With the introduction of 3G services, additional expenses ofamortisation of 3G spectrum fee (` 66 Cr.) & charging of related interest cost (` 123 Cr.) impacted profitsQ-o-Q, EBITDA grew by 12% - ARPM improved q-o-q while cost per minute continued to reduceIdea has the highest active subscribers ratio in the industry at 92% as on 31 st May 2011 and is the leadingnet subscribers gainer post launch of mobile number portability (MNP) reflecting its brand strengthCurrently offers 3G services in 19 services areasGoing Forward : Continue to increase revenue market share by capitalising on brand !DEA besides leveraging3G spectrum to augment revenue stream and enrich customer experienceNote 1 : Average Revenue per Minute14
Madura Fashion & LifestyleBranded Apparels – Quantity SoldRevenueEBITDA(Million Pieces)3.539%4.8348( ` Crore)39%48419( ` Crore)27%24<strong>Q1</strong> FY11<strong>Q1</strong> <strong>FY12</strong><strong>Q1</strong> FY11<strong>Q1</strong> <strong>FY12</strong><strong>Q1</strong> FY11<strong>Q1</strong> <strong>FY12</strong>Achieved 39% y-o-y revenue growth supported by 39% volume growthPosted strong volume growth amidst rise in apparel pricesApparel prices were increased to pass on rise in cotton prices & levy of excise dutyRetail channel achieved overall 43% growth driven by same store sales growth and expanded retail spaceLike to like stores sales grew by 16%Launched 70 Exclusive Brand Outlets (EBOs) to reach 948 EBOs spanning across ~1.4 million sq. ft.EBITDA grew y-o-y by 27% driven by sales growth across the channels & brandsIncrease in volumes & prices compensated for cost push and higher discountingGoing forward : Continue to leverage brand leadership and expanded retail space besides extending range ofmerchandise for superior shopper experience.15
IT-ITeS : <strong>Aditya</strong> <strong>Birla</strong> MinacsEmployeesRevenueEBITDA15492(In nos.)32%20428390( ` Crore)21%471( ` Crore)36 35<strong>Q1</strong> FY11<strong>Q1</strong> <strong>FY12</strong><strong>Q1</strong> FY11<strong>Q1</strong> <strong>FY12</strong><strong>Q1</strong> FY11<strong>Q1</strong> <strong>FY12</strong>Total contract value (TCV) of ~USD 128 million sold in <strong>Q1</strong> : Won 3 new logosAbout 93% of TCV is on account of new business and balance is renewal businessDiversifying geographical presence : Added one more centre in Philippines with 285 seats capacityDuring the quarter, revenue grew y-o-y by 21% to ` 471 Cr.Conversion of order book drove revenue growthAdded about 800 headcounts during the quarter to support growthEBITDA was flat at ` 35 Cr.Rise in manpower cost & ramp up expenses for new contracts contained profitability.Reported net profit at ` 8 Cr. (PY: ` 10 Cr.)Going forward : Augmenting capacities, building strong order book and asset sweating16
Manufacturing BusinessesRevenueEBITDAProfitability & Return Ratios970( ` Crore)1392172( ` Crore)208EBITDA % 15%43%21%ROACE % 25%<strong>Q1</strong> FY11<strong>Q1</strong> <strong>FY12</strong><strong>Q1</strong> FY11<strong>Q1</strong> <strong>FY12</strong>Revenue growth was largely driven by expanded capacity in carbon black , buoyant sales volume in linen segment andhigher production in Agri-business. Higher input costs also reflected in realisation in Carbon Black and Agri-business.BusinessPerformance Review<strong>Q1</strong>- EBITDAFY11 <strong>FY12</strong>Agri-business In <strong>Q1</strong> last year, annual maintenance shut down of 21 days led to lower volumes 29 44Carbon Black Expansion & higher power sales contributed; partly offset by rise in cost of feedstock 58 68Insulators Lower volumes & rise in input & fuel costs impacted; partly off set by rise in realisation 31 25Rayon Increase in realisation compensated for rise in input & fuel costs 31 30Textiles Robust demand in linen segment & improved realisation across segments 22 43Going forward : Margin enhancement by maximising operating efficiency & passing on rise in input & fuel costs.Pursuing capacity expansion in the Carbon Black, Caustic soda and Insulators businesses.17
Consolidated Segmental EBIT WalkFinancial Services led the profit walk followed by Telecom and Manufacturing businesses( ` Crore)10745 4 -433494308<strong>Q1</strong>FY11FinancialServicesTelecomFashion &LifestyleIT-ITeS Manufacturing <strong>Q1</strong><strong>FY12</strong>20
Consolidated Net Profit WalkImproved earnings across the businesses led the strong bottom-line growth( ` Crore)252 -58-40-17-33149253<strong>Q1</strong>FY11 EBITDA InterestExpensesDepreciation Tax MinorityInterest<strong>Q1</strong><strong>FY12</strong>With the introduction of 3G services, additional expenses of amortisation of 3G spectrum fee of ` 66 Cr (<strong>Nuvo</strong>‟s share ` 17 Cr.) &related interest cost of ` 123 Cr. (<strong>Nuvo</strong>‟s share ` 31 Cr.) were charged to profit in the telecom business leading to rise in ABNL‟sconsolidated depreciation & interest cost21
Consolidated Mix – <strong>Q1</strong><strong>FY12</strong>Revenue` 4,767 Cr.EBIT` 494 Cr.Manufacturing29%FinancialServices27%Manufacturing35%FinancialServices33%IT-ITeS10%Fashion &Lifestyle10%Telecom24%IT-ITeS4%Fashion &Lifestyle1%Telecom27%22
<strong>Aditya</strong> <strong>Birla</strong> <strong>Nuvo</strong> : A Uniquely Positioned ConglomerateVisionTo become a premium conglomeratewith market leadership across businessesdelivering superior value to shareholders on a sustained basisGoing ForwardCapturing opportunities across the businessesto achieve next higher level of growthsupported by strong balance sheet23
Segmental Revenue( ` Crore)RevenueQuarter 12011-12 2010-11Life Insurance 1,140 1,095Other Financial Services * 147 138Telecom (<strong>Nuvo</strong>'s share) @ 1,145 926Fashion & Lifestyle 484 348IT-ITeS 471 390Manufacturing 1,392 970Carbon Black 513 324Agri-business 351 226Rayon 156 126Insulators 110 115Textiles 261 178Inter-segment Elimination (11) (11)Consolidated Revenue 4,767 3,857*Other Financial Services include Asset Management (consolidated at 50%), NBFC, Private Equity, Broking, Wealth Management & General Insurance Advisory.@ Idea is consolidated at 25.4%25
Segmental EBIT( ` Crore)EBITQuarter 1*Other Financial Services include Asset Management (consolidated at 50%), NBFC, Private Equity, Broking, Wealth Management & General Insurance Advisory.Interest cost of NBFC business, being an operating expense as per AS 17, is deducted from Segmental EBIT@ Idea is consolidated at 25.4%2011-12 2010-11Life Insurance 147 12Other Financial Services * 16 44Telecom (<strong>Nuvo</strong>'s share) @ 133 87Fashion & Lifestyle 7 4IT-ITeS 17 21Manufacturing 174 141Carbon Black 57 51Agri-business 39 25Rayon 21 23Insulators 19 26Textiles 37 17Segmental EBIT 494 30826
Consolidated Profit & Loss and Balance SheetConsolidated Profit & Loss AccountQuarter 12011-12 2010-11( ` Crore)Balance SheetJun-11 Mar-11Net Worth 6,908 6,678Revenue 4,767 3,857EBITDA 808 556Less : NBFC Interest expenses 39 18Less : Other Interest Expenses 155 117EBDT 614 420Less : Depreciation 261 221Earnings before Tax 353 199Less : Provision for Taxation (Net) 61 44Less : Minority Interest 38 6Consolidated Net Profit 253 149Minority Interest 317 278Total Debt 7,865 7,763Deferred Tax Liabilities (Net) 275 259Capital Employed 15,366 14,978Policyholders' funds(Incl. funds for future appropriation) 19,028 18,977Total Liabilities 34,393 33,955Net Block (Incl. Goodwill) 11,982 11,884Net Working Capital 1,047 542Long Term Investments 289 289Life Insurance Investments 19,984 19,760Cash Surplus & Current Investments 1,091 1,481Book Value (`) 609 586Net Debt / EBITDA (x) 2.1 2.3Net Debt / Equity (x) 0.98 0.94With the introduction of 3G services, additional expenses of amortisation of 3G spectrum fee of ` 66 Cr (<strong>Nuvo</strong>’s share ` 17 Cr.) & related interest cost of` 123 Cr. (<strong>Nuvo</strong>’s share ` 31 Cr.) were charged to profit in the telecom business leading to rise in ABNL’s consolidated depreciation & interest cost27
Standalone Profit & Loss and Balance Sheet( ` Crore)Profit & Loss AccountQuarter 1Balance SheetJune March2011 20112011-12 2010-11Net Worth 5,495 5,401Total Debt 3,335 3,287Revenue 1,864 1,311EBITDA 247 204Interest Expenses 71 69EBDT 176 135Depreciation 50 45Earnings before Tax 126 90Provision for Taxation (Net) 32 25Net Profit 94 65Deferred Tax Liabilities 173 174Capital Employed 9,003 8,862Net Block 1,855 1,858Net Working Capital 1,478 1,434Long Term Investments 5,449 5,424Cash Surplus & Current Investments 220 146Book Value (`) 484 476Net Debt / EBITDA (x) 3.2 3.2Net Debt / Equity (x) 0.57 0.58Market Capitalisation - NSE 10,252 9,24428
Audited consolidated results – FY 2010-11Revenue @ > USD 4 billion( ` Crore)EBITDA @ ~USD 600 million( ` Crore)15,52318,1681,6862,70217%60%FY 10 FY 11FY 10 FY 11Net Profit @ ~USD 183 million( ` Crore)8221555xFY 10 FY 11Note : The Board of Directors of ABNL had approved, on 30 th May, 2011 the unaudited consolidated financial results, inter alia, considering then availableunaudited consolidated financial results of Idea Cellular Limited (Idea) for the nine months ended 31 st December, 2010 and adopted the standalone auditedaccounts of ABNL for the year ended 31 st March, 2011. Idea has now adopted, on 29 th July, 2011, its audited consolidated financial statement (FS) for theyear ended 31 st March, 2011. Accordingly, ABNL has now published its consolidated FS considering Idea‟s FS for the year ended 31 st March, 2011.30
Segmental Revenue and EBIT – FY 2010-11RevenueSegmentalEBIT( ` Crore)2010-11 2009-10 2010-11 2009-10*5534 5309 Life Insurance 314 (425)579 416 Other Financial Services * 101 883918 3331 Telecom (<strong>Nuvo</strong>'s share) @ 369 4311809 1251 Fashion & Lifestyle 66 (81)1692 1530 IT-ITeS 116 424689 3725 Manufacturing 648 6281588 1161 Carbon Black 221 2271244 1022 Agri-business 157 136565 538 Rayon 75 120518 428 Insulators 114 98774 577 Textiles 80 47(53) (38) Inter-segment Elimination - -18168 15523 Total 1614 684Other Financial Services include Asset Management (consolidated at 50%), NBFC, Private Equity, Broking, Wealth Management & General Insurance Advisory.Interest cost of NBFC business, being an operating expense as per AS 17, is deducted from Segmental EBIT@ Idea is consolidated at 27.02% till 1 st Mar‟10 and at 25.4% thereafter.31
Consolidated Profit & Loss( ` Crore)Consolidated Profit & Loss Account2010-11 2009-10Revenue 18,168 15,523EBITDA 2,702 1,686Less : NBFC Interest expenses 112 80Less : Other Interest Expenses 454 582EBDT 2,136 1,024Less : Depreciation 941 866Earnings before Tax 1,195 158Less : Provision for Taxation (Net) 183 114Less : Minority Interest 86 (111)Net Profit after minority interest beforeexceptional gain / (loss) 926 155Add : Exceptional Gain / (Loss)* (104) -Consolidated Net Profit 822 155*<strong>Aditya</strong> <strong>Birla</strong> Money & <strong>Aditya</strong> <strong>Birla</strong> Money Mart, subsidiaries of ABNL, have borne one time exceptional loss of ` 104 Cr.32
<strong>Aditya</strong> <strong>Birla</strong> Financial Services` CroreQuarter 12011-12 2010-11Revenue<strong>Birla</strong> Sun Life Insurance 1,140 1,095<strong>Birla</strong> Sun Life Asset Management 85 100<strong>Aditya</strong> <strong>Birla</strong> Finance 60 25<strong>Aditya</strong> <strong>Birla</strong> Money 20 28<strong>Aditya</strong> <strong>Birla</strong> Money Mart 12 18<strong>Aditya</strong> <strong>Birla</strong> Insurance Brokers 9 10Others 4 7Length and BreadthAUM~USD 20.5 billionCustomers~ 5.5 millionPoints of presence Over 1,700Channel Partners~ 2 lacsEmployees ~ 15,000Total Revenue 1,330 1,283EBITDA 190 96Earnings before tax 177 78Net Profit 161 5434
<strong>Birla</strong> Sun Life Insurance` CroreQuarter 12011-12 2010-11New Business PremiumIndividual Business 247 398Group Business 76 75New Business Premium (Gross) 322 473Renewal Premium (Gross) 860 669Premium Income (Gross) 1,183 1,143Less : Reinsurance ceded & Service tax (50) (52)Premium Income (Net) 1,132 1,091Other Operating Income 8 4Revenue 1,140 1,095EBITDA 154 22RevenuesEarnings before tax 144 9Net Profit 144 9Capital 2,450 2,450Assets under management 19,984 16,841AUM grew y-o-y by 19% to ` 19,984 Cr. (~USD 4.5 billion)Covering ~2.4 million lives supported by ~150,000 agents and about 600 branches35
<strong>Birla</strong> Sun Life Asset ManagementAverage AUM` Crore<strong>Q1</strong><strong>FY12</strong> <strong>Q1</strong>FY11Equity 11,464 11,401Debt & Liquid 56,045 57,470Domestic AUM 67,510 68,871Off shore (All Equity) 2,577 2,405PMS 220 397Quarter 1` Crore2011-12 2010-11Revenue (Fee Income) 85 100RevenuesEBITDA 31 51RevenuesEarnings before tax 30 49Net Profit 18 32Real Estate Fund 1,088 naTotal AUM 71,394 71,673Serving ~ 2.4 million customers supported by ~34,000 IFAs and 103 branches36
Idea Cellular` CroreQuarter 12011-12 2010-11Revenue 4,516 3,650EBITDA 1,225 909EBIT 523 344Net Profit 177 201Net Worth 12,481 11,580Total Debt 11,969 11,197Capital Employed 24,449 22,776Strong balance sheet & steady cash profit to support growth: Net debt / EBITDA at 2.4 & Net Debt/Equity at 0.9Out of 19 service areas, where Idea has launched 3G services, Idea has bilateral roaming arrangement for 10 serviceareas with leading quality operatorsCapex (2G+3G) of ~ ` 1,038 Cr. was spent during <strong>Q1</strong>. For <strong>FY12</strong>, the total capex guidance stands at ` 40 billionIdea is serving a large base of more than 95 million subscribers as on 30 th June‟11Interest cost on 3G borrowings (` 40 Cr.) had been capitalised in <strong>Q1</strong> last year37
Madura Fashion & Lifestyle` CroreQuarter 12011-12 2010-11No. of EBOs 948 748Retail Space (Mn Sq. Ft) 1.4 1.1Revenue 484 348EBITDA 24 19EBIT 7 4Capital Employed 570 53038
<strong>Aditya</strong> <strong>Birla</strong> Minacs` CroreQuarter 12011-12 2010-11Employees (Nos.) 20,428 15,492Revenue 471 390EBITDA 35 36EBIT 17 21Net Profit 8 1039
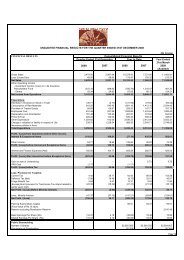
Indo Gulf FertilisersQuarter 1` Crore2011-12 2010-11Urea Sales ('000 MT) 260 223Revenue 351 226EBITDA 44 29EBIT 39 25Capital Employed 511 275ROACE (Annualised) (%) 31 34Sales volume grew by 16% : In <strong>Q1</strong> last year, plant was under annualmaintenance shutdown for 21 daysRevenue grew by 55% to ` 351 Cr. led by increase in salesvolumes, higher realisation (subsidy) & higher agri-input salesHigher feed & fuel (natural gas) prices resulted in higher subsidiesEBITDA grew y-o-y by 49% to ` 44 Cr.Last year, profitability was constrained due to lower volumes,higher energy cost & higher repairs on account of plant shutdownHigher agri-input sales & higher share of neem coated ureacontributed to the profitability growthOperating at ROACE of 31%The Government is planning to bring urea under Nutrient basedsubsidy policy. This coupled with proposal to lift the ceiling onproduction of neem coated urea (currently at 35% of total production)will benefit the business40
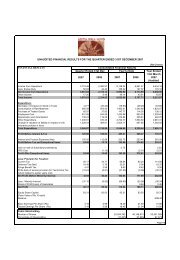
Hi-Tech CarbonQuarter 1` Crore2011-12 2010-11Sales Volumes (MT) 76,052 57,721Realisation (Rs./MT) 63,537 52,552In <strong>Q1</strong>, business revenue surged by 58% to ` 513 Cr. led by32% growth in sales volume & increase in realisationVolume growth was largely driven by capacity expansion of~85,000 TPA at Patalganga completed in <strong>Q1</strong> last yearRealisation grew by 21% reflecting movement in feedstock(CBFS) prices in line with crude oil pricesRevenue 513 324EBITDA 68 58EBIT 57 51Capital Employed 1,264 1,036ROACE (Annualised) (%) 18 21EBITDA grew by 16% to ` 68 Cr. supported by volumegrowth and higher power salesPower sales grew to ` 29 Cr. (PY ` 20 Cr.) – Power sales atRenukoot and Patalganga plants commenced from Feb‟11.Rise in feedstock prices put pressure on marginPlanning capacity expansion by 85,000 TPA each atPatalganga plant in second phase and in southern India41
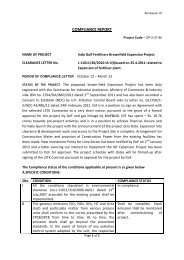
<strong>Aditya</strong> <strong>Birla</strong> InsulatorsQuarter 1` Crore2011-12 2010-11Sales Volumes (MT) 9,257 9,850Revenue 110 115EBITDA 25 31EBIT 19 26Capital Employed 372 274ROACE (Annualised) (%) 21 36In <strong>Q1</strong>, business revenue remained flat at ` 110 Cr.Sales volume were lower due to deferment of delivery scheduleby few clientsRealisation in substation segment remained under pressurewhile realisation in transmission segment increased in line withrise in input and fuel costs.EBITDA de-grew from ` 31 Cr to ` 25 Cr.Lower volumes and rise in production costs impacted; partly setoff by increase in realisationCapacity enhancement by ~2,000 TPA through debottleneckingis on cards42
Indian Rayon` CroreQuarter 12011-12 2010-11VFYSales Volumes (MT) 3,563 3,546Realisation (Rs./Kg.) 296 239Revenue ( ` Cr.) 105 85ChemicalCaustic Soda Sales (MT) 20,545 20,540ECU Realisation (Rs./MT.) 23,117 18,409Revenue ( ` Cr.) 51 41Total Revenue 156 126EBITDA 30 31EBIT 21 23Capital Employed 431 406ROACE (Annualised) (%) 19 22Sharp rise in pulp cost continues to keep margins of VFYplayers under pressure.In <strong>Q1</strong>, business revenue grew y-o-y by 24% to ` 156 Cr.VFY realisation grew by 24% : Prices increased during pastone year to pass on rise in input and fuel costsECU realisation grew by 26% led by higher caustic pricesVFY and Caustic soda sales volume remained flatPosted EBITDA at ` 30 Cr. (PY ` 31 Cr.)Increase in VFY and ECU realisation compensated for risein input and fuel costsTargeting Greenfield caustic soda expansion by 125 tons perday (TPD) at Patalganga at a capex of ` 155 Cr. by FY13 end,thereby taking total capacity to 375 TPDPlanning to expand its presence in Fine / Superfine VFYsegment using Spool Technology from Germany at a capex ofabout ` 270 Cr. to cater premium segment43
Jaya Shree TextilesQuarter 1` Crore2011-12 2010-11Linen Segment 101 64Wool Segment 160 114Revenue 261 178EBITDA 43 22EBIT 37 17Capital Employed 191 196ROACE (Annualised) (%) 77 28Textiles business achieved its highest ever quarterlyrevenue and EBITDARevenue grew y-o-y by 47% to 261 Cr.Buoyant demand in domestic market continues to drivevolume growth in the linen segmentLinen Fabric sales volume grew by 29% while LinenYarn sales volume grew by 21%Realisation improved in both linen and wool segmentspartly reflecting rise in input costEBITDA almost doubled to ` 43 Cr. driven by improvedrealisation across the segments and volume growth inlinen segmentFocus on high margin OTC segment : Share in total linenfabric sales volume grew from 39% to 54%Added 3 more exclusive store franchisees of „Linen Club‟fabric in <strong>Q1</strong> to reach a total of 43 storesROACE improved considerably led by improved earningsand better working capital management44
Annexure IV : Reporting StructureConsolidatedSubsidiaries & Joint VenturesStandaloneFinancialServicesTelecom 3 #(25.35%)IT-ITeS 2(88.28%)Fashion &Lifestyle 1ManufacturingLife Insurance 2(74%)*Asset Management 3(50%) *1Represent Divisions2Represent Subsidiaries3Represent Joint VenturesCarbon Black 1Agri-Business 1Rayon 1NBFC 2Private Equity 2*JV with Sun Life Financial, CanadaInsulators 1Broking (75%) 2# Listed, <strong>Aditya</strong> <strong>Birla</strong> Group holds 46.03%Wealth management 2Note : Percentage figures indicated above representGeneral Insurance Advisory 2 Textiles 1ABNL‟s shareholding in its subsidiaries /JV‟s45
DisclaimerCertain statements made in this presentation may not be based on historical information or facts and may be “forward looking statements” including,but not limited to, those relating to general business plans & strategy of <strong>Aditya</strong> <strong>Birla</strong> <strong>Nuvo</strong> Limited ("ABNL"), its future outlook & growth prospects,future developments in its businesses, its competitive & regulatory environment and management's current views & assumptions which may notremain constant due to risks and uncertainties. Actual results may differ materially from these forward-looking statements due to a number offactors, including future changes or developments in ABNL's business, its competitive environment, its ability to implement its strategies andinitiatives and respond to technological changes and political, economic, regulatory and social conditions in the countries in which ABNL conductsbusiness. Important factors that could make a difference to ABNL‟s operations include global and Indian demand supply conditions, finished goodsprices, feed stock availability and prices, cyclical demand and pricing in ABNL‟s principal markets, changes in Government regulations, tax regimes,competitors actions, economic developments within India and the countries within which ABNL conducts business and other factors such aslitigation and labour negotiations.This presentation does not constitute a prospectus, offering circular or offering memorandum or an offer to acquire any shares and should not beconsidered as a recommendation that any investor should subscribe for or purchase any of ABNL's shares. Neither this presentation nor any otherdocumentation or information (or any part thereof) delivered or supplied under or in relation to the shares shall be deemed to constitute an offer ofor an invitation by or on behalf of ABNL.ABNL, as such, makes no representation or warranty, express or implied, as to, and does not accept any responsibility or liability with respect to,the fairness, accuracy, completeness or correctness of any information or opinions contained herein. The information contained in this presentation,unless otherwise specified is only current as of the date of this presentation. ABNL assumes no responsibility to publicly amend, modify or reviseany forward looking statements on the basis of any subsequent developments, information or events or otherwise. Unless otherwise stated in thisdocument, the information contained herein is based on management information and estimates. The information contained herein is subject tochange without notice and past performance is not indicative of future results. ABNL may alter, modify or otherwise change in any manner thecontent of this presentation, without obligation to notify any person of such revision or changes. This presentation may not be copied anddisseminated in any manner.INFORMATION PRESENTED HERE IS NOT AN OFFER FOR SALE OF ANY EQUITY SHARES OR ANY OTHER SECURITY OF ABNLThis presentation is not for publication or distribution, directly or indirectly, in or into the United States, Canada or Japan. Thesematerials are not an offer of securities for sale in or into the United States, Canada or Japan.<strong>Aditya</strong> <strong>Birla</strong> <strong>Nuvo</strong> LimitedRegd. Office: Indian Rayon Compound, Veraval – 362 266 (Gujarat)Corporate Office: 4th Floor ‘A’ Wing, <strong>Aditya</strong> <strong>Birla</strong> Center, S.K. Ahire Marg, Worli, Mumbai – 400 030Website: www.adityabirlanuvo.com or www.adityabirla.com or Email: nuvo-investors@adityabirla.com46