IRIL Cover Sheet Results FY02 .XLS - Aditya Birla Nuvo, Ltd
IRIL Cover Sheet Results FY02 .XLS - Aditya Birla Nuvo, Ltd
IRIL Cover Sheet Results FY02 .XLS - Aditya Birla Nuvo, Ltd

You also want an ePaper? Increase the reach of your titles
YUMPU automatically turns print PDFs into web optimized ePapers that Google loves.
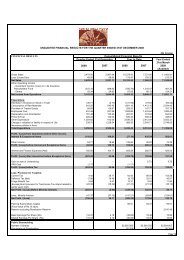
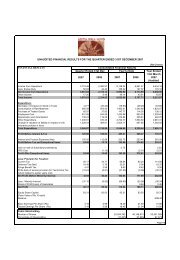
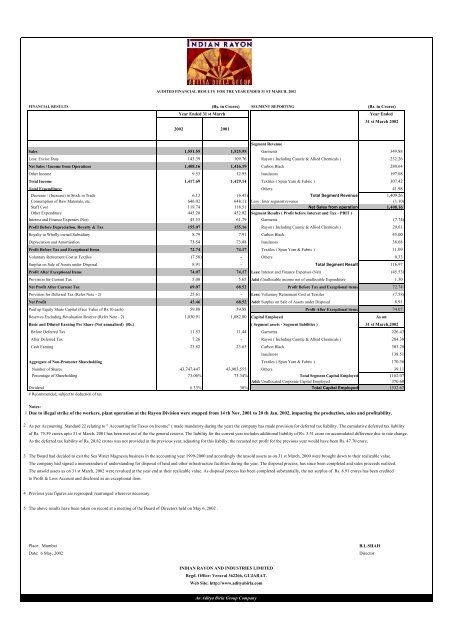
AUDITED FINANCIAL RESULTS FOR THE YEAR ENDED 31 ST MARCH, 2002FINANCIAL RESULTS (Rs. in Crores) SEGMENT REPORTING (Rs. in Crores)Year Ended 31 st March2002 2001Year Ended31 st March 2002Segment RevenueSales 1,551.55 1,525.95 Garments 349.88Less: Excise Duty 143.39 109.76 Rayon ( Including Caustic & Allied Chemicals ) 232.26Net Sales / Income from Operations 1,408.16 1,416.19 Carbon Black 280.64Other Income 9.53 12.95 Insulators 197.08Total Income 1,417.69 1,429.14 Textiles ( Spun Yarn & Fabric ) 307.42Total Expenditure: Others 41.98Decrease / (Increase) in Stock in Trade 6.13 (6.45) Total Segment Revenue 1,409.26Consumption of Raw Materials, etc. 646.02 648.11 Less : Inter segment revenue (1.10)Staff Cost 119.74 118.51 Net Sales from operation 1,408.16Other Expenditure 445.20 452.02 Segment <strong>Results</strong> ( Profit before Interest and Tax - PBIT )Interest and Finance Expenses (Net) 45.53 61.79 Garments (7.74)Profit Before Depreciation, Royalty & Tax 155.07 155.16 Rayon ( Including Caustic & Allied Chemicals ) 29.61Royalty to Wholly-owned Subsidiary 8.79 7.91 Carbon Black 45.00Depreciation and Amortisation 73.54 73.08 Insulators 38.68Profit Before Tax and Exceptional Items 72.74 74.17 Textiles ( Spun Yarn & Fabric ) 11.09Voluntary Retirement Cost at Textiles (7.58) - Others 0.33Surplus on Sale of Assets under Disposal 8.91 - Total Segment Result 116.97Profit After Exceptional Items 74.07 74.17 Less: Interest and Finance Expenses (Net) (45.53)Provision for Current Tax 5.00 5.65 Add :Unallocable income net of unallocable Expenditure 1.30Net Profit After Current Tax 69.07 68.52 Profit Before Tax and Exceptional items 72.74Provision for Deferred Tax (Refer Note - 2) 25.61 - Less: Voluntary Retirement Cost at Textiles (7.58)Net Profit 43.46 68.52 Add: Voluntary Surplus on Retirement Sale of Assets Cost under at Textiles Disposal 8.91Paid up Equity Share Capital (Face Value of Rs.10 each) 59.88 59.88 Profit After Exceptional items 74.07Reserves Excluding Revaluation Reserve (Refer Note - 2) 1,030.91 1,082.80 Capital Employed As onBasic and Diluted Earning Per Share (Not annualised) (Rs.) ( Segment assets - Segment liabilities ) 31 st March,2002Before Deferred Tax 11.53 11.44 Garments 226.43After Deferred Tax 7.26 - Rayon ( Including Caustic & Allied Chemicals ) 284.38Cash Earning 23.82 23.65 Carbon Black 303.28Insulators 138.51Aggregate of Non-Promoter Shareholding Textiles ( Spun Yarn & Fabric ) 170.36Number of Shares 43,747,447 43,903,555 Others 39.11Percentage of Shareholding 73.06% 73.34% Total Segment Capital Employed 1162.07Add: Unallocated Corporate Capital Employed 370.60Dividend # 33% 30% Total Capital Employed 1532.67# Recommended, subject to deduction of taxNotes:1 Due to illegal strike of the workers, plant operation at the Rayon Division were stopped from 14 th Nov. 2001 to 20 th Jan. 2002, impacting the production, sales and profitability.2 As per Accounting Standard 22 relating to " Accounting for Taxes on Income" ( made mandatory during the year) the company has made provision for deferred tax liability. The cumulative deferred tax liabilityof Rs. 75.59 crores upto 31 st March, 2001 has been met out of the the general reserve. The liability for the current year includes additional liability of Rs. 3.51 crore on accumulated difference due to rate change.As the deferred tax liability of Rs. 20.82 crores was not provided in the previous year, adjusting for this liabiliy, the recasted net profit for the previous year would have been Rs. 47.70 crore.3 The Board had decided to exit the Sea Water Magnesia business in the accounting year 1999-2000 and accordingly the unsold assets as on 31 st March, 2000 were brought down to their realizable value.The company had signed a memorandum of understanding for disposal of land and other infrastructure facilities during the year. The disposal process, has since been completed and sales proceeds realized.The unsold assets as on 31 st March, 2002 were revalued at the year end at their realizable value. As disposal process has been completed substantially, the net surplus of Rs. 8.91 crores has been creditedto Profit & Loss Account and disclosed as an exceptional item.4 Previous year figures are regrouped/ rearranged wherever necessary.5 The above results have been taken on record at a meeting of the Board of Directors held on May 6, 2002 .Place: MumbaiDate: 6 May, 2002B.L.SHAHDirectorINDIAN RAYON AND INDUSTRIES LIMITEDRegd. Office: Veraval 362266, GUJARAT.Web Site: http://www.adityabirla.comAn <strong>Aditya</strong> <strong>Birla</strong> Group Company
PRESS RELEASE Mumbai, 6 th May, 2002THE ADITYA BIRLA GROUP’SINDIAN RAYON AND INDUSTRIES LIMITEDMAINTAINS PROFIT FOR THE YEAR ENDED 31ST MARCH 2002DESPITE LOSSES AT RAYON DIVISION DUE TO ILLEGAL STRIKESalesLess: Excise DutyNet SalesFinancial Yearended 31.03.2002(Audited)1551.55143.391408.16(Rs. Crores)Financial Yearended 31.03.2001(Audited)1525.95109.761416.19Profit before Depreciation & Tax 146.28 147.25Depreciation & Amortisation 73.54 73.08Profit before Tax and Exceptional Items 72.74 74.17Exceptional Items (see below) 1.33 -Profit before Tax 74.07 74.17Provision for Current Tax 5.00 5.65Net Profit after Current Tax 69.07 68.52Provision for Deferred Tax 25.61 20.82*Net Profit 43.46 47.70Exceptional items- Voluntary Retirement Cost at Textiles (-) 7.58 -- Surplus on Sale of Assets under disposal 8.91 -* Though deferred tax has not been provided in the Audited Accounts of FY 01, as AS-22 wasnot applicable in that year, for the comparison purpose, figures are recasted.Indian Rayon, a major <strong>Aditya</strong> <strong>Birla</strong> Group company, has reported a turnover of Rs.1552 croresfor the year ended 31 st March, 2002 which is marginally up by 2% as compared to Rs.1526crores in the previous year. Exports stood at Rs.387 crores against Rs.397 crores in last year.The Company has been able to maintain gross profit of Rs.146.28 crores (Rs.147.25 crores) andProfit before Tax at Rs.74.07 crores (Rs.74.17 crores) for the financial year 2002 despite theproduction loss on account of the illegal strike at its Rayon Division. The strike lasted from the14 th of November 2001 until the 20 th of January 2002. The losses on this account have neutralisedthe impact of the improved operating performance of its various divisions. Insulators and CarbonBlack in particular have reported marked improvements in profitability.To ensure the company’s competitiveness and its sustainable future, the company had to recourseto rightsizing of its operations. Consequently the company offered a VRS to 370 employees at itstextile division at Rishra. This has cost Indian Rayon Rs.7.58 crores during the year. The impactof these factors has been partially off set by a surplus of Rs.8.91 crores generated through thesubstantial disposal of its Sea Water Magnesia plant.1
DividendThe Board of Directors have recommended a dividend of 33% as compared to 30% paid in theprevious year. The dividend will absorb Rs.19.76 crores.Division-wise PerformanceA sectoral overview of the production, sales volume and turnover is as indicated:Products Unit FY 2002 FY 2001Production Volumes :-Viscose Filament Yarn MT 12,253 15,496Carbon Black MT 93,634 89,739Insulator MT 25,277 25,665Sales Volume & Net Turnover Unit FY 2002 FY 20012Rs.in Crs.Rs. In Crs.Garments Nos. (Lacs) 66.9 350 58.8 326Viscose Filament Yarn (VFY) MT 12,812 205 15,326 226Carbon Black MT 94,504 281 91,735 254Insulators MT 25,183 197 25,691 184Textiles - 307 - 341Madura GarmentsMadura Garments has recorded a turnover of Rs.350 crores, up by 7%. Exports revenue at Rs.50crores vis-à-vis Rs.35 crores in the previous year soared by 44%. The volume of shirts andtrousers rose by 14% compared to the earlier year. Operating margins before advertising expenseshave been maintained at 18.5%.For Madura Garments, the year has been extremely challenging. The acute economic slow down,the plunge in consumer spending, the unexpected excise duty imposition and the intense discountcompetition in the market particularly in the last quarter to liquidate stocks, have collectively putthe division’s profitability under pressure. In view of the market conditions, special salespromotion and advertising spends have gone up substantially, affecting the profitability. The fireat one of the main warehouses just before the peak season for the division was a setback as well.All of its key brands – Louis Phillipe, Van Heusen, Allen Solly and Peter England continue togrow and extend their leadership position. Madura Garments successfully launched Peter EnglandTrousers, Allen Solly women-wear in Bangalore and Hyderabad, the Louis Phillipe Club Lineand the premium “international traveller”, world-wide range from Van Heusen. The new suitmanufacturing facility set up with Italian technical support is now operational. World classquality suits and Jackets will be made available in the Louis Phillipe and Van Heusen brands.These new products show high promise for the future.To ensure sustainable growth in revenues and earnings Madura Garments will concentrate onleveraging its brand equity optimally to bolster its market presence even further. To bring inenhanced profitability, efficiency improvement and cost reduction will also be ongoing measures.The long term outlook for Madura Garments continues to be positive due to the fundamental shiftfrom tailored clothes to readymade apparel. However the immediate outlook is dependent on therevival of the economy in the country and in the Middle East, which is its major branded exportmarket.
Rayon DivisionConsequent to the labour strike as explained earlier, Rayon Division’s performance was severelyconstrained. Viscose Filament Yarn production at 12,253 MT is lower by 21%. Sales volume at12,812 MT reflects a fall at 16%. On the positive side aggressive marketing combined with entryinto new market segments, helped exports of Rs. 33 crores, as compared to Rs. 30 crores in theearlier year. Realisations at Rs.160 per kg. have risen by 8%, due to the reduced supplies in themarket. Operating efficiencies were further optimised during the year. However, the blow-down/ start up losses during the strike period adversely affected the consumption ratios. Operationshave been stabilised with highest quality levels being recorded in March 2002.A world-wide rationalisation of capacities and closure of plants in Europe, Japan and Koreaaugurs well for growth on the export front. In India, matured demand and cheaper productsubstitutes pose a challenge. To sustain its leadership position, the division will aggressivelyexploit export opportunities and foray into value added new markets. Alongside raising itsproduct quality and providing superior customer support services continue. Against thisbackdrop, the outlook for VFY is positive.Carbon Black DivisionThe Carbon Black division’s turnover at Rs.281 crores, an increase of 10% over that ofRs.254 crores achieved in the previous year, is indeed impressive. The division picked upsales after the first two difficult quarters. Realisations were up by 7% at Rs.29681 per ton.Aggressive marketing efforts, leading to a successful penetration in new Asian markets andthe locational advantage afforded by its Chennai Plant led to a 31% surge in export at Rs.41crores.The division continues to operate in a very stressful environment due to the recession in theautomobile sector and in the replacement tyre market too. The division is increasinglyworking towards reduced dependence on the automobile sector and expansion of marketsespecially in the non-tyre segments. While channelising its energies for the development ofnew applications for Carbon Black, it is concentrating on exports for better volumes.Introduction of speciality grades of value added carbon black products are on the anvil.Simultaneously cost reduction through tightening of consumption norms, lowering ofdistribution costs through superior logistics and better operating efficiencies should stoke thegrowth of this sector. The long term outlook is encouraging.Insulator DivisionThe Insulator division’s performance continues to be commendable. Renewed product mix witha sharp focus on higher value added equipment porcelain, improved yield and relentless costsaving initiatives have boosted its revenues and earnings. Sales at Rs.197 crores have increasedby 7% compared to Rs. 184 crores in the previous year. Sales volume at 25183 per ton has beenmaintained. Consequent to the shift in the product mix, production at 25277 tonnes was 2%lower compared to the last year (25665 tonnes). Realisation at Rs.78211 per ton is up by 9%compared to Rs.71480 per ton in the previous year. Exports at Rs. 87 crores are down by 9% (Rs.96 crores) on account of the global recession and constraints faced in the power sector. However,the outlook for the insulator business seems promising, given the pronouncement of thegovernment to meet the shortfall in the power sector in the 10 th and 11 th Plan and its intent togenerate an additional 1 lac MW power by 2010.Textiles DivisionThe Textile division’s turnover at Rs.307 crores as against Rs.341 crores has decreased by 10%mainly due to the right sizing of fabric operations and suspension of the Hosepipe business.Export declined by 14% as well. Due to the global recession in the Textile sector and higher inputcost for flax and worsted yarn, operating profit margins have declined from 13% to 10%.3
To sustain its performance, the division has taken several steps for cost control such as, VRS,reduction in energy cost, etc. The division has successfully implemented VRS and reduced 370employees entailing a cost of Rs.7.58 crores. The division is focusing on the business of woolprocessing, value added yarns and flax fabrics where the Company enjoys a niche market.Future OutlookThough the year has been extremely difficult for Indian Rayon, the company does look to bettergrowth prospects in future. This growth will be fuelled by five factors, viz.,• through improved revenues and profitability of its garment business,• penetration of VFY into newer markets,• enhancement of revenues and profitability from its insulator divisions,• better performance of its Carbon Black division with value added products and new grades,and• benefits consequent to rightsizing of its textile division and modernisation of flax fabrics andworsted yarn operations.Overall, the Company’s outlook for the future is positive.@@@@@4
Performance Review2001-0202Indian Rayon and Industries LimitedMumbai, 6 th May 2002
Agendaq Key Developments of Q4q Financial result for the quarterq Financial Result for FY 2002q Segment wise performance & the outlook2
Key Developments in Q4q Operations resumed at VFY Plant at Veraval after 67 days illegalstrike‣ Operations have been stabilised, recording highest quality level inMar-02q Power plant break down at Veraval for one month‣ Working of Chemicals business affectedq Recessionary Pressures and Poor Consumer Sentiments post9/11 had telling impact on Garments business in Q4q Carbon Black shows signs of recoveryq Insultator performance remained impressive‣ Emerged as key contributorq Textiles show mixed signals, exited Hose Pipe segmentq Sea Water Magnesia plant disposal completed successfully3
Turnover TrendRs. Crores40035030025020015010050-353 342 363 373 330Q4 FY01 Q1 <strong>FY02</strong> Q2 <strong>FY02</strong> Q3 <strong>FY02</strong> Q4 <strong>FY02</strong>GarmentsTextilesInsulatorCarbon BlackVFYOthers4
Turnover and Exports MixTextiles22%Rs. CroresParticulars Turnover ExportsQ4 <strong>FY02</strong> Q4 FY01 Change (%) Q4 <strong>FY02</strong> Q4 FY01 Change (%)Garments 61.9 71.9 (14) 6.6 10.6 (38)VFY 41.3 70.1 (41) 3.9 9.1 (57)Carbon Black 77.1 60.1 28 12.0 10.9 10Insulator 65.0 59.8 9 35.1 46.5 (25)Textiles 73.8 80.8 (9) 40.8 36.0 13Others 11.0 10.4 5 9.2 8.9 3Total 330.2 353.1 (6) 107.6 122.0 (12)Turnover Q4 <strong>FY02</strong>Others3%Garments19%Textiles23%Turnover Q4 FY01Others3%Garments20%Insulator20%Carbon Black23%VFY13%Insulator17%Carbon Black17%VFY20%5
Q4 <strong>FY02</strong> – Financial PerformanceRs. CroresParticulars Q4 <strong>FY02</strong> Q4 FY01 Change (%)Gross Turnover 363.7 381.4 (5)Less: Excise Duty 33.5 28.3 18Net Turnover 330.2 353.1 (6)Other Income 3.3 4.6 (28)Operating Profit (PBDIT) 45.0 59.7 (25)Interest 6.7 14.4 (53)Gross Profit (before Royalty) 38.3 45.3 (15)Royalty 1.4 1.7 (18)Depreciation/ Amortisation 18.3 19.1 (4)Profit Before Tax and Exceptional Items 18.6 24.5 (24)VRS at Textiles 0.2 - -Surplus in respect of assets held for disposal 8.9 - -Profit after Exceptional Items 27.3 24.5 11Provision for Current Tax 2.0 2.1 (5)Net Profit After Current Tax 25.3 22.4 13Provision for Deferred Tax 10.5 6.8 55Net Profit 14.8 15.6 (5)EPS (Rs.) – Before Deferred Tax 16.9 15.0 13EPS (Rs.) – After Deferred Tax 9.9 10.4 (5)6
PBDIT MixRs. Crores6555453525155PBDIT Q4 <strong>FY02</strong> Q4 FY01Rs. CroresChange (%)Garments (4.4) 8.3 (153)VFY 10.2 13.3 (24)Carbon Black 15.5 11.1 40Insulator 15.0 10.8 39Textiles 7.3 12.5 (41)Others 1.4 3.9 (63)Total 45.0 59.8 (25)60 45OthersTextilesInsulatorCarbon BlackVFYGarments(5)Q4 FY01Q4 <strong>FY02</strong>7
Q4 <strong>FY02</strong> – Performance Highlightsq Net revenues declined from Rs. Rs. 353.1 crores to Rs. 330.2 crores‣ Illegal strike at Rayon plant and consequent 41% fall in divisional revenues‣ Poor consumer spending and intense competition led to 14% lower revenues atGarments‣ Textiles revenues lower by 9% on increased demand pressures‣ Impact mitigated partly by superior performance of Carbon Black and Insulatorsv Divisional revenues up by an impressive 28% and 9% respectivelyq Operating Profit down 25% on mixed performance of key businesses‣ Strike and restart costs eroded Rayon profits significantly‣ Profitability of Garments and Textiles suffered on demand pressures‣ Insulator and Carbon Black have been key contributors in mitigating the impact atleast partlyq Profit before exception items and Tax thus declined 24% to Rs. 18.6 croresq Sea Water Magnesia plant disposal completed, resulted in a write-back of Rs.8.9 croresq Net profit after current taxes thus higher by 13% at Rs. 25.3 croresq Provision of Rs. 10.5 crores made for deferred tax liabilities including Rs 3.5crores on account of higher rate8
Turnover Trend1,6001,072 1,416 1,408Rs. Crores1,4001,2001,000800600400200-FY 2000 FY 2001 FY 2002GarmentsTextilesInsulatorCarbon BlackVFYOthers9
Turnover and Exports MixTextiles22%Rs. CroresParticulars Turnover ExportsFY 2002 FY 2001 Change (%) FY 2002 FY 2001 Change (%)Garments 349.9 325.5 7 49.8 34.6 44VFY 232.2 263.5 (12) 32.7 29.9 9Carbon Black 280.5 254.3 10 41.4 31.6 31Insulator 197.0 183.6 7 87.3 96.3 (9)Textiles 306.6 341.0 (10) 142.4 165.5 (14)Others 42.0 48.2 (13) 33.1 39.4 (16)Total 1,408.2 1,416.2 (1) 386.7 397.3 (3)Turnover FY2002Turnover FY2001OthersGarmentsOthers3% Garments25%3%Textiles23%24%Insulator14%Carbon Black20%VFY16%Insulator13%Carbon Black18%VFY19%10
FY2002 – Financial PerformanceRs. CroresParticulars FY2002 FY2001 Change (%)Gross Turnover 1,551.6 1,526.0 2Less: Excise duty 143.4 109.8 31Net Turnover 1,408.2 1,416.2 (1)Other Income 9.5 12.9 (26)Operating Profit (PBDIT) 200.6 217.0 (8)Interest 45.5 61.8 (26)Gross Profit (before Royalty) 155.1 155.2 (0)Royalty 8.8 7.9 11Depreciation/ Amortisation 73.5 73.1 1Profit Before Tax and Exceptional ItemsExceptional Items (Net)72.81.374.2-(2)-Profit after Exceptional Items 74.1 74.2 (0)Provision for Current Tax 5.0 5.7 (12)Net Profit After Current Tax 69.1 68.5 1Provision for Deferred Tax 25.6 20.8 23Net Profit 43.5 47.7 (9)EPS (Rs.) – Before Deferred Tax 11.5 11.4 1EPS (Rs.) – After Deferred Tax 7.3 8.0 (9)11
PBDIT MixRs. CroresPBDIT FY 2002 FY 2001 Change (%)Garments 14.2 20.3 (30)VFY 49.5 59.3 (17)Carbon Black 57.9 51.3 13Insulator 44.8 31.8 41Textiles 30.5 44.2 (31)Others 3.8 10.0 (63)Total 200.6 216.9 (8)PBDIT FY2002PBDIT FY2001Textiles15%Others2%Garments7%VFY25%Textiles20%Others5%Garments9%VFY27%Insulator22%Carbon Black29%Insulator15%Carbon Black24%12
FY2002 – Performance Highlightsq Net Turnover at Rs. 1408.2 Cr. is marginally lower‣ Higher sales clocked by Garments, Carbon Black and Insulators‣ Rayon sales adversely affected by strike‣ Textiles revenue is lowerq Operating profit down 8% - mixed performance by businesses‣ Insulators performance is remarkable with 41% jump in operating profits on theback of better product mix‣ Carbon Black operating profit is higher by 13% due to better realization‣ VFY operating performance impacted by strike‣ Higher advertisement support impacted bottom line of Garments‣ Textiles remains affected by weak economic conditions and higher input costsq Exceptional Items‣ VRS cost of Rs. 7.6 Crores at Textiles division provided‣ Gain of Rs. 8.9 crores on account of Write-back of Surplus in respect of assets heldfor disposalq Net Profit after Tax up 1% at Rs. 69.1 croresq Provision of Rs. 25.6 crores made towards deferred tax13
Business PerformanceFor the Full Year - <strong>FY02</strong>
GarmentsRs. CroresParticulars Unit Q4 <strong>FY02</strong> Q4 FY01 FY2002 FY2001 Change (%)Sales Volumes Lac Pcs. 12.5 13.0 66.9 58.8 14Turnover Rs. Crs. 61.9 71.9 349.9 325.5 7Operating Profit* Rs. Crs. 4.1 12.0 64.9 59.3 9OPM* % 6.6 16.7 18.5 18.2Advt. Expenses Rs.Crs. 8.4 3.7 50.7 39.0 30PBDIT Rs.Crs. -4.4 8.3 14.2 20.3 (30)Royalty Rs.Crs. 1.4 1.7 8.8 7.9 11PBDIT after Royalty Rs.Crs. -5.8 6.6 5.4 12.4 (56)PBIT Rs.Crs. -9.1 3.3 -7.7 -0.3Capital Employed Rs.Crs. 226.4 213.5 6ROCE % (3.4) (0.1)*Operating Profit before Advertising Expenses15
Garments– Performance at a Glance2220109.8120.0110.0Lac Pieces18161412108671.913.592.217.489.514.871.913.085.215.493.019.020.261.912.5100.090.080.070.060.050.040.030.0Turnover (Rs. Crores)420.0210.00Q1 FY01 Q2 FY01 Q3 FY01 Q4 FY01 Q1 <strong>FY02</strong> Q2 <strong>FY02</strong> Q3 <strong>FY02</strong> Q4 <strong>FY02</strong>0.0FY 2001Sales VolumeTurnoverFY 200216
Garments– Performance Reviewq Industry environment not conducive‣ Deepening recessionary pressures led to sharp fall in consumer spending‣ Rising market inventories and growing supplies against weak demand intensifiedcompetitive pressures‣ Higher discounts, increased promotion and advertising effortsq Performance suffered as a result significantly during Q4 <strong>FY02</strong>‣ Volumes down 4% and revenues lower by 14%‣ Higher discounts and stock liquidation efforts dragged operating margins down‣ Strengthened advertisement support needed to sustain strong performance of keybrandsq Satisfactory performance for the full year, despite a weak quarter‣ Enabled by success of our proactive marketing strategiesv Strengthening of distribution networkv Renewed focus on contract exportsv Introduction of new brand extensions/productsv National launch of Peter England Trousersv Test launch of Allen Solly ‘Women’s Wear’v Louis Philippe ‘Clubline’ range of premium evening causalsv ‘International Traveller’ world wear range from Van Heusen17
Garments– Performance Review (Contd(. .)q Sales volumes up 14% YoY‣ Improving market share and strong performance of all key brands‣ Success of new brands and products introduced during the year‣ Near doubling of exportsq Revenues grew only by 7%, however reflects higher discounts andincreased share of mid-priced brandsq Operating margins improved slightly at 18.5% despite fresh excise burden,discount competition and excessive sales promotional requirementsq Advertisement expenses grew by 30% YoY to 14% of sales‣ Strengthen brand equity to ensure superior volumes even in current weakmarket‣ Brand investment in the overseas markets‣ New inititatives like Women’s Wear and Peter England Trousers‣ New retail formats in the domestic and overseas markets18
Garments– Outlookq Promising long term growth prospects‣ Fundamental shift in consumer preference from tailored to ready-to-wear productsand increasing brand consciousness to ensure 15% annual growthq Short term prospects affected - sagging consumer confidence & poor spending‣ Improvement likely, but is contingent on economic recovery‣ Reduced excise duty should strengthen prospects furtherq Madura Garments will ensure profitable growth through relentless focus ondelivering consumer value, building brands and improving efficiencies‣ Leverage strong brand image, design and product development capabilities‣ Strengthen distribution network‣ Focused advertisement efforts aimed atv Supporting Gestated Brands (LP, VH, AS & PE) to deliver high returnsv Investing in new segments and brand extensions which will incur costs now but offerlong term value viz: AS Womenswear, Suits/ Jackets and SF Jeanswearv Building Brand Equity for the newly introduced retail formats to complementaggressive geographic expansion and qualitative improvements in retail operations‣ Improve presence in the international markets‣ Flush-out supply chain inefficiencies and tighten cost structure19
Viscose Filament Yarn (VFY)Rs. CroresParticulars Unit Q4 <strong>FY02</strong> Q4 FY01 FY2002 FY2001 Change (%)Capacity Tons 3,750 3,750 15,000 15,000 -Production Tons 2,460 3,820 12,253 15,496 (21)Capacity Utilization % 65.6 101.9 81.7 103.3Sales Volumes Tons 2,241 3,999 12,812 15,326 (16)VFY Realisation Rs./ Kg. 163 153 160 148 8Turnover - VFY Rs. Crs. 36.5 61.0 205.4 226.5 (9)-Chemical Rs. Crs. 4.9 9.1 26.8 36.9 (27)Total Turnover Rs. Crs. 41.3 70.1 232.2 263.5 (12)PBDIT Rs. Crs. 10.2 13.3 49.5 59.3 (17)OPM % 24.6 19.0 21.3 22.5PBIT Rs. Crs. 5.1 7.7 29.6 39.8 (26)Capital Employed Rs. Crs. 284.4 309.7 (8)ROCE % 10.4 12.920
VFY – Performance at a GlanceTons500040003000200014336961453581149405015339991553808162 164 163418925742241165145125105Realisation (Rs./ Kg.)1000850Q1 FY01 Q2 FY01 Q3 FY01 Q4 FY01 Q1 <strong>FY02</strong> Q2 <strong>FY02</strong> Q3 <strong>FY02</strong> Q4 <strong>FY02</strong>65FY 2001Sales VolumeRealisationFY 200221
VFY – Performance ReviewqqManagement initiatives to improve quality, acquire premium market and cost efficienciesgave excellent results in first half67 days illegal strike impacted operations, which have subsequently been stabilisedrecording highest quality level in Mar-02q In Q4 FY 02‣ Plant restarted on 21st Jan.,and stabilised operations by end-Feb.‣ Restart costs dragged business profits significantly‣ Power plant breakdown resulted in poor performance of Chemicals businessqPerformance for full year skewed‣ Production down 21% to 12,253 tonnes, limiting sales volumes‣ Sales down 16% YoY to 12,812 tonnesv Exports maintained consciously to protect long term interestsv Domestic volumes lower by 20% YoYqVFY average realisation improved by 8% YoY‣ Benefiting from better quality & changing product mix – in the first three quartersv Domestic realisation higher by 9%qqPositive factors‣ Softening of global pulp prices and good monsoon improving water availability at VeravalBusiness margins declined from 22.5% to 21.3% due to lower volumes and exceptional costs22
VFY – OutlookqqPlant operations stabilised, poised to benefit from improvements in sector prospectsChallenging industry outlook, both domestic and exports‣ Domestic demand to improve with positive change in fashion trends and recovery in textilessector‣ Impact of increasing supplies and intense competition from China, in select denier segments,will however need to be watched‣ Better Export prospects with quality conscious customers‣ Pricing pressures to remain‣ Softer pulp prices to help improve cost structureq<strong>IRIL</strong> will focus on‣ Regaining market dominancev Improvement in product quality and increased share of 1st quality yarnv Enhanced focus on quality conscious premium segmentv Backup technical assistance and customer support services‣ Seize export opportunitiesv Position as premium product and ensure premium pricing‣ Tighten cost structure furtherv Improvement in shop floor efficiencies to cut costsv Improved yield and reduction in consumption of utilitiesv Achieve higher production23
Carbon BlackRs. CroresParticulars Unit Q4 <strong>FY02</strong> Q4 FY01 FY2002 FY2001 Change (%)Capacity Tons 27,500 27,500 110,000 110,000 -Production Tons 26,185 20,442 93,634 89,739 4Capacity Utilization % 95.2 74.3 85.1 81.6Sales Volumes Tons 27,206 20,307 94,504 91,735 3Realisation Rs./ Ton 28,325 29,576 29,681 27,719 7Turnover Rs. Crs. 77.1 60.1 280.5 254.3 10PBDIT Rs. Crs. 15.5 11.1 57.9 51.3 13OPM % 20.1 18.5 20.6 20.2PBIT Rs. Crs. 12.3 7.8 45.0 38.6 17Capital Employed Rs. Crs. 303.3 334.7 (9)ROCE % 14.8 11.524
Carbon Black– Performance at a Glance350003500030000264032592329103 2957630986 30716291242832530000Tons25000200001500010000216682454625214203071979323597239082720625000200001500010000Realisation (Rs./Ton)500050000Q1 FY01 Q2 FY01 Q3 FY01 Q4 FY01 Q1 <strong>FY02</strong> Q2 <strong>FY02</strong> Q3 <strong>FY02</strong> Q4 <strong>FY02</strong>0FY 2001Sales VolumeRealisationFY 200225
Carbon Black– Performance ReviewqSignificant improvement in quarterly performance‣ Sequential improvement continue even during Q4 <strong>FY02</strong>‣ Sales volumes grew by 34% YoY despite demand pressure in user industriesv Auto industry shows early signs of recovery, but 4-wheeler and HCV segments buck the trendv Volume growth driven by increased sales in the non-tyre segment. Non-tyre sales more thandouble in Q4<strong>FY02</strong>v Aggressive marketing efforts and competitive pricing strategies have been key contributors‣ Revenues up 28% as a result and is despite 4% lower average realisation in Q4 <strong>FY02</strong>qStrong full year performance, reflects improving trend over the quarters‣ Higher production and sales copuled with superior realisation resulted in impressiveperformance‣ Sales volumes up marginally, driven by 18% higher exportsv Locational advantage of Chennai Plant exploitedv Aggressive marketing under “<strong>Birla</strong> Carbon” brand showing resultsv Successful penetration in the new export markets of Asia‣ Realisation up 7% YoY; Revenues higher by 10% at Rs.280.5 crores‣ Operating margins improved marginallyv CBFS prices remained range boundv Better product mix, product rationalisation and superior services brought higher realisationv Tight control over input cost and overheads contributed further26
Carbon Black– Outlookq Promising long term outlook, though immediate term outlook is uncertain‣ Auto sector is showing early signs of recovery, but largest user segments yet toshow definite signs of improvement‣ Profitability will be under pressurev Continued pressure on realisation due to weak demand and cheaper importsv Lower import duty on finished goods to exert further pressurev Fresh volatility in global CBFS prices likely on the back of rising trend in crude oilpricesq Company’s strategy to ensure stable growth going forward‣ Increase exports by leveraging logistic strengths and focussed marketing efforts‣ Strengthen presence in the non-tyre application segments‣ Consolidate position further in the Tyre sector through focus on quality andcustomer service‣ Commercialise new grades developed in house27
InsulatorsRs. CroresParticulars Unit Q4 <strong>FY02</strong> Q4 FY01 FY2002 FY2001 Change (%)Capacity Tons 8,500 8,500 34,000 34,000 -Production Tons 6,289 6,117 25,277 25,665 (2)Capacity Utilization % 74.0 72.0 74.3 75.5Sales Volumes Tons 7,694 7,808 25,183 25,691 (2)Realisation Rs./ Ton 84,494 76,526 78,211 71,480 9Turnover Rs. Crs. 65.0 59.8 197.0 183.6 7PBDIT Rs. Crs. 15.0 10.8 44.8 31.8 41OPM % 23.1 18.0 22.7 17.3PBIT Rs. Crs. 13.6 9.3 38.7 25.6 51Capital Employed Rs. Crs. 138.5 130.3 6ROCE % 27.9 19.628
Insulators– Performance at a Glance1000010000084494Tons8000600040006926549786625867347253361717652678086854849607630850077939375237694800006000040000Realisation (Rs./Ton)2000200000Q1 FY01 Q2 FY01 Q3 FY01 Q4 FY01 Q1 <strong>FY02</strong> Q2 <strong>FY02</strong> Q3 <strong>FY02</strong> Q4 <strong>FY02</strong>0FY 2001Sales VolumeRealisationFY 200229
Insulators– Performance Reviewq Excellent overall performance even during Q4 <strong>FY02</strong>‣ Higher domestic sales volumes‣ Positive change in product mix‣ Higher realisation and‣ Enhanced marginsq Demonstrated remarkable improvement in performance for the full year as well‣ Sales volumes maintained flat at 25,183 tonnes‣ Average realisation higher by 9% with better product mix‣ Turnover increased by 7% to Rs. 197 croresv Exports revenue down 9% YoY, but impact offset by higher domestic salesv Domestic sales up 26% benefiting from spurt in distribution & transmission activitiesin power sector and successful acquisition of new clients‣ Operating Margins up from 17.3% to 22.7% in <strong>FY02</strong> on the back ofv Higher realisationv Reduced input costs andv Improved yields30
Insulators– Outlookq Sector outlook promising‣ Development of power infrastructure gaining momentum in India and Abroad‣ The recent announcement to meet the demand gap of power in 10th & 11th Plan bygovernment generating additional power of 1 lac MW by 2010, will lead toimprovement in demand for insulators‣ Global markets present exciting opportunitiesv European manufacturer cutting production due to high costsv Large demand potential from underdeveloped African and Asian nationsq <strong>IRIL</strong> will focus on‣ Quality conscious user segments in thev Equipment porcelain and high end transmission products market‣ Strengthening of exportsv Leverage existing strong relationship with OEM’sv Deeper penetration in existing markets and entry into new marketsv Focus on high rating products in the quality conscious segments‣ Insulator’s segments will remain a priority31
TextilesRs. CroresParticulars Unit Q4 <strong>FY02</strong> Q4 FY01 FY2002 FY2001 Change (%)Sales - Worsted Tons 928 868 3,782 3,392 11Flax Yarn Tons 155 150 604 737 (18)Synthetic Tons 2,613 2,494 10,184 9,919 3Total Volumes Tons 3,696 3,512 14,570 14,048 4Turnover - Worsted Rs. Crs. 31.5 30.6 123.0 118.8 4Flax Yarn Rs. Crs. 5.8 5.6 21.2 28.5 (26)Synthetic Rs. Crs. 25.4 27.8 105.1 114.4 (8)Others Rs. Crs. 11.2 16.8 57.3 79.3 (28)Total Turnover Rs. Crs. 73.8 80.8 306.6 341.0 (10)Operating Profit* Rs. Crs. 7.3 12.5 30.5 44.2 (31)OPM % 9.9 15.4 10.0 13.0PBIT Rs. Crs. 2.5 7.6 11.1 24.3 (54)Capital Employed Rs. Crs. 170.4 192.7 (12)ROCE % 6.5 12.6* Operating Profit before VRS32
Textiles – Performance Reviewq Exit from hose pipe segmentq Right sizing of Fabrics operation and laid thrust on Flax and SpecialityFabrics.‣ Sales volumes maintainedv Worsted yarn volumes up 11% on increased sale of “Wool-Tops”v Reflects conscious strategy followed to reap benefits of market opportunities‣ Business revenue down 10% YoY to Rs. 306.6 Cr. reflecting right sizing of Fabricsoperation, suspension of hosepipe activity and also continued pressure onrealisationv Flax Yarn and Synthetic segments witnessed fall in realisation‣ Operating Margins declined from 13% to 10%v Higher input costs for Flax Yarn and Worsted Yarnv Lower realisation33
Textiles - Outlookq Business Outlook remains challenging‣ <strong>IRIL</strong> to benefit fromv Improved Worsted Yarn performance on the back of renewed focus on specialityproductsv Improved profitability from renovated Flax Spinning equipmentv Increasing focus on Flax and speciality Fabrics and reduced dependence on lowprofitable Synthetic segmentv Benefits arising from VRSv Recovery of Global Economy and consequent improvement in realisation andexports34
To Summarise. . .q Suffered on account of illegal strike at Veraval and recessionary pressures inkey growth businesses that led to mixed performance from key businessesq Confident of superior performance in the coming year‣ Global economy showing early signs of recovery, key businesses to benefitsignificantly given their intrinsic linkage to the economic activity‣ Garments to emerge as key beneficiary, revenues and profitability set to grow‣ Regaining of market share and stable operations at VFY to add further strength‣ Carbon Black showing signs of recovery and to gain further momentum‣ Impressive improvement in Insulator performance to continue‣ Benefits of rightsizing efforts at Textiles to accrueOur endeavour will be to deliver superior performancein the quarters to come35
Thank You
Snapshot – FY2002Rs. CroresParticulars FY2002 FY2001 FY2000Equity 59.9 59.9 59.9Net Worth 1,110.5 1,067.1 1,093.9Long Term Debt 265.4 304.6 311.3Short Term Debt 176.4 150.6 270.7Total Debts 441.8 455.2 582.0Capital Employed* 1,552.3 1,522.3 1,675.9Net Block 772.5 809.2 861.4Net Working Capital 340.0 369.4 470.3Investments 439.8 343.8 344.2ROCE (at PBIT) (%) 7.6 8.9 6.6Book Value (Rs.) 185.5 178.2 182.7Debt Equity (%) 39.8 42.7 53.2Long Term Debt Equity (%) 23.9 28.5 28.5* Before proposed dividend37
Capital Employed – FY2002Rs. CroresParticulars Capital Employed PBIT ROCE (%)FY 2002* FY 2001 FY 2002 FY 2001 FY 2002 FY 2001Garments 226.4 213.5 (7.7) (0.3) (3.4) (0.1)Rayon 284.4 309.7 29.6 39.8 10.4 12.8Carbon Black 303.3 334.7 45.0 38.6 14.8 11.5Insulators 138.5 130.3 38.7 25.6 27.9 19.6Textiles 170.4 192.7 11.1 24.3 6.5 12.6Others 39.1 48.7 0.3 0.7 0.9 1.5Total Operating Assets 1,162.1 1,229.6 117.0 128.7 10.1 10.5Corporate Assets 390.2 292.7 1.3 7.3 0.3 2.5Total 1,552.3 1,522.3 118.3 135.9 7.6 8.9* Before proposed dividend38
Consolidated FinancialsRs. CroresParticularsInvestment Revenue PBITPAT(beforeDeferred Tax)PAT (afterDeferred Tax)<strong>IRIL</strong> 1,408.2 119.6 69.1 43.4Insurance 105.0 8.4 (36.1) (36.3) (36.3)Software 100.3 37.6 (10.6) (10.9) (10.9)Overseas Subsidiary 3.7 3.0 (0.8) (0.8)Investment Companies 11.4 1.0 0.7 0.5 0.5Total 220.4 1,455.2 76.6 21.6 (4.1)Minority Interest (14.2) (14.2) (14.2)Share of <strong>IRIL</strong> Group 90.8 35.8 10.1EPS for <strong>IRIL</strong> Group 6.0 1.739