Q3 results - Aditya Birla Nuvo, Ltd
Q3 results - Aditya Birla Nuvo, Ltd
Q3 results - Aditya Birla Nuvo, Ltd

You also want an ePaper? Increase the reach of your titles
YUMPU automatically turns print PDFs into web optimized ePapers that Google loves.
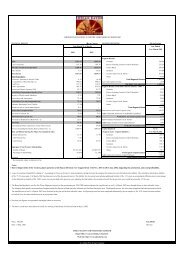
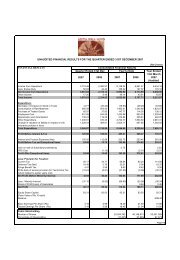
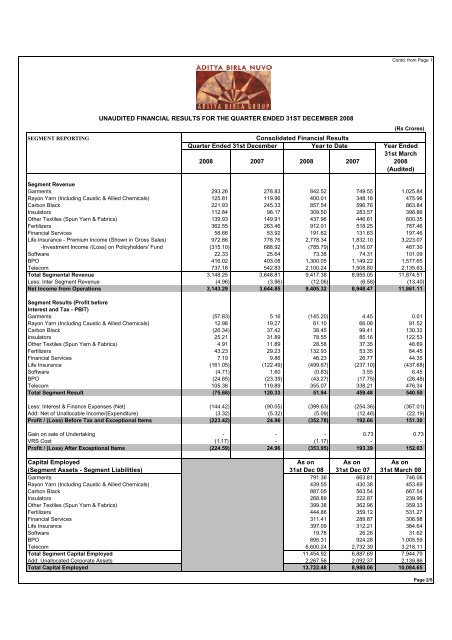
Contd. from Page 1SEGMENT REPORTINGUNAUDITED FINANCIAL RESULTS FOR THE QUARTER ENDED 31ST DECEMBER 2008Consolidated Financial ResultsQuarter Ended 31st DecemberYear to Date(Rs Crores)Year Ended31st March2008 2007 2008 2007 2008(Audited)Segment RevenueGarments 293.26 278.83 842.52 749.55 1,025.84Rayon Yarn (Including Caustic & Allied Chemicals) 125.81 119.96 400.01 348.18 475.96Carbon Black 221.93 245.33 857.54 596.76 863.84Insulators 112.84 98.17 309.50 283.57 398.86Other Textiles (Spun Yarn & Fabrics) 139.93 149.91 437.96 446.61 600.35Fertilizers 362.55 263.46 912.01 518.25 787.46Financial Services 58.66 53.92 191.62 131.63 197.46Life Insurance - Premium Income (Shown in Gross Sales) 972.86 778.76 2,778.34 1,832.10 3,223.07-Investment Income /(Loss) on Policyholders' Fund (315.10) 688.92 (785.79) 1,316.07 487.30Software 22.33 25.64 73.38 74.31 101.09BPO 416.02 403.08 1,300.05 1,149.22 1,577.65Telecom 737.16 542.83 2,100.24 1,508.80 2,135.63Total Segmental Revenue 3,148.25 3,648.81 9,417.38 8,955.05 11,874.51Less: Inter Segment Revenue (4.96) (3.96) (12.06) (6.58) (13.40)Net Income from Operations 3,143.29 3,644.85 9,405.32 8,948.47 11,861.11Segment Results (Profit beforeInterest and Tax - PBIT)Garments (57.83) 5.16 (145.20) 4.45 0.01Rayon Yarn (Including Caustic & Allied Chemicals) 12.98 19.27 61.10 66.08 91.52Carbon Black (26.34) 37.42 38.45 99.41 130.32Insulators 25.21 31.89 78.55 85.16 122.53Other Textiles (Spun Yarn & Fabrics) 4.91 11.89 28.58 37.35 48.69Fertilizers 43.23 29.23 132.93 53.35 84.45Financial Services 7.19 9.86 46.23 26.77 44.35Life Insurance (161.05) (122.49) (499.67) (237.10) (437.68)Software (4.71) 1.60 (0.83) 3.55 6.45BPO (24.65) (23.39) (43.27) (17.75) (26.48)Telecom 105.38 119.89 355.07 338.21 476.34Total Segment Result (75.68) 120.33 51.94 459.48 540.50Less: Interest & Finance Expenses (Net) (144.42) (90.05) (399.63) (254.36) (367.01)Add: Net of Unallocable Income/(Expenditure) (3.32) (5.32) (5.09) (12.46) (22.19)Profit / (Loss) Before Tax and Exceptional Items (223.42) 24.96 (352.78) 192.66 151.30Gain on sale of Undertaking - - - 0.73 0.73VRS Cost (1.17) - (1.17) - -Profit / (Loss) After Exceptional Items (224.59) 24.96 (353.95) 193.39 152.03Capital Employed As on As on As on(Segment Assets - Segment Liabilities) 31st Dec 08 31st Dec 07 31st March 08Garments 791.36 663.81 746.06Rayon Yarn (Including Caustic & Allied Chemicals) 439.55 430.38 453.69Carbon Black 887.05 563.54 667.54Insulators 268.89 222.87 239.96Other Textiles (Spun Yarn & Fabrics) 399.38 362.96 359.33Fertilizers 444.86 359.12 531.27Financial Services 311.41 289.87 306.98Life Insurance 397.09 312.21 384.64Software 19.78 26.26 31.62BPO 895.31 924.28 1,005.59Telecom 6,600.24 2,732.39 3,218.11Total Segment Capital Employed 11,454.92 6,887.69 7,944.79Add: Unallocated Corporate Assets 2,267.56 2,092.37 2,139.86Total Capital Employed 13,722.48 8,980.06 10,084.65Page 2/5