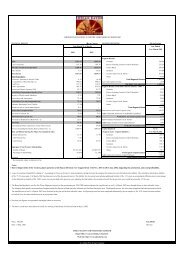
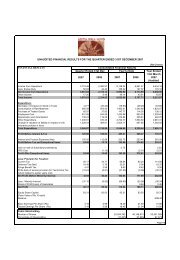
Contd. from Page 1SEGMENT REPORTINGUNAUDITED FINANCIAL RESULTS FOR THE QUARTER ENDED 31ST DECEMBER 2008Consolidated Financial ResultsQuarter Ended 31st DecemberYear to Date(Rs Crores)Year Ended31st March2008 2007 2008 2007 2008(Audited)Segment RevenueGarments 293.26 278.83 842.52 749.55 1,025.84Rayon Yarn (Including Caustic & Allied Chemicals) 125.81 119.96 400.01 348.18 475.96Carbon Black 221.93 245.33 857.54 596.76 863.84Insulators 112.84 98.17 309.50 283.57 398.86Other Textiles (Spun Yarn & Fabrics) 139.93 149.91 437.96 446.61 600.35Fertilizers 362.55 263.46 912.01 518.25 787.46Financial Services 58.66 53.92 191.62 131.63 197.46Life Insurance - Premium Income (Shown in Gross Sales) 972.86 778.76 2,778.34 1,832.10 3,223.07-Investment Income /(Loss) on Policyholders' Fund (315.10) 688.92 (785.79) 1,316.07 487.30Software 22.33 25.64 73.38 74.31 101.09BPO 416.02 403.08 1,300.05 1,149.22 1,577.65Telecom 737.16 542.83 2,100.24 1,508.80 2,135.63Total Segmental Revenue 3,148.25 3,648.81 9,417.38 8,955.05 11,874.51Less: Inter Segment Revenue (4.96) (3.96) (12.06) (6.58) (13.40)Net Income from Operations 3,143.29 3,644.85 9,405.32 8,948.47 11,861.11Segment Results (Profit beforeInterest and Tax - PBIT)Garments (57.83) 5.16 (145.20) 4.45 0.01Rayon Yarn (Including Caustic & Allied Chemicals) 12.98 19.27 61.10 66.08 91.52Carbon Black (26.34) 37.42 38.45 99.41 130.32Insulators 25.21 31.89 78.55 85.16 122.53Other Textiles (Spun Yarn & Fabrics) 4.91 11.89 28.58 37.35 48.69Fertilizers 43.23 29.23 132.93 53.35 84.45Financial Services 7.19 9.86 46.23 26.77 44.35Life Insurance (161.05) (122.49) (499.67) (237.10) (437.68)Software (4.71) 1.60 (0.83) 3.55 6.45BPO (24.65) (23.39) (43.27) (17.75) (26.48)Telecom 105.38 119.89 355.07 338.21 476.34Total Segment Result (75.68) 120.33 51.94 459.48 540.50Less: Interest & Finance Expenses (Net) (144.42) (90.05) (399.63) (254.36) (367.01)Add: Net of Unallocable Income/(Expenditure) (3.32) (5.32) (5.09) (12.46) (22.19)Profit / (Loss) Before Tax and Exceptional Items (223.42) 24.96 (352.78) 192.66 151.30Gain on sale of Undertaking - - - 0.73 0.73VRS Cost (1.17) - (1.17) - -Profit / (Loss) After Exceptional Items (224.59) 24.96 (353.95) 193.39 152.03Capital Employed As on As on As on(Segment Assets - Segment Liabilities) 31st Dec 08 31st Dec 07 31st March 08Garments 791.36 663.81 746.06Rayon Yarn (Including Caustic & Allied Chemicals) 439.55 430.38 453.69Carbon Black 887.05 563.54 667.54Insulators 268.89 222.87 239.96Other Textiles (Spun Yarn & Fabrics) 399.38 362.96 359.33Fertilizers 444.86 359.12 531.27Financial Services 311.41 289.87 306.98Life Insurance 397.09 312.21 384.64Software 19.78 26.26 31.62BPO 895.31 924.28 1,005.59Telecom 6,600.24 2,732.39 3,218.11Total Segment Capital Employed 11,454.92 6,887.69 7,944.79Add: Unallocated Corporate Assets 2,267.56 2,092.37 2,139.86Total Capital Employed 13,722.48 8,980.06 10,084.65Page 2/5
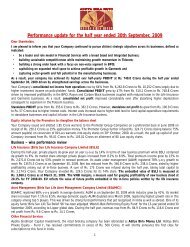
Contd. from Page 2UNAUDITED FINANCIAL RESULTS FOR THE QUARTER ENDED 31ST DECEMBER 2008FINANCIAL RESULTS(Rs Crores)Standalone Financial ResultsQuarter Ended 31st DecemberYear to DateYear Ended31st March2008 2007 2008 2007 2008(Audited)Gross Sales 1,222.41 1,132.24 3,709.35 2,895.30 4,055.62Less: Excise Duty 49.95 56.83 174.47 155.32 213.31Net Sales 1,172.46 1,075.41 3,534.88 2,739.98 3,842.31Other Operating Income 24.18 22.22 77.39 59.17 110.75Net Income from Operations 1,196.64 1,097.63 3,612.27 2,799.15 3,953.06Expenditure:Decrease / (Increase) in Stock in Trade (35.94) (6.53) (95.71) (78.07) (83.68)Consumption of Raw Materials 596.25 500.82 1,789.31 1,306.12 1,874.02Purchase of Traded Goods 82.38 65.97 204.70 147.75 187.76Employees Cost 79.20 67.77 225.61 194.57 258.20Depreciation and Amortisation 42.05 37.12 121.30 103.35 141.10Power & Fuel 162.13 102.29 423.98 250.18 357.01Other Expenditure 226.14 196.84 643.10 534.33 738.54Total Expenditure 1,152.21 964.28 3,312.29 2,458.23 3,472.95Profit from Operations before Other Income, Interest &Exceptional Items 44.43 133.35 299.98 340.92 480.11Other Income 3.02 1.74 12.20 9.70 12.74Profit before Interest and Exceptional Items 47.45 135.09 312.18 350.62 492.85Interest and Finance Expenses (Net) 72.75 37.94 171.42 128.81 179.02Profit / (Loss) after Interest but before Exceptional Items (25.30) 97.15 140.76 221.81 313.83Gain on sale of Undertaking - - - 0.73 0.73Profit / (Loss) before Tax (25.30) 97.15 140.76 222.54 314.56Less: Provision for Taxation:Current Tax (1.01) 20.82 67.60 50.19 78.14Deferred Tax (Net) (7.35) 9.44 (18.99) 18.23 25.24Fringe Benefit Tax 1.01 1.12 3.16 2.87 3.86(Excess)/short provision for Tax/Income Tax refund related to(22.06) (18.24) (22.06) (21.34) (35.75)earlier years (net)Net Profit 4.11 84.01 111.05 172.59 243.07Paid Up Equity Share Capital 95.01 93.31 95.01(Face Value of Rs.10 each)Reserve excluding Revaluation Reserve 3,551.32Basic Earnings Per Share (Rs) 0.43 9.00 11.69 18.50 26.05Diluted Earnings Per Share (Rs) 0.43 9.00 11.68 18.49 26.04Public ShareholdingNumber of Shares 52,587,955 53,554,762 53,564,907Percentage of Shareholding 55.35% 57.40% 56.38%Page 3/5