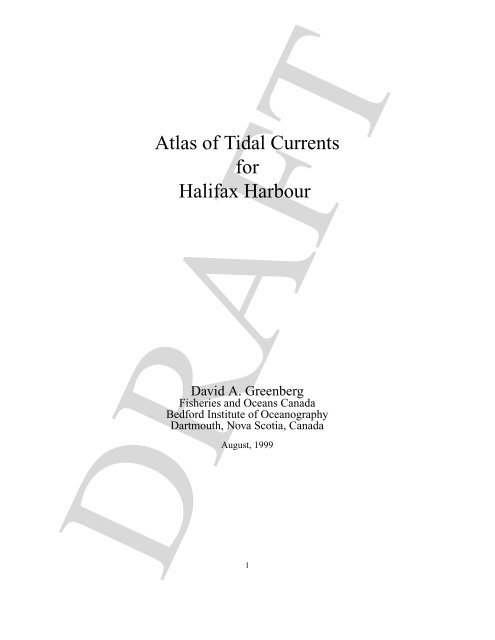
Atlas of Tidal Currents for Halifax Harbour
Atlas of Tidal Currents for Halifax Harbour
Atlas of Tidal Currents for Halifax Harbour

You also want an ePaper? Increase the reach of your titles
YUMPU automatically turns print PDFs into web optimized ePapers that Google loves.
Contents1 Introduction and disclaimer 32 The Model and its limitations 43 Nontidal <strong>Currents</strong> 54 How to use this atlas 54.1 Examples . . . . . . . . . . . . . . . . . . . . . . . . . . . . . . . . 6List <strong>of</strong> Tables1 The amplitude <strong>of</strong> the major tidal constituents from an analysis <strong>of</strong> 1973data from the <strong>Halifax</strong> <strong>Harbour</strong> tide gauge. The components additionalto are approximately accounted <strong>for</strong> by scaling the vectors as describedon section 4. . . . . . . . . . . . . . . . . . . . . . . . . . . 42 Extraction from Tide Tables — <strong>Halifax</strong> <strong>Harbour</strong> May 14 1999. . . . . 6¢¡List <strong>of</strong> Figures1 Full <strong>Harbour</strong>, high tide . . . . . . . . . . . . . . . . . . . . . . . . . 82 Full <strong>Harbour</strong>, one hour after high tide . . . . . . . . . . . . . . . . . 93 Full <strong>Harbour</strong>, two hours after high tide . . . . . . . . . . . . . . . . . 104 Full <strong>Harbour</strong>, three hours after high tide . . . . . . . . . . . . . . . . 115 Full <strong>Harbour</strong>, two hours be<strong>for</strong>e low tide . . . . . . . . . . . . . . . . 126 Full <strong>Harbour</strong>, one hour be<strong>for</strong>e low tide . . . . . . . . . . . . . . . . . 137 Full <strong>Harbour</strong>, low tide . . . . . . . . . . . . . . . . . . . . . . . . . . 148 Full <strong>Harbour</strong>, one hour after low tide . . . . . . . . . . . . . . . . . . 159 Full <strong>Harbour</strong>, two hours after low tide . . . . . . . . . . . . . . . . . 1610 Full <strong>Harbour</strong>, three hours after low tide . . . . . . . . . . . . . . . . . 1711 Full <strong>Harbour</strong>, two hours be<strong>for</strong>e high tide . . . . . . . . . . . . . . . . 1812 Full <strong>Harbour</strong>, one hour be<strong>for</strong>e high tide . . . . . . . . . . . . . . . . 1913 Inner <strong>Harbour</strong>, high tide . . . . . . . . . . . . . . . . . . . . . . . . . 2014 Inner <strong>Harbour</strong>, one hour after high tide . . . . . . . . . . . . . . . . . 2115 Inner <strong>Harbour</strong>, two hours after high tide . . . . . . . . . . . . . . . . 2216 Inner <strong>Harbour</strong>, three hours after high tide . . . . . . . . . . . . . . . 2317 Inner <strong>Harbour</strong>, two hours be<strong>for</strong>e low tide . . . . . . . . . . . . . . . . 2418 Inner <strong>Harbour</strong>, one hour be<strong>for</strong>e low tide . . . . . . . . . . . . . . . . 2519 Inner <strong>Harbour</strong>, low tide . . . . . . . . . . . . . . . . . . . . . . . . . 2620 Inner <strong>Harbour</strong>, one hour after low tide . . . . . . . . . . . . . . . . . 2721 Inner <strong>Harbour</strong>, two hours after low tide . . . . . . . . . . . . . . . . . 2822 Inner <strong>Harbour</strong>, three hours after low tide . . . . . . . . . . . . . . . . 2923 Inner <strong>Harbour</strong>, two hours be<strong>for</strong>e high tide . . . . . . . . . . . . . . . 3024 Inner <strong>Harbour</strong>, one hour be<strong>for</strong>e high tide . . . . . . . . . . . . . . . . 31DRAFT2
1 Introduction and disclaimerThis atlas was created following a request from the Canadian Armed Forces <strong>for</strong> in<strong>for</strong>mationon currents <strong>for</strong> navigating <strong>Halifax</strong> <strong>Harbour</strong>. It is hoped that it will servethe same purpose as the <strong>Atlas</strong> <strong>of</strong> <strong>Tidal</strong> <strong>Currents</strong>, Bay <strong>of</strong> Fundy and Gulf <strong>of</strong> Maine [1],namely to provide hourly snapshots <strong>of</strong> tidal currents <strong>for</strong> the purposes <strong>of</strong> navigation.Note that in <strong>Halifax</strong> <strong>Harbour</strong> the tides are not large, and compared to the Bay <strong>of</strong> Fundyand Gulf <strong>of</strong> Maine the tidal currents can be dominated and even reversed by other processes(see section 3). In addition, there are limitations <strong>of</strong> the computer model used tocompute these currents (section 2).THIS ATLAS IS PROVIDED IN THE HOPE THAT IT WILL BE HELP-FUL BUT BE CAUTIONED THAT IT IS TO BE USED AT YOUR OWN RISK.UNDER NO CIRCUMSTANCES IS ANY RESPONSIBILITY ASSUMED FORDAMAGE ARISING FROM THE USE OR THE INABILITY TO USE THIS AT-LAS.We are interested in providing the best in<strong>for</strong>mation possible. Feedback on the accuracyor inaccuracy <strong>of</strong> the depicted currents will help establish whether this productis worthwhile and how it might be improved. Comments may be mailed to the authorat the address on the cover page or e-mailed to dgreenbe@georgs.bio.dfo.ca.DRAFT3
3 Nontidal <strong>Currents</strong>There are many other processes not considered here that give rise to currents that canhave magnitudes <strong>of</strong> the same order as the tidal currents shown in this atlas. Some <strong>of</strong>these are:Local wind <strong>for</strong>cing. This will depend on the <strong>for</strong>ce, direction and duration <strong>of</strong> thewind. It is not uncommon to see magnitudes <strong>of</strong> 5 to 15 s§ cm .Distant meteorological <strong>for</strong>cing. Even though the <strong>Harbour</strong> seems calm, distantweather systems can give rise to sea level changes at the mouth <strong>of</strong> the <strong>Harbour</strong>influencing the inner <strong>Harbour</strong> currents to the same degree as the local winds <strong>for</strong>periods <strong>of</strong> hours to days .Resonance. <strong>Halifax</strong> <strong>Harbour</strong> can be rung like a bell from passing weather systemsor big waves at the <strong>Harbour</strong> entrance. The period <strong>of</strong> this resonant ringing isabout 2.1 hours and the currents can be 5 to 10 s cm [5]. The resonance hasbeen observed to be stronger and more frequent in winter.Estuarine circulation. The fresh water flowing out on the surface is compensated<strong>for</strong> by a deeper saltier flow into the harbour. The currents (5 – 15 s cm )are stronger at times <strong>of</strong> strong run<strong>of</strong>f, but are seen at all times <strong>of</strong> the year [6].4 How to use this atlasThis atlas is meant to be used in conjunction with the current annual Tide Tables <strong>for</strong><strong>Halifax</strong> <strong>Harbour</strong> (e.g. [2]). The general pattern can be obtained directly from one <strong>of</strong> thediagrams. Two sets <strong>of</strong> figures are given; the first set (Figures 1 – 12) covers the whole<strong>Harbour</strong>, the second set (Figures 13 – 24) covers the central part in greater detail. Thestrength <strong>of</strong> the current is determined by comparing the length <strong>of</strong> the current arrow withthe cm§ 5 current scale vector shown. The current magnitudes are derived assuming¢ an tidal range <strong>of</strong> 1.24 m; however, Tide Tables indicate the tidal range can be ashigh as 2.1 metres, these should be further scaled <strong>for</strong> more accurate predictions.1. Find the tidal diagram appropriate to your time relative to the tides in the TideTables. (Remember that the times in the Tide Tables are always local standardtime never daylight saving.)2. Determine the range (in metres) <strong>of</strong> the tide that includes the time <strong>of</strong> interest bysubtracting the low from the high tide.3. The scale factor <strong>for</strong> the currents is range .4. In the special case where the time is exactly at high or low tide (see the secondexample) the range should be taken from the rising or falling tide that immediatelyprecedes that time.DRAFT5
4.1 ExamplesThe sea level from the Tide Tables May 14 1999 at <strong>Halifax</strong> are shown in table 2.May 14 1999 9:00 ADT (the time you want to know the currents).– Convert to AST — 8:00 (this corresponds to about one hour after high tide).– The charts <strong>of</strong> interest are: Figures 2 and 14.– <strong>Currents</strong> will first be scaled according to their length relative to the 5 cmscale arrow on the figure.– The tidal range "! #%$'&(!*),+-"! . is so the scale factor to be applied to thecurrents "! .0/1"!*)32+4"! 5 is .May 14 1999 20:05 ADT.– Convert to AST — 19:05 (this corresponds to high tide).– The charts <strong>of</strong> interest are: Figures 1 and 13.– <strong>Currents</strong> will first be scaled according to their length relative to the 5 cmscale arrow on the figure.– The tidal range )1! &%$'&(!*),+-"! # is so the scale factor to be applied to thecurrents "! #0/1"!*)32+4"! 5 is .Time Height (m)0100 0.10650 1.81310 0.21905 2.0Table 2: Extraction from Tide Tables — <strong>Halifax</strong> <strong>Harbour</strong> May 14 1999.DRAFT6
References[1] Anonymous. <strong>Atlas</strong> <strong>of</strong> tidal currents, Bay <strong>of</strong> Fundy & Gulf <strong>of</strong> Maine. Technicalreport, Canadian Hydrographic Service, Fisheries and Oceans, Ottawa, 1981.[2] Anonymous. Canadian tide and current tables, volume 1, Atlantic Coast and Bay<strong>of</strong> Fundy. Technical report, Canadian Hydrographic Service, Fisheries and OceansCanada, 1999.[3] David A. Greenberg, T. S. Murty, and Alan Ruffman. A Numerical Model <strong>for</strong>the Tsunami in <strong>Halifax</strong> <strong>Harbour</strong> due to the Explosion in December 1917. MarineGeodesy, 16:153–167, 1993.[4] David A. Greenberg, T.S. Murty, and Alan Ruffman. Modelling the tsunami fromthe 1917 <strong>Halifax</strong> <strong>Harbour</strong> explosion. Tsunami Hazzards, 11(2):67–80, 1993.[5] D. McGonigal, R. Loucks, and D. Ingraham. <strong>Halifax</strong> Narrows: sample currentmeter data 1970-71. Data Report BI-D-74-5, Bed<strong>for</strong>d Institute <strong>of</strong> Oceanography,Dartmouth, N.S., 1974.[6] Brian Petrie and Philip Yeats. Simple models <strong>of</strong> the circulation, disolved metals,suspended solids and nutrients in <strong>Halifax</strong> <strong>Harbour</strong>. Water Poll. Res. J. Canada,25(3):325–349, 1990.[7] Alan Ruffman, David A. Greenberg, and T. S. Murty. The Tsunami from the1917 explosion in <strong>Halifax</strong> <strong>Harbour</strong>. In Alan Ruffman and Colin Howell, editors,Ground Zero - A reassessment <strong>of</strong> the 1917 Explosion in <strong>Halifax</strong> <strong>Harbour</strong>, page327. Nimbus Publishing and Gorsebrook Research Institute <strong>for</strong> Atlantic CanadaStudies, <strong>Halifax</strong>, Nova Scotia, 1994.DRAFT7
44°34’ 44°36’ 44°38’ 44°40’ 44°42’−63°40’ −63°38’ −63°36’ −63°34’ −63°32’ −63°30’ −63°28’5 cm/sHigh TideDRAFT−63°40’ −63°38’ −63°36’ −63°34’ −63°32’ −63°30’ −63°28’Figure 1: Full <strong>Harbour</strong>, high tide844°34’ 44°36’ 44°38’ 44°40’ 44°42’
44°34’ 44°36’ 44°38’ 44°40’ 44°42’−63°40’ −63°38’ −63°36’ −63°34’ −63°32’ −63°30’ −63°28’5 cm/sHigh Tide + 1 Hr.DRAFT−63°40’ −63°38’ −63°36’ −63°34’ −63°32’ −63°30’ −63°28’Figure 2: Full <strong>Harbour</strong>, one hour after high tide944°34’ 44°36’ 44°38’ 44°40’ 44°42’
44°34’ 44°36’ 44°38’ 44°40’ 44°42’−63°40’ −63°38’ −63°36’ −63°34’ −63°32’ −63°30’ −63°28’5 cm/sHigh Tide + 2 Hr.DRAFT−63°40’ −63°38’ −63°36’ −63°34’ −63°32’ −63°30’ −63°28’Figure 3: Full <strong>Harbour</strong>, two hours after high tide1044°34’ 44°36’ 44°38’ 44°40’ 44°42’
44°34’ 44°36’ 44°38’ 44°40’ 44°42’−63°40’ −63°38’ −63°36’ −63°34’ −63°32’ −63°30’ −63°28’5 cm/sHigh Tide + 3 Hr.DRAFT−63°40’ −63°38’ −63°36’ −63°34’ −63°32’ −63°30’ −63°28’Figure 4: Full <strong>Harbour</strong>, three hours after high tide1144°34’ 44°36’ 44°38’ 44°40’ 44°42’
44°34’ 44°36’ 44°38’ 44°40’ 44°42’−63°40’ −63°38’ −63°36’ −63°34’ −63°32’ −63°30’ −63°28’5 cm/sLow Tide − 2 Hr.DRAFT−63°40’ −63°38’ −63°36’ −63°34’ −63°32’ −63°30’ −63°28’Figure 5: Full <strong>Harbour</strong>, two hours be<strong>for</strong>e low tide1244°34’ 44°36’ 44°38’ 44°40’ 44°42’
44°34’ 44°36’ 44°38’ 44°40’ 44°42’−63°40’ −63°38’ −63°36’ −63°34’ −63°32’ −63°30’ −63°28’5 cm/sLow Tide − 1 Hr.DRAFT−63°40’ −63°38’ −63°36’ −63°34’ −63°32’ −63°30’ −63°28’Figure 6: Full <strong>Harbour</strong>, one hour be<strong>for</strong>e low tide1344°34’ 44°36’ 44°38’ 44°40’ 44°42’
44°34’ 44°36’ 44°38’ 44°40’ 44°42’−63°40’ −63°38’ −63°36’ −63°34’ −63°32’ −63°30’ −63°28’5 cm/sLow TideDRAFT−63°40’ −63°38’ −63°36’ −63°34’ −63°32’ −63°30’ −63°28’Figure 7: Full <strong>Harbour</strong>, low tide1444°34’ 44°36’ 44°38’ 44°40’ 44°42’
44°34’ 44°36’ 44°38’ 44°40’ 44°42’−63°40’ −63°38’ −63°36’ −63°34’ −63°32’ −63°30’ −63°28’5 cm/sLow Tide + 1 Hr.DRAFT−63°40’ −63°38’ −63°36’ −63°34’ −63°32’ −63°30’ −63°28’Figure 8: Full <strong>Harbour</strong>, one hour after low tide1544°34’ 44°36’ 44°38’ 44°40’ 44°42’
44°34’ 44°36’ 44°38’ 44°40’ 44°42’−63°40’ −63°38’ −63°36’ −63°34’ −63°32’ −63°30’ −63°28’5 cm/sLow Tide + 2 Hr.DRAFT−63°40’ −63°38’ −63°36’ −63°34’ −63°32’ −63°30’ −63°28’Figure 9: Full <strong>Harbour</strong>, two hours after low tide1644°34’ 44°36’ 44°38’ 44°40’ 44°42’
44°34’ 44°36’ 44°38’ 44°40’ 44°42’−63°40’ −63°38’ −63°36’ −63°34’ −63°32’ −63°30’ −63°28’5 cm/sLow Tide + 3 Hr.DRAFT−63°40’ −63°38’ −63°36’ −63°34’ −63°32’ −63°30’ −63°28’Figure 10: Full <strong>Harbour</strong>, three hours after low tide1744°34’ 44°36’ 44°38’ 44°40’ 44°42’
44°34’ 44°36’ 44°38’ 44°40’ 44°42’−63°40’ −63°38’ −63°36’ −63°34’ −63°32’ −63°30’ −63°28’5 cm/sHigh Tide − 2 Hr.DRAFT−63°40’ −63°38’ −63°36’ −63°34’ −63°32’ −63°30’ −63°28’Figure 11: Full <strong>Harbour</strong>, two hours be<strong>for</strong>e high tide1844°34’ 44°36’ 44°38’ 44°40’ 44°42’
44°34’ 44°36’ 44°38’ 44°40’ 44°42’−63°40’ −63°38’ −63°36’ −63°34’ −63°32’ −63°30’ −63°28’5 cm/sHigh Tide − 1 Hr.DRAFT−63°40’ −63°38’ −63°36’ −63°34’ −63°32’ −63°30’ −63°28’Figure 12: Full <strong>Harbour</strong>, one hour be<strong>for</strong>e high tide1944°34’ 44°36’ 44°38’ 44°40’ 44°42’
44°37’ 44°38’ 44°39’ 44°40’ 44°41’−63°38’ −63°36’ −63°34’ −63°32’5 cm/s−63°38’ −63°36’ −63°34’ −63°32’DRAFTFigure 13: Inner <strong>Harbour</strong>, high tide20High Tide 44°37’ 44°38’ 44°39’ 44°40’ 44°41’
44°37’ 44°38’ 44°39’ 44°40’ 44°41’−63°38’ −63°36’ −63°34’ −63°32’5 cm/sHigh Tide + 1 Hr.−63°38’ −63°36’ −63°34’ −63°32’DRAFTFigure 14: Inner <strong>Harbour</strong>, one hour after high tide2144°37’ 44°38’ 44°39’ 44°40’ 44°41’
44°37’ 44°38’ 44°39’ 44°40’ 44°41’−63°38’ −63°36’ −63°34’ −63°32’5 cm/sHigh Tide + 2 Hr.−63°38’ −63°36’ −63°34’ −63°32’DRAFTFigure 15: Inner <strong>Harbour</strong>, two hours after high tide2244°37’ 44°38’ 44°39’ 44°40’ 44°41’
44°37’ 44°38’ 44°39’ 44°40’ 44°41’−63°38’ −63°36’ −63°34’ −63°32’5 cm/sHigh Tide + 3 Hr.−63°38’ −63°36’ −63°34’ −63°32’DRAFTFigure 16: Inner <strong>Harbour</strong>, three hours after high tide2344°37’ 44°38’ 44°39’ 44°40’ 44°41’
44°37’ 44°38’ 44°39’ 44°40’ 44°41’−63°38’ −63°36’ −63°34’ −63°32’5 cm/sLow Tide − 2 Hr.−63°38’ −63°36’ −63°34’ −63°32’DRAFTFigure 17: Inner <strong>Harbour</strong>, two hours be<strong>for</strong>e low tide2444°37’ 44°38’ 44°39’ 44°40’ 44°41’
44°37’ 44°38’ 44°39’ 44°40’ 44°41’−63°38’ −63°36’ −63°34’ −63°32’5 cm/sLow Tide − 1 Hr.−63°38’ −63°36’ −63°34’ −63°32’DRAFTFigure 18: Inner <strong>Harbour</strong>, one hour be<strong>for</strong>e low tide2544°37’ 44°38’ 44°39’ 44°40’ 44°41’
44°37’ 44°38’ 44°39’ 44°40’ 44°41’−63°38’ −63°36’ −63°34’ −63°32’5 cm/s−63°38’ −63°36’ −63°34’ −63°32’DRAFTFigure 19: Inner <strong>Harbour</strong>, low tide26Low Tide44°37’ 44°38’ 44°39’ 44°40’ 44°41’
44°37’ 44°38’ 44°39’ 44°40’ 44°41’−63°38’ −63°36’ −63°34’ −63°32’5 cm/sLow Tide + 1 Hr.−63°38’ −63°36’ −63°34’ −63°32’DRAFTFigure 20: Inner <strong>Harbour</strong>, one hour after low tide2744°37’ 44°38’ 44°39’ 44°40’ 44°41’
44°37’ 44°38’ 44°39’ 44°40’ 44°41’−63°38’ −63°36’ −63°34’ −63°32’5 cm/sLow Tide + 2 Hr.−63°38’ −63°36’ −63°34’ −63°32’DRAFTFigure 21: Inner <strong>Harbour</strong>, two hours after low tide2844°37’ 44°38’ 44°39’ 44°40’ 44°41’
44°37’ 44°38’ 44°39’ 44°40’ 44°41’−63°38’ −63°36’ −63°34’ −63°32’5 cm/sLow Tide + 3 Hr.−63°38’ −63°36’ −63°34’ −63°32’DRAFTFigure 22: Inner <strong>Harbour</strong>, three hours after low tide2944°37’ 44°38’ 44°39’ 44°40’ 44°41’
44°37’ 44°38’ 44°39’ 44°40’ 44°41’−63°38’ −63°36’ −63°34’ −63°32’5 cm/sHigh Tide − 2 Hr.−63°38’ −63°36’ −63°34’ −63°32’DRAFTFigure 23: Inner <strong>Harbour</strong>, two hours be<strong>for</strong>e high tide3044°37’ 44°38’ 44°39’ 44°40’ 44°41’
44°37’ 44°38’ 44°39’ 44°40’ 44°41’−63°38’ −63°36’ −63°34’ −63°32’5 cm/sHigh Tide − 1 Hr.−63°38’ −63°36’ −63°34’ −63°32’DRAFTFigure 24: Inner <strong>Harbour</strong>, one hour be<strong>for</strong>e high tide3144°37’ 44°38’ 44°39’ 44°40’ 44°41’