Properties of biocomposites based on lignocellulosic fillers
Properties of biocomposites based on lignocellulosic fillers
Properties of biocomposites based on lignocellulosic fillers

You also want an ePaper? Increase the reach of your titles
YUMPU automatically turns print PDFs into web optimized ePapers that Google loves.
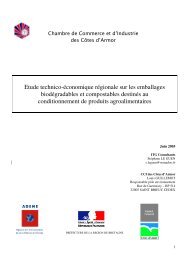
ARTICLE IN PRESS8 L. Avérous, F. Le Digabel / Carbohydrate Polymers xxx (2006) xxx–xxxFibres networksParenchymaSclerenchymeFig. 7. Schema <str<strong>on</strong>g>of</str<strong>on</strong>g> the cross-secti<strong>on</strong> <str<strong>on</strong>g>of</str<strong>on</strong>g> a wheat straw stem with thedifferent tissues.<str<strong>on</strong>g>of</str<strong>on</strong>g> crystallinity (in %) is estimated with Eq. (3). PBAT crystallinityis rather low, around 12%. We can notice that theDCp gap at the glass transiti<strong>on</strong> is rather small. The differentthermodynamic values are c<strong>on</strong>sistent with data obtained byother authors (Herrera et al., 2002).Table 4 presents the different values obtained by DSCdeterminati<strong>on</strong>s <strong>on</strong> PBAT with increasing filler c<strong>on</strong>tents.As shown in Table 4, the additi<strong>on</strong> <str<strong>on</strong>g>of</str<strong>on</strong>g> increasing amounts<str<strong>on</strong>g>of</str<strong>on</strong>g> LCF results in a slight but significant increase in T g <str<strong>on</strong>g>of</str<strong>on</strong>g>PBAT, from 39.3 to 35.7 °C. According to Avellaet al., this trend may be explained by intermolecular interacti<strong>on</strong>sbetween the hydroxyl groups <str<strong>on</strong>g>of</str<strong>on</strong>g> the <strong>fillers</strong> and thecarb<strong>on</strong>yl groups <str<strong>on</strong>g>of</str<strong>on</strong>g> the PBAT ester functi<strong>on</strong>s. These hydrogenb<strong>on</strong>ds would probably reduce the polymer mobilityand then increase T g values. The PBAT/LCF <str<strong>on</strong>g>biocomposites</str<strong>on</strong>g>do not show any significant variati<strong>on</strong> <str<strong>on</strong>g>of</str<strong>on</strong>g> T f , in agreementwith the data <str<strong>on</strong>g>of</str<strong>on</strong>g> Avella et al. (2000). We haveshown by SEC that the molecular weight variati<strong>on</strong> is insignificant.We have not detected any chain degradati<strong>on</strong> phenomenaunder the thermo-mechanical treatment. We cannotice that crystallizati<strong>on</strong> and fusi<strong>on</strong> heats decrease. Thisis due to a diluti<strong>on</strong> effect linked to the <strong>fillers</strong> incorporati<strong>on</strong>into the matrix. However, when the enthalpy is correctedby the filler c<strong>on</strong>tent, these values stay rather c<strong>on</strong>stante.g., DH 0 cdata (Table 4). The corrected heats <str<strong>on</strong>g>of</str<strong>on</strong>g> crystallizati<strong>on</strong>and fusi<strong>on</strong> are equivalent; we do not have significantcrystallizati<strong>on</strong> during the sec<strong>on</strong>d scan. The heats <str<strong>on</strong>g>of</str<strong>on</strong>g> crystallizati<strong>on</strong>and fusi<strong>on</strong> are equal to 13–14 J/g i.e., around2.6 kJ/mol. The diluti<strong>on</strong> effect seems also to affect DCp1009080Increasing filler c<strong>on</strong>tent:0, 10, 30 and 40 wt%– RLC 0%.001RLC 10%.001RLC 30%.001RLC 40%.00170Weight (%)60504030201000 50 100 150 200 250 300 350 400 450 500 550Temperature (˚C)Fig. 8. TGA thermograms, mass fracti<strong>on</strong> vs. temperature. TG <str<strong>on</strong>g>of</str<strong>on</strong>g> LCF-<str<strong>on</strong>g>based</str<strong>on</strong>g> <str<strong>on</strong>g>biocomposites</str<strong>on</strong>g> (0, 10, 30, and 40 wt % <str<strong>on</strong>g>of</str<strong>on</strong>g> LCF 0–1 ).Table 3Main TGA resultsTransiti<strong>on</strong> 1 Transiti<strong>on</strong> 2 Loss <str<strong>on</strong>g>of</str<strong>on</strong>g> weight At 300 °C–Filler––Matrix–Onset 1Degradati<strong>on</strong> temperaturemaximum 1 <str<strong>on</strong>g>of</str<strong>on</strong>g> DTGOnset 2Degradati<strong>on</strong> temperaturemaximum 2 <str<strong>on</strong>g>of</str<strong>on</strong>g> DTGPBAT No visible ‘‘transiti<strong>on</strong>’’ 382 °C (15%) 410 °C (60%) 1%LCF-10% 384 °C (15%) 411 °C (59%) 3%LCF-30% 323 °C (6%) 364 °C (17%) 398 °C (61%) 413 °C (63%) 5%LCF-40% 324 °C (10%) 357 °C (22%) 401 °C (48%) 421 °C (70%) 7%Between brackets are given the total weight loss at the corresp<strong>on</strong>ding temperature.