MAX Teaching with Reading and Writing - Ects.org
MAX Teaching with Reading and Writing - Ects.org
MAX Teaching with Reading and Writing - Ects.org

You also want an ePaper? Increase the reach of your titles
YUMPU automatically turns print PDFs into web optimized ePapers that Google loves.
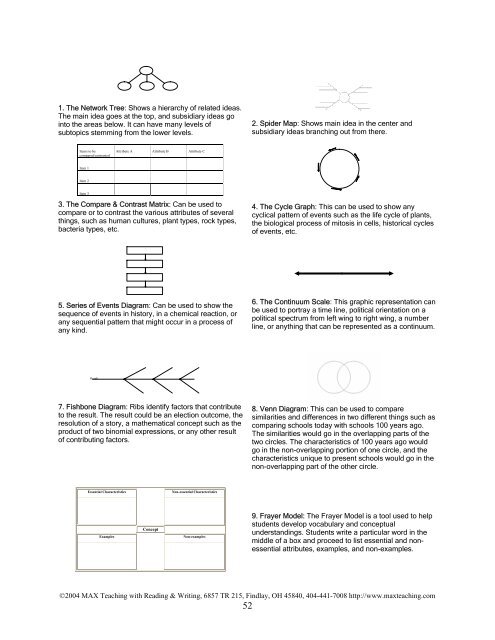
1. The Network Tree: Shows a hierarchy of related ideas.The main idea goes at the top, <strong>and</strong> subsidiary ideas gointo the areas below. It can have many levels ofsubtopics stemming from the lower levels.2. Spider Map: Shows main idea in the center <strong>and</strong>subsidiary ideas branching out from there.Items to becompared/contrastedAttribute A Attribute B Attribute CItem 1Item 2Item 33. The Compare & Contrast Matrix: Can be used tocompare or to contrast the various attributes of severalthings, such as human cultures, plant types, rock types,bacteria types, etc.4. The Cycle Graph: This can be used to show anycyclical pattern of events such as the life cycle of plants,the biological process of mitosis in cells, historical cyclesof events, etc.5. Series of Events Diagram: Can be used to show thesequence of events in history, in a chemical reaction, orany sequential pattern that might occur in a process ofany kind.6. The Continuum Scale: This graphic representation canbe used to portray a time line, political orientation on apolitical spectrum from left wing to right wing, a numberline, or anything that can be represented as a continuum.Result7. Fishbone Diagram: Ribs identify factors that contributeto the result. The result could be an election outcome, theresolution of a story, a mathematical concept such as theproduct of two binomial expressions, or any other resultof contributing factors.8. Venn Diagram: This can be used to comparesimilarities <strong>and</strong> differences in two different things such ascomparing schools today <strong>with</strong> schools 100 years ago.The similarities would go in the overlapping parts of thetwo circles. The characteristics of 100 years ago wouldgo in the non-overlapping portion of one circle, <strong>and</strong> thecharacteristics unique to present schools would go in thenon-overlapping part of the other circle.Essential CharacteristicsNon-essential CharacteristicsExamplesConceptNon-examples9. Frayer Model: The Frayer Model is a tool used to helpstudents develop vocabulary <strong>and</strong> conceptualunderst<strong>and</strong>ings. Students write a particular word in themiddle of a box <strong>and</strong> proceed to list essential <strong>and</strong> nonessentialattributes, examples, <strong>and</strong> non-examples.©2004 <strong>MAX</strong> <strong>Teaching</strong> <strong>with</strong> <strong>Reading</strong> & <strong>Writing</strong>, 6857 TR 215, Findlay, OH 45840, 404-441-7008 http://www.maxteaching.com52