Use of power law models in detecting region of interest
Use of power law models in detecting region of interest
Use of power law models in detecting region of interest

You also want an ePaper? Increase the reach of your titles
YUMPU automatically turns print PDFs into web optimized ePapers that Google loves.
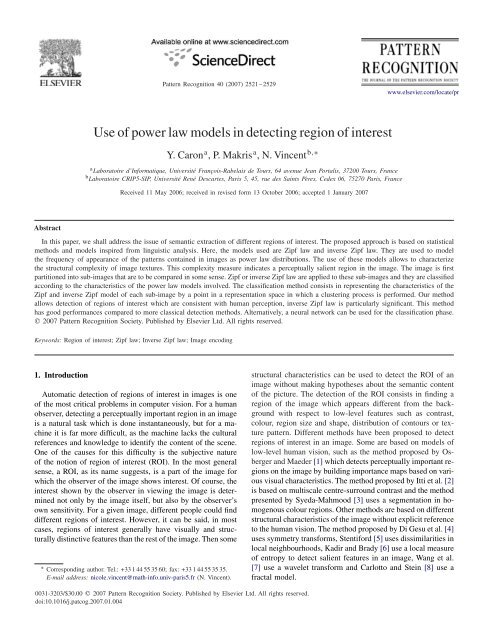
Pattern Recognition 40 (2007) 2521 – 2529www.elsevier.com/locate/pr<strong>Use</strong> <strong>of</strong> <strong>power</strong> <strong>law</strong> <strong>models</strong> <strong>in</strong> detect<strong>in</strong>g <strong>region</strong> <strong>of</strong> <strong>in</strong>terestY. Caron a , P. Makris a , N. V<strong>in</strong>cent b,∗a Laboratoire d’Informatique, Université François-Rabelais de Tours, 64 avenue Jean Portalis, 37200 Tours, Franceb Laboratoire CRIP5-SIP, Université René Descartes, Paris 5, 45, rue des Sa<strong>in</strong>ts Pères, Cedex 06, 75270 Paris, FranceReceived 11 May 2006; received <strong>in</strong> revised form 13 October 2006; accepted 1 January 2007AbstractIn this paper, we shall address the issue <strong>of</strong> semantic extraction <strong>of</strong> different <strong>region</strong>s <strong>of</strong> <strong>in</strong>terest. The proposed approach is based on statisticalmethods and <strong>models</strong> <strong>in</strong>spired from l<strong>in</strong>guistic analysis. Here, the <strong>models</strong> used are Zipf <strong>law</strong> and <strong>in</strong>verse Zipf <strong>law</strong>. They are used to modelthe frequency <strong>of</strong> appearance <strong>of</strong> the patterns conta<strong>in</strong>ed <strong>in</strong> images as <strong>power</strong> <strong>law</strong> distributions. The use <strong>of</strong> these <strong>models</strong> allows to characterizethe structural complexity <strong>of</strong> image textures. This complexity measure <strong>in</strong>dicates a perceptually salient <strong>region</strong> <strong>in</strong> the image. The image is firstpartitioned <strong>in</strong>to sub-images that are to be compared <strong>in</strong> some sense. Zipf or <strong>in</strong>verse Zipf <strong>law</strong> are applied to these sub-images and they are classifiedaccord<strong>in</strong>g to the characteristics <strong>of</strong> the <strong>power</strong> <strong>law</strong> <strong>models</strong> <strong>in</strong>volved. The classification method consists <strong>in</strong> represent<strong>in</strong>g the characteristics <strong>of</strong> theZipf and <strong>in</strong>verse Zipf model <strong>of</strong> each sub-image by a po<strong>in</strong>t <strong>in</strong> a representation space <strong>in</strong> which a cluster<strong>in</strong>g process is performed. Our methodallows detection <strong>of</strong> <strong>region</strong>s <strong>of</strong> <strong>in</strong>terest which are consistent with human perception, <strong>in</strong>verse Zipf <strong>law</strong> is particularly significant. This methodhas good performances compared to more classical detection methods. Alternatively, a neural network can be used for the classification phase. 2007 Pattern Recognition Society. Published by Elsevier Ltd. All rights reserved.Keywords: Region <strong>of</strong> <strong>in</strong>terest; Zipf <strong>law</strong>; Inverse Zipf <strong>law</strong>; Image encod<strong>in</strong>g1. IntroductionAutomatic detection <strong>of</strong> <strong>region</strong>s <strong>of</strong> <strong>in</strong>terest <strong>in</strong> images is one<strong>of</strong> the most critical problems <strong>in</strong> computer vision. For a humanobserver, detect<strong>in</strong>g a perceptually important <strong>region</strong> <strong>in</strong> an imageis a natural task which is done <strong>in</strong>stantaneously, but for a mach<strong>in</strong>eit is far more difficult, as the mach<strong>in</strong>e lacks the culturalreferences and knowledge to identify the content <strong>of</strong> the scene.One <strong>of</strong> the causes for this difficulty is the subjective nature<strong>of</strong> the notion <strong>of</strong> <strong>region</strong> <strong>of</strong> <strong>in</strong>terest (ROI). In the most generalsense, a ROI, as its name suggests, is a part <strong>of</strong> the image forwhich the observer <strong>of</strong> the image shows <strong>in</strong>terest. Of course, the<strong>in</strong>terest shown by the observer <strong>in</strong> view<strong>in</strong>g the image is determ<strong>in</strong>ednot only by the image itself, but also by the observer’sown sensitivity. For a given image, different people could f<strong>in</strong>ddifferent <strong>region</strong>s <strong>of</strong> <strong>in</strong>terest. However, it can be said, <strong>in</strong> mostcases, <strong>region</strong>s <strong>of</strong> <strong>in</strong>terest generally have visually and structurallydist<strong>in</strong>ctive features than the rest <strong>of</strong> the image. Then some∗ Correspond<strong>in</strong>g author. Tel.: +33 1 44 55 35 60; fax: +33 1 44 55 35 35.E-mail address: nicole.v<strong>in</strong>cent@math-<strong>in</strong>fo.univ-paris5.fr (N. V<strong>in</strong>cent).structural characteristics can be used to detect the ROI <strong>of</strong> animage without mak<strong>in</strong>g hypotheses about the semantic content<strong>of</strong> the picture. The detection <strong>of</strong> the ROI consists <strong>in</strong> f<strong>in</strong>d<strong>in</strong>g a<strong>region</strong> <strong>of</strong> the image which appears different from the backgroundwith respect to low-level features such as contrast,colour, <strong>region</strong> size and shape, distribution <strong>of</strong> contours or texturepattern. Different methods have been proposed to detect<strong>region</strong>s <strong>of</strong> <strong>in</strong>terest <strong>in</strong> an image. Some are based on <strong>models</strong> <strong>of</strong>low-level human vision, such as the method proposed by Osbergerand Maeder [1] which detects perceptually important <strong>region</strong>son the image by build<strong>in</strong>g importance maps based on variousvisual characteristics. The method proposed by Itti et al. [2]is based on multiscale centre-surround contrast and the methodpresented by Syeda-Mahmood [3] uses a segmentation <strong>in</strong> homogenouscolour <strong>region</strong>s. Other methods are based on differentstructural characteristics <strong>of</strong> the image without explicit referenceto the human vision. The method proposed by Di Gesu et al. [4]uses symmetry transforms, Stentiford [5] uses dissimilarities <strong>in</strong>local neighbourhoods, Kadir and Brady [6] use a local measure<strong>of</strong> entropy to detect salient features <strong>in</strong> an image, Wang et al.[7] use a wavelet transform and Carlotto and Ste<strong>in</strong> [8] use afractal model.0031-3203/$30.00 2007 Pattern Recognition Society. Published by Elsevier Ltd. All rights reserved.doi:10.1016/j.patcog.2007.01.004
2522 Y. Caron et al. / Pattern Recognition 40 (2007) 2521–2529In this paper, we shall use a new approach based on a statisticalmodel which orig<strong>in</strong>ates <strong>in</strong> l<strong>in</strong>guistic analysis: Zipf <strong>law</strong>.This model proved efficient to represent the distribution <strong>of</strong> thefrequencies <strong>of</strong> words <strong>in</strong> the form <strong>of</strong> a <strong>power</strong> <strong>law</strong>. It has beendiscovered <strong>in</strong> 1949 by Zipf [9] <strong>in</strong> written English texts, andZipf distributions have been found <strong>in</strong> every natural language.Similar <strong>power</strong> <strong>law</strong>s have been put <strong>in</strong>to evidence <strong>in</strong> differentdoma<strong>in</strong>s <strong>of</strong> human and natural sciences, such as <strong>in</strong>come distributionby Pareto [10] and Gibrat [11], population <strong>of</strong> cities byZipf [12] and Gabaix [13], distribution <strong>of</strong> biological species byYule [14], distribution <strong>of</strong> galactic voids by Gaite and Manrubia[15], Internet traffic by Breslau et al. [16] and Huberman et al.[17] and <strong>in</strong> the structure <strong>of</strong> music by Manaris et al. [18] and<strong>of</strong> natural noises by Dellandrea et al. [19]. In the doma<strong>in</strong> <strong>of</strong>digital images, Zipf <strong>law</strong> has been used by V<strong>in</strong>cent et al. [20]to evaluate the distortion <strong>of</strong> compressed images and by Caronet al. [21] to detect artificial objects <strong>in</strong> natural environments.The method described <strong>in</strong> this paper aims to detect the <strong>region</strong>s<strong>of</strong> <strong>in</strong>terest <strong>in</strong> various digital images. A potential application isautomatic determ<strong>in</strong>ation <strong>of</strong> the ROI for JPEG2000 compression.Some restrictive constra<strong>in</strong>s have been assumed so that aprocess is possible. We assume the ROI to be detected is a s<strong>in</strong>gleconnected <strong>region</strong> <strong>in</strong> the image. The ROI must both havea significant size and appear different from the backgroundwith respect to its structural complexity. Most <strong>of</strong>ten, the ROIis belong<strong>in</strong>g to the foreground <strong>of</strong> the scene and conta<strong>in</strong>s moredetails than the background but our method also handles thecase when the ROI is more uniform than the background.The <strong>power</strong> <strong>law</strong> model will first be recalled, and then wewill present the adaptation that is needed to apply it to imageanalysis. Then, the detection methods based on Zipf and <strong>in</strong>verseZipf <strong>law</strong>s will be presented, and the <strong>in</strong>fluence <strong>of</strong> <strong>in</strong>itial imagesegmentation will be discussed.2. Power <strong>law</strong> <strong>models</strong>The <strong>power</strong> <strong>law</strong> distribution model known as Zipf <strong>law</strong> orrank-frequency <strong>law</strong> has been determ<strong>in</strong>ed empirically by Zipf.Accord<strong>in</strong>g to Zipf <strong>law</strong>, <strong>in</strong> a topologically ordered set <strong>of</strong> symbolslike a text, the frequency <strong>of</strong> occurrence <strong>of</strong> the different symbolpatterns, for example the words <strong>of</strong> the text, follows a <strong>power</strong> <strong>law</strong>.To be more precise, different patterns occur <strong>in</strong> the signal, theyare n-tuples <strong>of</strong> symbols. Let us note as P 1 ,P 2 ,...,P R thesepatterns. The frequencies <strong>of</strong> those patterns depend on the signal,let us note them as N 1 ,N 2 ,...,N R . Then the patterns can besorted accord<strong>in</strong>g to the decreas<strong>in</strong>g order <strong>of</strong> their appearancefrequency. That is to say N σ(i) is frequency <strong>of</strong> pattern P σ(i) <strong>of</strong>rank i.The frequency <strong>of</strong> appearance N σ(i) <strong>of</strong> the pattern P <strong>of</strong>rank i is given byN σ(i) = ki −α . (1)In this formula, k and α are constants. k is l<strong>in</strong>ked to the totallength <strong>of</strong> the observed signal and the value <strong>of</strong> the exponentα, <strong>in</strong> the case <strong>of</strong> English texts studied by Zipf is close to 1.Similar results have been found <strong>in</strong> texts written <strong>in</strong> all naturallanguages, as well as randomly generated texts. This <strong>power</strong> <strong>law</strong>model is usually represented graphically <strong>in</strong> a bi-logarithmicscale diagram, where the logarithm <strong>of</strong> the frequency <strong>of</strong> eachn-tuple is plotted with respect to the logarithm <strong>of</strong> its rank. Sucha graphical representation is called Zipf plot. This transformallows to <strong>in</strong>troduce a l<strong>in</strong>ear relation that can be estimated <strong>in</strong> aneasy way. The least-square regression <strong>of</strong> the plot can be usedto approximate the <strong>power</strong> <strong>law</strong> exponent.Different <strong>in</strong>terpretations have been proposed to expla<strong>in</strong> theexistence <strong>of</strong> <strong>power</strong> <strong>law</strong> distributions. Zipf’s own explanationwas based on the pr<strong>in</strong>ciple <strong>of</strong> least effort: a <strong>power</strong> <strong>law</strong> distribution<strong>of</strong> the word frequencies tends to m<strong>in</strong>imize the effort <strong>of</strong> boththe speaker and the listener <strong>in</strong> communication. However, notall the phenomena where <strong>power</strong> <strong>law</strong> distributions are observed,can be expla<strong>in</strong>ed <strong>in</strong> that way. Therefore, other <strong>in</strong>terpretationshave been proposed by Mandelbrot [22], Simon [23] and morerecently by Reed [24], where the existence <strong>of</strong> <strong>power</strong> <strong>law</strong>s isexpla<strong>in</strong>ed by the properties <strong>of</strong> lexicographical trees, Brownianmotion and stochastic birth and death processes.Another <strong>power</strong> <strong>law</strong> model has been discovered by Zipf [25]<strong>in</strong> his work on natural texts. It is the so-called <strong>in</strong>verse Zipf <strong>law</strong>.Accord<strong>in</strong>g to this <strong>law</strong>, the number I <strong>of</strong> dist<strong>in</strong>ct words whichhave the frequency f is given byI(f)= af −b . (2)In this formula, a and b are constants and the value <strong>of</strong>exponent b is generally close to 2 <strong>in</strong> the case <strong>of</strong> natural texts. Infact, this formula is verified only for the least frequent words.As for Zipf <strong>law</strong>, <strong>in</strong>verse Zipf <strong>law</strong> can be represented <strong>in</strong> abi-logarithmic scale diagram. Such a representation is called<strong>in</strong>verse Zipf plot. Inverse Zipf <strong>law</strong> has been used by Cohen et al.[26] and Ferrer and Solé [27] to study the properties <strong>of</strong> naturaland random texts. Inverse Zipf <strong>law</strong> expresses the diversity <strong>of</strong>the lexical spectrum <strong>of</strong> a text and it can be used to discrim<strong>in</strong>atebetween natural texts and artificially generated texts, as thevalues <strong>of</strong> the parameters <strong>of</strong> the <strong>power</strong> <strong>law</strong> model are differentfor the two types <strong>of</strong> texts.S<strong>in</strong>ce <strong>power</strong> <strong>law</strong> <strong>models</strong> can discrim<strong>in</strong>ate between naturaland artificial texts, it might be possible to adapt those <strong>models</strong>to image analysis and use them to detect some specific features<strong>in</strong> an image, and therefore to detect a ROI.3. Application to imagesSome years ago, L<strong>in</strong>dsey and Strömberg [28] used the frequencies<strong>of</strong> simple features. In this study, the approach f<strong>in</strong>dsits base <strong>in</strong> some <strong>law</strong> that has been verified <strong>in</strong> different fields.We show both Zipf <strong>law</strong> and <strong>in</strong>verse Zipf <strong>law</strong> can be used forimage analysis. To adapt the model to image analysis, it is necessaryto def<strong>in</strong>e the equivalent <strong>of</strong> the notion <strong>of</strong> word <strong>in</strong> the case<strong>of</strong> images. In order to respect the usual topology that structurethe plane <strong>of</strong> the image, we will use image patterns def<strong>in</strong>ed asblocks <strong>of</strong> 3 × 3 adjacent pixels, such as words are def<strong>in</strong>ed asstr<strong>in</strong>gs <strong>of</strong> adjacent letters. The two ma<strong>in</strong> differences betweenwords and image patterns is that the image is bi-dimensional,unlike the text, and <strong>in</strong> our case the patterns will have a fixedsize, unlike the words which have a variable length. In usualimages where each pixel is coded on a byte, the grey levels<strong>of</strong> the image cannot be used directly. Indeed, the number <strong>of</strong>
Y. Caron et al. / Pattern Recognition 40 (2007) 2521 – 2529 2523possible different patterns would be too large for the statisticalrepartition <strong>of</strong> the frequencies to be significant. It is thereforenecessary to def<strong>in</strong>e a pattern cod<strong>in</strong>g which reduces the number<strong>of</strong> dist<strong>in</strong>ct patterns. It will elim<strong>in</strong>ate also the <strong>in</strong>fluence <strong>of</strong> thesmall variations <strong>of</strong> <strong>in</strong>tensity. A simple way to achieve this isto quantize the grey level that is to divide the grey scale <strong>in</strong>to asmall number <strong>of</strong> classes and to assign at each pixel the value <strong>of</strong>the class. The class value c(x,y) <strong>of</strong> the pixel g(x,y) is givenby the formula (3) where N is the number <strong>of</strong> classes:[ ] Ng(x, y)c(x,y) = <strong>in</strong>t. (3)255The number <strong>of</strong> classes must be chosen to m<strong>in</strong>imize both thenumber <strong>of</strong> dist<strong>in</strong>ct patterns and the distortion <strong>of</strong> the image, theloss <strong>of</strong> <strong>in</strong>formation due to the cod<strong>in</strong>g process. The best resultshave been obta<strong>in</strong>ed with n<strong>in</strong>e classes, it is the lowest number<strong>of</strong> classes which can be used without visible distortion <strong>of</strong> theimage. An example <strong>of</strong> pattern obta<strong>in</strong>ed with this method isshown <strong>in</strong> Fig. 1.In order to verify that either Zipf <strong>law</strong> or <strong>in</strong>verse Zipf <strong>law</strong>hold on an image, the image is scanned with a 3 × 3 mask,the patterns are encoded and the occurrence frequency for eachdifferent pattern is computed. The patterns are coded accord<strong>in</strong>gto the pixels grey level <strong>in</strong> the considered w<strong>in</strong>dow. In the case<strong>of</strong> Zipf <strong>law</strong>, the patterns are sorted <strong>in</strong> the decreas<strong>in</strong>g order <strong>of</strong>their appearance frequency, and the frequency for each patternis plotted with respect to its rank <strong>in</strong> a double-logarithmic scalediagram. In fact, only the frequencies <strong>of</strong> the patterns whichappear at least twice <strong>in</strong> the picture are represented on the plot.Such a graphical representation is called Zipf plot. In the case <strong>of</strong><strong>in</strong>verse Zipf <strong>law</strong>, the number <strong>of</strong> dist<strong>in</strong>ct patterns hav<strong>in</strong>g a givenfrequency is counted, and the results are also represented <strong>in</strong> adouble-logarithmic scale diagram, known as <strong>in</strong>verse Zipf plot.255 210 210 8 7 725 2 34 0 0 140 2 40 1 0 1Fig. 1. Orig<strong>in</strong>al pattern (left) and pattern coded with n<strong>in</strong>e-class method (right).An example <strong>of</strong> Zipf and <strong>in</strong>verse Zipf plots associated with aphotographic image is shown <strong>in</strong> Fig. 2. We can notice <strong>in</strong>verseZipf <strong>law</strong> is a very good model for the image. Besides, as far asZipf <strong>law</strong> is concerned, the quality <strong>of</strong> the model is not so good.A close look at the graph shows two l<strong>in</strong>ear zones. Two <strong>power</strong><strong>law</strong>s <strong>models</strong> reveal different characteristics <strong>of</strong> the image. WithZipf <strong>law</strong>, the graphical representation can be divided <strong>in</strong>to twoparts, correspond<strong>in</strong>g to different patterns types. The most frequentpatterns represented by the left part <strong>of</strong> the plot correspondto the most frequent patterns. They are present <strong>in</strong> the homogenouszones <strong>of</strong> the image. The right part <strong>of</strong> the plot correspondsto smaller details and contours. The two parts <strong>of</strong> the curve,taken separately are l<strong>in</strong>ear, so the distribution <strong>of</strong> the image patternfrequency is modelled by two <strong>in</strong>dependent <strong>power</strong> <strong>law</strong>s,one for homogenous <strong>region</strong>s and the other for small <strong>region</strong>s.Two different structures are highlighted. In the case <strong>of</strong> the <strong>in</strong>verseZipf <strong>law</strong>, the plot is l<strong>in</strong>ear for the least frequent patternsand means the distribution <strong>of</strong> the number <strong>of</strong> dist<strong>in</strong>ct patterns,with respect to their frequencies, follows a <strong>power</strong> <strong>law</strong>. Therefore,<strong>in</strong>verse Zipf <strong>law</strong> holds <strong>in</strong> the case <strong>of</strong> grey level imagesencoded through 3 × 3 w<strong>in</strong>dows <strong>in</strong> the neighbourhood <strong>of</strong> eachpixel.We are now to analyse the differences <strong>of</strong> the characteristics<strong>of</strong> Zipf and <strong>in</strong>verse Zipf plots accord<strong>in</strong>g to the structural content<strong>of</strong> the image. Fig. 3 shows two different zones <strong>of</strong> the sameimage and the associated Zipf plots. In the case <strong>of</strong> a uniformbackground zone, there is high number <strong>of</strong> homogenous patterns,so the slope <strong>of</strong> the left part <strong>of</strong> the plot is higher, and the rightpart <strong>of</strong> the plot appears comparatively flat. On the contrary, <strong>in</strong><strong>region</strong>s conta<strong>in</strong><strong>in</strong>g more details, the plot is more l<strong>in</strong>ear and witha larger slope.The <strong>in</strong>verse Zipf plots <strong>of</strong> both types <strong>of</strong> zones also show noticeabledifferences. In image zones conta<strong>in</strong><strong>in</strong>g many detailssuch as foreground objects, the number <strong>of</strong> patterns which have alow frequency <strong>of</strong> appearance is considerably higher, and thereforethe <strong>in</strong>verse Zipf plot has a higher slope than <strong>in</strong> the case <strong>of</strong>more uniform <strong>region</strong>s.The characteristics <strong>of</strong> Zipf and <strong>in</strong>verse Zipf plots are differentaccord<strong>in</strong>g to the amount <strong>of</strong> detail <strong>in</strong> the image. S<strong>in</strong>ce the <strong>region</strong>s<strong>of</strong> <strong>in</strong>terests generally conta<strong>in</strong> more details than the background<strong>of</strong> images, Zipf and <strong>in</strong>verse Zipf <strong>law</strong>s can be used to detect<strong>region</strong>s <strong>of</strong> <strong>in</strong>terest <strong>in</strong> images (Figs. 3 and 4).a b cLog (frequency)43.532.521.510.5Log (number <strong>of</strong> patterns)000 0.5 1 1.5 2 2.5 3 3.5 4 0 0.5 1 1.5 2 2.5 3.5 4Log (rank)Log (frequency)43.532.521.510.5Fig. 2. Inverse Zipf plot (b) and <strong>in</strong>verse Zipf plot (c) associated with the image (a).
2524 Y. Caron et al. / Pattern Recognition 40 (2007) 2521–2529a4.03.53.0Log (frequency)2.52.01.51.00.5b0.00.02.00.51.01.5 2.0 2.5 3.0 3.5 4.0Log (rank)1.5Log (frequency)1.00.50.00.00.5 1.0 1.5 2.0 2.5 3.0 3.5 4.0Log (rank)Fig. 3. Zipf plots <strong>of</strong> a uniform <strong>region</strong> (a) and <strong>of</strong> a <strong>region</strong> conta<strong>in</strong><strong>in</strong>g many details (b).4. Detection us<strong>in</strong>g Zipf <strong>law</strong>The ROI <strong>of</strong> the image can be def<strong>in</strong>ed as a part <strong>of</strong> the imagewhose structural content differs from the background <strong>of</strong>the picture. Power <strong>law</strong> <strong>models</strong> can provide an <strong>in</strong>dication on thestructural content <strong>of</strong> the picture, however, they provide no spatial<strong>in</strong>formation by themselves. Therefore, we are <strong>in</strong>troduc<strong>in</strong>ga more local study followed by a global analysis <strong>of</strong> the localresults. In order to reveal some local <strong>in</strong>formation, it is necessaryto divide the image <strong>in</strong>to sub-images as shown <strong>in</strong> Fig. 5.In each <strong>of</strong> the sub-images, Zipf or <strong>in</strong>verse Zipf <strong>law</strong> parameterscan be estimated. Then the sub-images are classified accord<strong>in</strong>gto the characteristics <strong>of</strong> the correspond<strong>in</strong>g Zipf plot. Theclassification method consists <strong>in</strong> represent<strong>in</strong>g the sub-images<strong>in</strong> a multidimensional space <strong>of</strong> characteristics. Then the set <strong>of</strong>po<strong>in</strong>ts is clustered <strong>in</strong> two classes <strong>in</strong> order to detect the ROI.In the case <strong>of</strong> Zipf <strong>law</strong>, the characteristics to be used arethe slopes <strong>of</strong> the two parts <strong>of</strong> the plot. The two zones are determ<strong>in</strong>edon the graph by po<strong>in</strong>t P be<strong>in</strong>g the most distant po<strong>in</strong>tfrom the l<strong>in</strong>e connect<strong>in</strong>g the two extreme po<strong>in</strong>ts <strong>of</strong> the plot asshown <strong>in</strong> Fig. 6.For example, the horizontal coord<strong>in</strong>ate x <strong>of</strong> each po<strong>in</strong>t <strong>of</strong> thecluster represents the slope <strong>of</strong> the left part <strong>of</strong> the correspond<strong>in</strong>gZipf plot and the vertical coord<strong>in</strong>ate y represents the slope <strong>of</strong>the right part <strong>of</strong> the plot. The slopes are computed us<strong>in</strong>g leastsquareregression method on a re-scaled representation to giveequal weight to each po<strong>in</strong>t.It has been determ<strong>in</strong>ed experimentally that <strong>in</strong> most images,the sub-images conta<strong>in</strong><strong>in</strong>g more detailed objects have Zipf plotswhere the slope <strong>of</strong> the right part is slightly lower than the slope<strong>of</strong> the left part. They are represented on the graph by po<strong>in</strong>tsfor which y
Y. Caron et al. / Pattern Recognition 40 (2007) 2521 – 2529 2525aLog (number <strong>of</strong> patterns)4.03.53.02.52.01.51.00.50.00.00.51.0 1.5 2.0Log (frequency)2.53.0bLog (number <strong>of</strong> patterns)3.02.52.01.51.00.50.00.0 0.5 1.0 1.5 2.0 2.5 3.0 3.5 4.0 4.5Log (frequency)Fig. 4. Zipf plots <strong>of</strong> a uniform <strong>region</strong> (a) and <strong>of</strong> a <strong>region</strong> conta<strong>in</strong><strong>in</strong>g many details (b).Fig. 6. Separation between the two parts <strong>of</strong> Zipf plot.Fig. 5. Segmentation <strong>of</strong> the image <strong>in</strong> sub-images.correspond<strong>in</strong>g to the sub-image are represented graphically bypo<strong>in</strong>ts <strong>in</strong> a graph. The significant characteristics <strong>of</strong> an <strong>in</strong>verseZipf plot we are us<strong>in</strong>g are its slope and the number <strong>of</strong> patternswhich appear only once <strong>in</strong> the picture. On the graphical representation,the horizontal coord<strong>in</strong>ate represents the slope andthe vertical coord<strong>in</strong>ate represents the number <strong>of</strong> unique patterns.The set <strong>of</strong> po<strong>in</strong>ts associated with sub-images is clustered<strong>in</strong>to two classes, respectively, the ROI and the background,accord<strong>in</strong>g to the values <strong>of</strong> the slope <strong>of</strong> the distribution and thenumber <strong>of</strong> unique patterns. In most images, the ROI conta<strong>in</strong>smore details than the background, so it will be representedby the part <strong>of</strong> the sub-images correspond<strong>in</strong>g to the highestvalues <strong>of</strong> the slope and/or <strong>of</strong> the number <strong>of</strong> unique patterns.The separation between the two classes can be def<strong>in</strong>ed by thecentre <strong>of</strong> gravity <strong>of</strong> the set. If we use the number <strong>of</strong> uniquepatterns as a detection criterion, the ROI is def<strong>in</strong>ed as the
2526 Y. Caron et al. / Pattern Recognition 40 (2007) 2521–2529Fig. 7. In (a) <strong>region</strong> <strong>of</strong> <strong>in</strong>terest extracted us<strong>in</strong>g Zipf <strong>law</strong>, <strong>in</strong> (b) the sub-images are figured <strong>in</strong> the representation space with the cluster<strong>in</strong>g <strong>in</strong> two classes ROIand background.aOrig<strong>in</strong>al imagebnumber <strong>of</strong> patterns occurr<strong>in</strong>g onceslope <strong>of</strong> <strong>in</strong>verse Zipf plotFig. 8. Region <strong>of</strong> <strong>in</strong>terest detection <strong>in</strong>dicated <strong>in</strong> (a) us<strong>in</strong>g <strong>in</strong>verse Zipf <strong>law</strong>.The representation <strong>of</strong> the sub-images is figured <strong>in</strong> (b) where the cluster<strong>in</strong>gis shown.largest connected component <strong>of</strong> the sub-images represented bypo<strong>in</strong>ts situated above the centre <strong>of</strong> gravity <strong>of</strong> the cluster. If theROI conta<strong>in</strong>s holes, as with Zipf <strong>law</strong>, they can be filled by<strong>in</strong>clud<strong>in</strong>g the sub-images with all neighbours already belong<strong>in</strong>gto the <strong>region</strong>. The discrim<strong>in</strong>ation between the two classes canbe adjusted dynamically <strong>in</strong> order to ma<strong>in</strong>ta<strong>in</strong> the surface <strong>of</strong> theFig. 9. Detection <strong>of</strong> an object more uniform than the background <strong>in</strong> (a) therepresentation <strong>of</strong> the sub-images is figured <strong>in</strong> (b) where the cluster<strong>in</strong>g isshown.ROI between 20% and 50% <strong>of</strong> the total area <strong>of</strong> the image. Anexample <strong>of</strong> ROI detected us<strong>in</strong>g this method is shown <strong>in</strong> Fig. 8.The blue area <strong>in</strong> this case seems too large.Unlike <strong>in</strong> the previous case, the ROI consists <strong>of</strong> a moreuniform object on a textured background. It is still possible todetect the ROI us<strong>in</strong>g the same method and detect<strong>in</strong>g the case<strong>in</strong> an automatic way. This case occurs if more than 50% <strong>of</strong> the
Y. Caron et al. / Pattern Recognition 40 (2007) 2521 – 2529 2527patterns <strong>of</strong> the whole image appear only once <strong>in</strong> the picture. TheROI is associated with the lower part <strong>of</strong> the graph. An example<strong>of</strong> such a ROI detected <strong>in</strong> such a way is shown <strong>in</strong> Fig. 9.It is also possible to use the slope <strong>of</strong> the <strong>in</strong>verse Zipf plots<strong>in</strong>stead <strong>of</strong> the number <strong>of</strong> unique patterns as a detection criterion.In this case, the ROI is represented by the po<strong>in</strong>ts situated atthe right <strong>of</strong> the gravity centre <strong>of</strong> the set, or at the left <strong>in</strong> thecase <strong>of</strong> uniform object <strong>in</strong> textured backgrounds. The results aresimilar to those obta<strong>in</strong>ed with the previous criterion. In bothcases, the <strong>region</strong>s <strong>of</strong> <strong>in</strong>terest detected with this method tendabto be larger than those which would be considered as such byhuman observers and <strong>of</strong>ten <strong>in</strong>cludes parts <strong>of</strong> the background.An improvement can be made by us<strong>in</strong>g the two characteristics<strong>of</strong> the <strong>in</strong>verse Zipf plot to determ<strong>in</strong>e the ROI. In this case,the ROI is the largest connected component <strong>of</strong> the sub-imagesrepresented by the po<strong>in</strong>ts <strong>in</strong> upper right part <strong>of</strong> the cluster. Thismethod allows the detection <strong>of</strong> more precise ROI as shown <strong>in</strong>Fig. 10.6. Influence <strong>of</strong> <strong>in</strong>itial segmentationThe size <strong>of</strong> the ROI depends on the size <strong>of</strong> the whole image.Here we are go<strong>in</strong>g to study the <strong>in</strong>fluence <strong>of</strong> the image size onthe characteristics <strong>of</strong> its pattern distribution. Indeed, the size <strong>of</strong>the sub-images must be chosen properly. They must be largeenough to present a statistically significant pattern distributionbut also be small enough to allow a precise determ<strong>in</strong>ation <strong>of</strong> theROI. As an image always aims to show someth<strong>in</strong>g, and to br<strong>in</strong>gsome <strong>in</strong>formation to the observer, we have chosen to considersub-images with no absolute dimension but relative dimension,related to the <strong>in</strong>itial dimension <strong>of</strong> the image. The whole imageis divided <strong>in</strong> a certa<strong>in</strong> number <strong>of</strong> sub-images. To determ<strong>in</strong>ethe best size <strong>of</strong> the image, a series <strong>of</strong> tests was conductedwith the same images segmented <strong>in</strong>to different numbers <strong>of</strong> subimages.An example <strong>of</strong> test result is shown <strong>in</strong> Fig. 11. Theimage has been segmented <strong>in</strong> 64 (=8×8), 361=(19×19) and1024 = (32 × 32) sub-images, and the <strong>in</strong>verse Zipf detectionmethod has been applied. When segmented <strong>in</strong> 8×8 sub-images,the object is not detected because the image is misclassifiedas hav<strong>in</strong>g an object <strong>of</strong> <strong>in</strong>terest which is more uniform thanthe background. With segmentation <strong>in</strong> 361 sub-images the ROIis correctly detected, and with the segmentation <strong>in</strong> 1024 subimages,some uniform parts <strong>of</strong> the object are not detected asparts <strong>of</strong> the background and textured background <strong>region</strong>s areclassified as <strong>region</strong>s <strong>of</strong> <strong>in</strong>terest. In most digital photographicimages, the best detection results are obta<strong>in</strong>ed when the surface<strong>of</strong> each sub-frame is about 5000 pixels, which correspond <strong>in</strong>the case <strong>of</strong> the image presented <strong>in</strong> Fig. 11 to a segmentation <strong>in</strong>19 × 19 sub-images <strong>of</strong> the <strong>in</strong>itial image. Indeed, the number <strong>of</strong>pixel must be large enough as we consider a statistical approach.7. Experimental resultsFig. 10. Region <strong>of</strong> <strong>in</strong>terest detected based on the number <strong>of</strong> unique patterns(a) and on the two characteristics (b).The method has been tested on a base <strong>of</strong> 100 digital photographicimages conta<strong>in</strong><strong>in</strong>g a dist<strong>in</strong>ct ROI which has been determ<strong>in</strong>edby a human observer. The images have been gatheredFig. 11. Regions <strong>of</strong> <strong>in</strong>terest detected us<strong>in</strong>g <strong>in</strong>verse Zipf <strong>law</strong> with an <strong>in</strong>itial segmentation <strong>in</strong> 8 × 8, 19 × 19 and 32 × 32 sub-images.
2528 Y. Caron et al. / Pattern Recognition 40 (2007) 2521–2529Table 1Detection results with different methodsMethod Detection rate (%)Zipf <strong>law</strong> 56Inverse Zipf <strong>law</strong>Number <strong>of</strong> unique patterns 80Slope <strong>of</strong> the distribution 78Both parameters 84among different public image databases. The images are uncompressedor mildly compressed and their size varies from256 × 256 to 2000 × 1500. The images have been segmented<strong>in</strong>to the optimal number <strong>of</strong> sub-images accord<strong>in</strong>g to their size.The detection is considered to be successful if the subjectiveROI is <strong>in</strong>cluded <strong>in</strong> the <strong>region</strong> detected by the process. Theresults <strong>of</strong> the different methods are detailed <strong>in</strong> Table 1 below.We may observe that the use <strong>of</strong> <strong>in</strong>verse Zipf <strong>law</strong> gives considerablybetter performances than Zipf <strong>law</strong> for detect<strong>in</strong>g theROI <strong>in</strong> images. However, the ROI detected with <strong>in</strong>verse Zipf<strong>law</strong> is <strong>of</strong>ten larger than the true ROI <strong>of</strong> the picture. Our methodhas been compared with two other detection methods, a fractalmethod adapted from those developed by Carlotto and Ste<strong>in</strong>[8] and the method <strong>of</strong> importance maps proposed by Osbergerand Maeder [1]. The fractal method consists <strong>in</strong> partition<strong>in</strong>g theimage <strong>in</strong> blocks <strong>of</strong> size 32 × 32 and comput<strong>in</strong>g the fractal dimensionD <strong>of</strong> the grey level elevation surface <strong>of</strong> each blockus<strong>in</strong>g a box-count<strong>in</strong>g approach. The ROI consists <strong>in</strong> the largestconnected component <strong>of</strong> blocks which satisfyD< ¯D − σ D or D> ¯D + σ D ,where ¯D is the average value and σ D is the standard deviation<strong>of</strong> the fractal dimension on all the image blocks. The ROI hasbeen detected <strong>in</strong> only 58% <strong>of</strong> the test images.The method <strong>of</strong> importance maps consists <strong>in</strong> segment<strong>in</strong>g theimage <strong>in</strong>to <strong>region</strong>s us<strong>in</strong>g a split-and-merge segmentation algorithmand <strong>in</strong> comput<strong>in</strong>g for each <strong>region</strong> perceptual importancefactors based on contrast, size, shape and position <strong>of</strong> the <strong>region</strong>with respect to the centre and the border <strong>of</strong> the picture.The importance value <strong>of</strong> each <strong>region</strong> is the squared sum <strong>of</strong>the five importance factors, normalized <strong>in</strong> the [0..1] <strong>in</strong>terval,the most important <strong>region</strong> hav<strong>in</strong>g an importance value <strong>of</strong> 1.This method allows the detection <strong>of</strong> the ROI <strong>in</strong> 83% <strong>of</strong> thetest images. However, this method <strong>of</strong>ten allows to detect a part<strong>of</strong> the subjective ROI, particularly when several <strong>region</strong>s are<strong>in</strong>volved.8. ConclusionPower <strong>law</strong> <strong>models</strong> such as Zipf and <strong>in</strong>verse Zipf <strong>law</strong>s canbe used to characterize the structural complexity <strong>of</strong> an image.Our former nonconstra<strong>in</strong>able hypotheses show that the use <strong>of</strong>a method based on those <strong>models</strong> allows to detect automaticallythe ROI <strong>of</strong> an image, given that this ROI appears sufficientlydist<strong>in</strong>ct from the background. Both Zipf <strong>law</strong> and <strong>in</strong>verse Zipf<strong>law</strong> can be used to detect ROI, however, the method based on<strong>in</strong>verse Zipf <strong>law</strong> produces better results for our application.The method allows the detection <strong>of</strong> ROI not only when the objectto be detected is more detailed than the background, butalso when it appears more uniform and our method is able toadapt to both cases. Our detection method based on <strong>in</strong>verse Zipf<strong>law</strong> has better performances than box-count<strong>in</strong>g fractal methodsand equivalent with importance map perceptual method.A neural network can be used for the classification, however,this method is not very adapted to our application due to thedisparity <strong>of</strong> the images, a no-explicit reference classificationmethod gives better results <strong>in</strong> our case. A possible improvement<strong>of</strong> the method would be to operate a fusion <strong>of</strong> all theparameters we have extracted or the fusion <strong>of</strong> the characteristics<strong>of</strong> <strong>power</strong> <strong>law</strong> <strong>models</strong> with the measures <strong>of</strong> more classicalperceptual features <strong>of</strong> the image such as edge detection or contrastmeasures. Indeed, our goal was to show the <strong>in</strong>terest <strong>of</strong>apply<strong>in</strong>g Zipf <strong>law</strong> model rather than propos<strong>in</strong>g a f<strong>in</strong>al processfor ROI detection. Other applications <strong>of</strong> <strong>power</strong> <strong>law</strong> <strong>models</strong> <strong>in</strong>images can be found, such as image <strong>in</strong>dexation and contentbasedimage retrieval, as well as the segmentation <strong>of</strong> videosequences.References[1] W. Osberger, A.J. Maeder, Automatic identification <strong>of</strong> perceptuallyimportant <strong>region</strong>s <strong>in</strong> an image, <strong>in</strong>: 11th International Conference onPattern Recognition, vol. 1, 1998, pp. 701–704.[2] L. Itti, C. Koch, E. Niebur, A model <strong>of</strong> saliency-based visual attentionfor rapid scene analysis, IEEE Trans. Pattern Anal. Mach. Intell. 20 (11)(1998) 1254–1259.[3] T.F. Syeda-Mahmood, Data and model-driven selection us<strong>in</strong>g colour<strong>region</strong>s, Int. J. Comput. Vision 21 (1) (1997) 9–36.[4] V. Di Gesu, C. Valenti, L. Str<strong>in</strong>ati, Local operators to detect <strong>region</strong>s <strong>of</strong><strong>in</strong>terest, Pattern Recognition Lett. 18 (1997) 1077–1081.[5] F. Stentiford, An estimator for visual attention through competitivenovelty with application to image compression, <strong>in</strong>: Picture Cod<strong>in</strong>gSymposium, Seoul, Korea, April 2001, pp. 25–27.[6] T. Kadir, M. Brady, Saliency, scale and image description, Int. J. Comput.Vision 45 (2) (2001).[7] J.Z. Wang, J. Li, R.M. Gray, G. Wiederhold, Unsupervisedmultiresolution segmentation for images with low depth <strong>of</strong> field, IEEETrans. Pattern Anal. Mach. Intell. 23 (1) (2001) 85–90.[8] M.J. Carlotto, M.C. Ste<strong>in</strong>, A method for search<strong>in</strong>g artificial objects onplanetary surfaces, J. Br. Interplanet. Soc. 43 (1990).[9] G.K. Zipf, Human Behavior and the Pr<strong>in</strong>ciple <strong>of</strong> Least Effort, Addison-Wesley, Read<strong>in</strong>g, MA, 1949.[10] V. Pareto, Cours d’économie politique, Rouge, Lausanne, 1897.[11] R. Gibrat, Les Inégalites Économiques, Librairie du Recueil, Paris, 1931.[12] B.M. Hill, Zipf’s <strong>law</strong> and prior distributions for the composition <strong>of</strong> apopulation, J. Am. Statist. Assoc. 65 (1970) 1220–1232.[13] X. Gabaix, Zipf’s <strong>law</strong> for cities: an explanation, Q. J. Econ. 114 (1999)739–767.[14] G.U. Yule, A mathematical theory <strong>of</strong> evolution based on the conclusions<strong>of</strong> Dr. J.C. Willis, F.R.S., Philos. Trans. Royal Soc. London (Ser. B)213 (1925) 21–87.[15] J. Gaite, S. Manrubia, Scal<strong>in</strong>g <strong>of</strong> void sizes and fractality <strong>in</strong> the galaxydistribution, Mon. Not. Royal Astron. Soc. 335 (4) (2002) 977–983.[16] L. Breslau, P. Cao, L. Fan, G. Phillips, S. Shenker, Web cach<strong>in</strong>g andZipf-like distributions: evidence and implications, <strong>in</strong>: Proceed<strong>in</strong>gs <strong>of</strong>INFOCOM’99, IEEE Press, New York, 1999.[17] B.A. Huberman, P. Pirolli, J. Pitkow, R. Lukose, Strong regularities <strong>in</strong>world wide web surf<strong>in</strong>g, Science 280 (1998) 95–97.[18] B. Manaris, C. McCormick, T. Purewal, Search<strong>in</strong>g for beauty <strong>in</strong> music,Applications <strong>of</strong> Zipf’s <strong>law</strong> <strong>in</strong> MIDI-encoded music, Science, the arts and
Y. Caron et al. / Pattern Recognition 40 (2007) 2521 – 2529 2529the humanities: connections and collisions, <strong>in</strong>: 2001 Sigma Xi Forum,Raleigh, NC, November 8–9, 2001.[19] E. Dellandrea, P. Makris, N. V<strong>in</strong>cent, Zipf analysis <strong>of</strong> audio signals,Revue Fractals, World Scientific, S<strong>in</strong>gapore, vol. 12(1), 2004, pp. 73–85.[20] N. V<strong>in</strong>cent, P. Makris, J. Brodier, Compressed image quality and Zipf’s<strong>law</strong>, <strong>in</strong>: Proceed<strong>in</strong>gs <strong>of</strong> International Conference on Signal Process<strong>in</strong>g(ICSP-IFIC-IAPRWCC2000), Beij<strong>in</strong>g, Ch<strong>in</strong>a, 2000, pp. 1077–1084.[21] Y. Caron, P. Makris, N. V<strong>in</strong>cent, A method for detect<strong>in</strong>g artificialobjects <strong>in</strong> natural environments, <strong>in</strong>: International Conference on PatternRecognition (ICPR2002-IAPR), Quebec, Canada, 2002, pp. 600–603.[22] B.B. Mandelbrot, An <strong>in</strong>formational theory <strong>of</strong> the statistical structure <strong>of</strong>languages, <strong>in</strong>: W. Jackson (Ed.), Communication Theory, Betterworth,1953, pp. 486–502.[23] H.A. Simon, On a class <strong>of</strong> skew distribution functions, Biometrika 42(1955) 425–440.[24] W. J Reed, The Pareto, Zipf and other <strong>power</strong> <strong>law</strong>s, Econ. Lett. 74 (2001)15–19.[25] G.K. Zipf, Psycho-Biology <strong>of</strong> Languages, Houghton-Miffl<strong>in</strong>, Boston,MA, 1935.[26] A. Cohen, R.N. Mantegna, S. Havl<strong>in</strong>, Numerical analysis <strong>of</strong> wordfrequencies <strong>in</strong> artificial and natural language texts, Fractals 5 (1) (1997)95–104.[27] R. Ferrer i Cancho, R.V. Solé, Zipf’s <strong>law</strong> and random texts, Adv.Complex Syst. 5 (1) (2002) 1–6.[28] C.S. L<strong>in</strong>dsey, M. Strömberg, Image classification us<strong>in</strong>g the frequencies<strong>of</strong> simple features, Pattern Recognition Lett. 21 (2000) 265–268.About the Author—YVES CARON has received his Ph.D. <strong>in</strong> Computer Science <strong>in</strong> 2004 from University <strong>of</strong> Tours and is now work<strong>in</strong>g <strong>in</strong> a private company<strong>in</strong> the field <strong>of</strong> image analysis. He has worked on different applications <strong>of</strong> Zipf <strong>law</strong> <strong>in</strong> image analysis.About the Author—PASCAL MAKRIS is actually work<strong>in</strong>g as Associate Pr<strong>of</strong>essor <strong>in</strong> Laboratoire d’Informatique <strong>in</strong> University <strong>of</strong> Tours where he receivedhis Ph.D. He is member <strong>of</strong> the Reconnaissance de Formes et Analyse d’Image team (RFIA). He is <strong>in</strong>terested <strong>in</strong> Power Law use <strong>in</strong> the field <strong>of</strong> differentphenomena study, sound and image. He works particularly <strong>in</strong> the field <strong>of</strong> medical images.About the Author—NICOLE VINCENT is full Pr<strong>of</strong>essor s<strong>in</strong>ce 1996. She presently heads the Center <strong>of</strong> Research <strong>in</strong> Computer Science (CRIP5) and the teamSystèmes Intelligents de Perception (SIP) <strong>in</strong> the university Paris Descartes–Paris 5. After study<strong>in</strong>g <strong>in</strong> Ecole Normale Supérieure and graduation <strong>in</strong> Mathematics,Nicole V<strong>in</strong>cent received a Ph.D. <strong>in</strong> Computer Science <strong>in</strong> 1988 from Lyon Insa. She has been <strong>in</strong>volved with several projects <strong>in</strong> pattern recognition, signal andimage process<strong>in</strong>g and video analysis. Her research <strong>in</strong>terest concerns environmental perception by vision <strong>in</strong> control, security and for medical applications.