Corporate Sustainability Disclosure in Emerging Markets
Corporate Sustainability Disclosure in Emerging Markets
Corporate Sustainability Disclosure in Emerging Markets

Create successful ePaper yourself
Turn your PDF publications into a flip-book with our unique Google optimized e-Paper software.
<strong>Corporate</strong> <strong>Susta<strong>in</strong>ability</strong> <strong>Disclosure</strong><strong>in</strong> Emerg<strong>in</strong>g <strong>Markets</strong>A basel<strong>in</strong>e study of corporate environmental, social and governance (ESG) report<strong>in</strong>g trendsamong the largest publicly traded companies <strong>in</strong> Brazil, Ch<strong>in</strong>a, India, Indonesia, Israel, theMalaysia, Mexico, the Russian Federation, South Africa and South KoreaEmerg<strong>in</strong>g <strong>Markets</strong> <strong>Disclosure</strong> Project910 17 th St. NW, Suite 1000Wash<strong>in</strong>gton, DC, USAhttp://www.social<strong>in</strong>vest.orgDec. 17, 2009
<strong>Corporate</strong> <strong>Susta<strong>in</strong>ability</strong> <strong>Disclosure</strong> Practices <strong>in</strong> Emerg<strong>in</strong>g <strong>Markets</strong>AcknowledgmentsThis publication is part of a series of research papers compiled by the Social InvestmentForum’s International Work<strong>in</strong>g Group and its Emerg<strong>in</strong>g <strong>Markets</strong> <strong>Disclosure</strong> Project (EMDP).The EMDP is chaired by representatives from SIF members Boston Common AssetManagement and Calvert Investments and receives advisory and technical support from theUnited Nations Pr<strong>in</strong>ciples for Responsible Investment (UNPRI) and the World Bank’sInternational F<strong>in</strong>ance Corp. (IFC). The research ultimately is aimed at improv<strong>in</strong>gsusta<strong>in</strong>ability disclosure <strong>in</strong> emerg<strong>in</strong>g markets and stimulat<strong>in</strong>g discussion and furtherresearch on corporate environmental, social and governance (ESG) report<strong>in</strong>g.The paper was prepared by Social Investment Forum (SIF) staff member Peter DeSimone,with Lauren Compere (Boston Common Asset Management), Mike Lombardo (Calvert<strong>in</strong>vestments), Stephen H<strong>in</strong>e and Stephanie Maier (EIRIS), Lucy Carmody (ResponsibleResearch), Krist<strong>in</strong> Lang (SIF), Nar<strong>in</strong>a Mnatsakanian and Valeria Piani (United NationsPr<strong>in</strong>ciples for Responsible Investment) k<strong>in</strong>dly provid<strong>in</strong>g a peer review of the study.SIF expresses special appreciation to Anthony Miller and Jel<strong>in</strong>a Mitrovic of UNCTAD forprovid<strong>in</strong>g the data used for this report’s analysis. The UNCTAD data is taken from twopapers of the Intergovernmental Work<strong>in</strong>g Group of Experts on International Standards ofAccount<strong>in</strong>g and Report<strong>in</strong>g (ISAR) published <strong>in</strong> 2008: Review of the report<strong>in</strong>g status ofcorporate responsibility <strong>in</strong>dicators and Review of the implementation status of corporategovernance disclosures: an exam<strong>in</strong>ation of report<strong>in</strong>g practices among large enterprises <strong>in</strong> 10emerg<strong>in</strong>g markets. Both are available at www.unctad.org/isar.The views expressed <strong>in</strong> this report are solely those of SIF.2 - Copyright © 2009 Social Investment Forum, Wash<strong>in</strong>gton, DC
<strong>Corporate</strong> <strong>Susta<strong>in</strong>ability</strong> <strong>Disclosure</strong> Practices <strong>in</strong> Emerg<strong>in</strong>g <strong>Markets</strong>AbstractThis report is a basel<strong>in</strong>e study of corporate environmental, social and governance (ESG)report<strong>in</strong>g trends among the largest publicly traded companies <strong>in</strong> Brazil, Ch<strong>in</strong>a, India,Indonesia, Israel, Malaysia, Mexico, the Russian Federation, South Africa and South Korea.ContentsI. Executive Summary .............................................................................................. 4II. Background and Research Method........................................................................ 7A. Market and Company Selection..................................................................8B. Companies Analyzed by Sector...................................................................9C. Indicator Selection and Research Methods...............................................10III.F<strong>in</strong>d<strong>in</strong>gs...............................................................................................................11A. <strong>Disclosure</strong> Indicators and Overall Results .................................................11B. Country, Sector and Document Trends.....................................................12C. Environmental Metrics .............................................................................15D. Social Indicators.......................................................................................16E. Governance Factors..................................................................................17F. References to GRI and the Global Compact...............................................19IV. Comparisons to other Studies ..............................................................................21A. Developed Countries................................................................................21B. Emerg<strong>in</strong>g <strong>Markets</strong> ....................................................................................21V. Conclusions and Recommendations.....................................................................24VI. Annex: List of Companies Evaluated by Country ..................................................26VII.Annex: EMDP Investor Statement on <strong>Susta<strong>in</strong>ability</strong> Report<strong>in</strong>g <strong>in</strong> Emerg<strong>in</strong>g <strong>Markets</strong>...........................................................................................................................28A. Statement ................................................................................................28B. Signatories ...............................................................................................30December 2009 - 3
<strong>Corporate</strong> <strong>Susta<strong>in</strong>ability</strong> <strong>Disclosure</strong> Practices <strong>in</strong> Emerg<strong>in</strong>g <strong>Markets</strong>I. Executive SummaryThe Social Investment Forum’s (SIF) International Work<strong>in</strong>g Group commissioned this reportfor its Emerg<strong>in</strong>g <strong>Markets</strong> <strong>Disclosure</strong> Project (EMDP). It is the third <strong>in</strong> a series of basel<strong>in</strong>estudies aimed at establish<strong>in</strong>g corporate environmental, social and governance (ESG)report<strong>in</strong>g trends <strong>in</strong> the largest emerg<strong>in</strong>g markets worldwide. 1 The study’s aim is to assistthe EMDP <strong>in</strong> sett<strong>in</strong>g goals and priorities for its country teams <strong>in</strong> the years ahead, as theproject beg<strong>in</strong>s corporate engagement efforts to promote greater susta<strong>in</strong>ability report<strong>in</strong>g <strong>in</strong>emerg<strong>in</strong>g markets. The United Nations Conference on Trade and Development (UNCTAD)generously provided the underly<strong>in</strong>g data for this report.Paper’s scope: This third disclosure assessment covers more companies than itspredecessors. It <strong>in</strong>cludes the top 10 companies by market capitalization <strong>in</strong> 10 of the world’slargest emerg<strong>in</strong>g markets—Brazil, Ch<strong>in</strong>a, India, Indonesia, Israel, Malaysia, Mexico, theRussian Federation, South Africa and South Korea—for a total universe of 100 companies.As a group, the 100 companies represent 46.5 percent of the market capitalization of theMSCI-EM Index 2 as of March 12, 2008. Consequently, the sample chosen represents a largeportion of the <strong>in</strong>vestable universe of emerg<strong>in</strong>g market enterprises and the largest <strong>in</strong> thebasel<strong>in</strong>e series of reports. Meanwhile, the first report <strong>in</strong> the series, released <strong>in</strong> January2008, covered 75 companies, while the second, published <strong>in</strong> March 2009, analyzed 40companies. On a geographic basis, the March 2009 report also spanned 10 countries, whilethe January 2008 report covered only seven.The March 2009 report and this one both have roughly the same number of <strong>in</strong>dicators. Thisreport analyzes the companies’ report<strong>in</strong>g practices on five environmental, five social and 10corporate governance <strong>in</strong>dicators for 20 <strong>in</strong> all. In contrast, the January 2009 report askedfive basic questions about report<strong>in</strong>g.International comparisons: Among this paper’s key f<strong>in</strong>d<strong>in</strong>gs was that, while almost allemerg<strong>in</strong>g market companies report on at least one ESG factor—96 percent of this paper’suniverse, few conform to a global standard, such as the guidel<strong>in</strong>es of the Global Report<strong>in</strong>gInitiative (GRI). Researchers found that only:• 14 of the 100 declared report<strong>in</strong>g <strong>in</strong> accordance with the GRI’s guidel<strong>in</strong>es, with amere 20 mak<strong>in</strong>g reference to the GRI.1 The two other studies <strong>in</strong> the series are:EIRIS. (March 2009). “A Review of ESG Practices <strong>in</strong> Large Emerg<strong>in</strong>g Market Companies.” Wash<strong>in</strong>gton, DC:Social Investment Forum and Susta<strong>in</strong>able Investment Research Analyst Network.KLD Research & Analytics. (January 2008). “<strong>Susta<strong>in</strong>ability</strong> Report<strong>in</strong>g <strong>in</strong> Emerg<strong>in</strong>g <strong>Markets</strong>: An analysis ofthe susta<strong>in</strong>ability report<strong>in</strong>g <strong>in</strong> selected sectors of seven emerg<strong>in</strong>g market countries.” Wash<strong>in</strong>gton,DC: Social Investment Forum and Susta<strong>in</strong>able Investment Research Analyst Network.2 MSCI is a commercial provider of f<strong>in</strong>ancial <strong>in</strong>formation, <strong>in</strong>clud<strong>in</strong>g equity <strong>in</strong>dices track<strong>in</strong>g publiclylisted companies around the world. The MSCI-EM Index is a gauge of emerg<strong>in</strong>g marketsperformance widely used by <strong>in</strong>stitutional <strong>in</strong>vestors, and is an important tool for facilitat<strong>in</strong>gforeign portfolio <strong>in</strong>vestment to develop<strong>in</strong>g countries and countries with economies <strong>in</strong>transition. All MSCI EM Index data used <strong>in</strong> this study is based on the <strong>in</strong>dex as of March 12,2008.4 - Copyright © 2009 Social Investment Forum, Wash<strong>in</strong>gton, DC
<strong>Corporate</strong> <strong>Susta<strong>in</strong>ability</strong> <strong>Disclosure</strong> Practices <strong>in</strong> Emerg<strong>in</strong>g <strong>Markets</strong>• Of the 28 companies listed as signatories to the United Nations Global Compact, only18 (64 percent) produced a Communication on Progress (COP) and/or a GRI report <strong>in</strong>compliance with the Compact’s report<strong>in</strong>g requirements.Still, companies <strong>in</strong> emerg<strong>in</strong>g markets only lagged counterparts <strong>in</strong> developed nations by asmall marg<strong>in</strong> and even outperformed them <strong>in</strong> a few <strong>in</strong>stances. As tracked by<strong>Corporate</strong>Register.com, about one third of the constituents <strong>in</strong> the Global FT 500 producesusta<strong>in</strong>ability reports that follow the GRI’s report<strong>in</strong>g standards. 3 In addition, among theworld’s largest exchanges, GRI found that 64 percent of Germany’s DAX 30, 48 percent ofFrance’s CAC 40, 22 percent of the United K<strong>in</strong>gdom’s FTSE 100 and only 13 percent of theUnited States’ S&P 500 issued susta<strong>in</strong>ability reports us<strong>in</strong>g the GRI’s latest G3 Guidel<strong>in</strong>es. 4Issue areas: Descriptions of governance structures and board committees was the mostcommonly reported <strong>in</strong>dicator among the 100 companies, with 96 percent of the samplereport<strong>in</strong>g on this <strong>in</strong>dicator. It was followed by data on employee wages and benefits withrelated breakdowns by employment type and gender (90 percent). The only other nongovernance<strong>in</strong>dicator to make the top 10 for disclosure was another social <strong>in</strong>dicator, totalwork force composition by employment type, contract status and gender (83 percent). The10 governance metrics averaged the highest report<strong>in</strong>g rates (72.7 percent). In fact, only 11of the 20 <strong>in</strong>dicators had disclosure rates of greater than 50 percent, n<strong>in</strong>e governance andthe two social data elements mentioned above.Of the three categories (environmental, social and governance), environmental <strong>in</strong>formationwas the least likely to be reported (30.6 percent on average). Of the environmental issuesassessed, energy use was the most disclosed item (39 percent) and ranked 13 out of the 20<strong>in</strong>dicators, followed by water use (34 percent). Climate-related data were placed a distantthird (30 percent) among environmental issues and 15 th overall.However, the much higher rates of report<strong>in</strong>g on governance <strong>in</strong>formation <strong>in</strong> general and twosocial elements mentioned above likely resulted from regulatory and list<strong>in</strong>g requirements <strong>in</strong>several of the countries studied. Other social issues considered key to a company’ssusta<strong>in</strong>ability, such as data on workplace related accidents and illnesses (24 percent), werereported at much lower rates than many environmental criteria. Still, social criteria werethe second most likely type of criteria to be reported overall (47.4 percent).Country f<strong>in</strong>d<strong>in</strong>gs: Companies from South Africa exhibited the best overall transparencypractices, while firms from Ch<strong>in</strong>a, India, Indonesia and Mexico lagged. Notably, South Africawas the only country with all of its companies report<strong>in</strong>g some form of ESG data, while Indiahad the highest rate (40 percent) of companies disclos<strong>in</strong>g no form of ESG <strong>in</strong>formation. Afactor driv<strong>in</strong>g susta<strong>in</strong>ability report<strong>in</strong>g <strong>in</strong> South Africa is that the country’s JohannesburgStock Exchange (JSE) operates a socially responsible <strong>in</strong>vestment (SRI) <strong>in</strong>dex, requires the top3 <strong>Corporate</strong>Register.com. (March 2009). CRReport<strong>in</strong>gAwards ’08, Global W<strong>in</strong>ners & Report<strong>in</strong>g Trends.Retrieved June 15, 2009, from http://www.corporateregister.com/pdf/CRRA08.pdf.4 Global Report<strong>in</strong>g Initiative. (July 15, 2009). “Number of companies worldwide report<strong>in</strong>g on their susta<strong>in</strong>abilityperformance reaches record high, yet still a m<strong>in</strong>ority.” Retrieved July 16, 2009, fromhttp://www.globalreport<strong>in</strong>g.org/NewsEventsPress/PressResources/PressRelease_14_July_2006_1000GRIReports.htm.December 2009 - 5
<strong>Corporate</strong> <strong>Susta<strong>in</strong>ability</strong> <strong>Disclosure</strong> Practices <strong>in</strong> Emerg<strong>in</strong>g <strong>Markets</strong>II. Background and Research MethodThe EMDP began as an <strong>in</strong>ternational <strong>in</strong>itiative to improve susta<strong>in</strong>ability disclosure <strong>in</strong>emerg<strong>in</strong>g markets shortly after the idea was proposed by Calvert Investments at the “PRI <strong>in</strong>Person” Conference <strong>in</strong> July 2007. The project quickly became a collaborative effort by theSocial Investment Forum (SIF) and its members, <strong>in</strong>clud<strong>in</strong>g project co-chairs Boston CommonAsset Management and Calvert Investments, as well as EIRIS and KLD Research & Analytics(now owned by SIF member RiskMetrics Group). In addition, the World Bank’s InternationalF<strong>in</strong>ance Corp. (IFC), the United Nations Conference on Trade and Development (UNCTAD)and the United Nations Pr<strong>in</strong>ciples for Responsible Investment (UNPRI) have provided theEMDP with technical support and data. SIF acts as the project’s secretariat.The EMDP has three, overlapp<strong>in</strong>g phases. Dur<strong>in</strong>g the first, which <strong>in</strong>cludes this report, EMDPpartners collected basel<strong>in</strong>e data to ascerta<strong>in</strong> susta<strong>in</strong>ability report<strong>in</strong>g levels <strong>in</strong> emerg<strong>in</strong>gmarkets. Dur<strong>in</strong>g the second, EMDP drafted and promoted an <strong>in</strong>vestor sign-on letter so thatother <strong>in</strong>vestors could express support of greater transparency <strong>in</strong> corporate report<strong>in</strong>g onsusta<strong>in</strong>ability issues and the project’s overall goals. F<strong>in</strong>ally, as part of phase three, theEMDP has developed country teams and plans and has begun to implement them. Countryteams will soon beg<strong>in</strong> to engage companies directly <strong>in</strong> a dialogue to improve the companies’ESG report<strong>in</strong>g practices.Dur<strong>in</strong>g phase one, EMDP project partners gathered benchmark data on susta<strong>in</strong>abilityreport<strong>in</strong>g <strong>in</strong> the emerg<strong>in</strong>g markets where the project would be active. SIF and two of itswork<strong>in</strong>g groups—the International Work<strong>in</strong>g Group (IWG) and the Susta<strong>in</strong>able InvestmentResearch Analyst Network (SIRAN)—<strong>in</strong> collaboration with SIF member KLD Research &Analytics published the first study, <strong>Susta<strong>in</strong>ability</strong> Report<strong>in</strong>g <strong>in</strong> Emerg<strong>in</strong>g <strong>Markets</strong>: An analysisof the susta<strong>in</strong>ability report<strong>in</strong>g <strong>in</strong> selected sectors of seven emerg<strong>in</strong>g market countries, <strong>in</strong>January 2008. It was followed by a second report, A Review of ESG Practices <strong>in</strong> LargeEmerg<strong>in</strong>g Market Companies produced by EIRIS and SIF <strong>in</strong> March 2009. This report is thelast of the series of basel<strong>in</strong>e studies to assess report<strong>in</strong>g trends <strong>in</strong> the emerg<strong>in</strong>g marketswhere EMDP country teams will be actively engag<strong>in</strong>g companies, encourag<strong>in</strong>g them to issuesusta<strong>in</strong>ability reports <strong>in</strong> l<strong>in</strong>e with global best practices such as the Global Report<strong>in</strong>gInitiative’s G3 Guidel<strong>in</strong>es.This study’s purpose is to evaluate the level of report<strong>in</strong>g on ESG issues among the top 10companies <strong>in</strong> each of 10 lead<strong>in</strong>g emerg<strong>in</strong>g markets, as def<strong>in</strong>ed by weight<strong>in</strong>gs <strong>in</strong> the MorganStanley Capital International Emerg<strong>in</strong>g <strong>Markets</strong> (MSCI-EM) Index. 5 To assess report<strong>in</strong>gpractices, researchers selected 20 key performance <strong>in</strong>dicators from 75 presented <strong>in</strong> twostudies UNCTAD published <strong>in</strong> 2008. 6 Researchers then compared these f<strong>in</strong>d<strong>in</strong>gs with those5 MSCI is a commercial provider of f<strong>in</strong>ancial <strong>in</strong>formation, <strong>in</strong>clud<strong>in</strong>g equity <strong>in</strong>dices track<strong>in</strong>g publicly listedcompanies around the world. The MSCI-EM Index is a gauge of emerg<strong>in</strong>g markets performance widelyused by <strong>in</strong>stitutional <strong>in</strong>vestors, and is an important tool for facilitat<strong>in</strong>g foreign portfolio <strong>in</strong>vestment todevelop<strong>in</strong>g countries and countries with economies <strong>in</strong> transition. All MSCI EM Index data used <strong>in</strong> thisstudy is based on the <strong>in</strong>dex as of March 12, 2008.6 UNCTAD. (2008). Review of the report<strong>in</strong>g status of corporate responsibility <strong>in</strong>dicators’ and Review of theimplementation status of corporate governance disclosures: an exam<strong>in</strong>ation of report<strong>in</strong>g practices amonglarge enterprises <strong>in</strong> 10 emerg<strong>in</strong>g markets. Geneva, Switzerland: UNCTAD.December 2009 - 7
<strong>Corporate</strong> <strong>Susta<strong>in</strong>ability</strong> <strong>Disclosure</strong> Practices <strong>in</strong> Emerg<strong>in</strong>g <strong>Markets</strong>from two other reports produced for SIF work<strong>in</strong>g group SIRAN. 7 The aim of this exercise wasto establish a basel<strong>in</strong>e of <strong>in</strong>formation on corporate ESG disclosure across emerg<strong>in</strong>g marketsto enable the EMDP to assess priorities and progress <strong>in</strong> promot<strong>in</strong>g susta<strong>in</strong>ability report<strong>in</strong>g <strong>in</strong>these markets <strong>in</strong> the years ahead.The report presents statistics on the ESG disclosure practices of the top 10 companies bymarket capitalization <strong>in</strong> each of the top 10 emerg<strong>in</strong>g market economies by <strong>in</strong>dex weight<strong>in</strong>g<strong>in</strong> the MSCI-EM Index, with one caveat. Indonesia, the 11 th largest market <strong>in</strong> the MSCI-EM,was substituted for Taiwan <strong>in</strong> the study, because data from UNCTAD was only available formembers of the United Nations. Based on their weight<strong>in</strong>gs <strong>in</strong> the <strong>in</strong>dex and this oneexception, the markets studied are Brazil, Ch<strong>in</strong>a, India, Indonesia, Israel, Malaysia, Mexico,the Russian Federation, South Africa and South Korea.A. Market and Company SelectionThe top 10 emerg<strong>in</strong>g markets by weight with<strong>in</strong> the MSCI-EM Index as of March 12, 2008, arelisted <strong>in</strong> Table 1. As the table shows, the most heavily weighted countries are Brazil (14.9percent), followed by Ch<strong>in</strong>a, (14.2 percent), South Korea (13.2 percent) and the RussianFederation (10.0 percent). The four altogether account for more than half—52.3 percent—of the <strong>in</strong>dex. As mentioned earlier, Indonesia was substituted for Taiwan, because Taiwan isnot a UN member, and therefore UNCTAD, the data source for this report, had excludedTaiwan from its earlier studies. Readers should note that Taiwan ranks fourth by weight<strong>in</strong>g<strong>in</strong> the MSCI-EM Index at 11.3 percent, while Indonesia ranks at 11 th with 1.7 percent. Apositive for the substitution of Taiwan for Indonesia is that the EMDP has a country team <strong>in</strong>Indonesia, while it does not have a team <strong>in</strong> Taiwan. (The other countries where EMDP hasteams plann<strong>in</strong>g to engage companies on ESG disclosure issues are Brazil, Ch<strong>in</strong>a, India, theRussian Federation, South Africa and South Korea.)The researchers selected the companies for this study on the basis of their economicsignificance with<strong>in</strong> their home countries. Table 1 shows that each of the 10 sets of 10companies selected for this study account for between 45 percent and 84 percent of theirrespective country’s <strong>in</strong>dex weight<strong>in</strong>g. In fact, for the Russian Federation, Mexico, Israel andIndonesia, the companies studied represent more than 80 percent of each market’s totalweight<strong>in</strong>g <strong>in</strong> the MSCI-EM Index. As a group, the 100 companies <strong>in</strong> the study’s universerepresent 46.5 percent of the market capitalization of the entire MSCI-EM Index as of March12, 2008. Consequently, the sample chosen represents a large portion of the <strong>in</strong>vestableuniverse of emerg<strong>in</strong>g market enterprises. A complete list of companies <strong>in</strong>cluded <strong>in</strong> thestudy’s universe, by country, is found <strong>in</strong> the Annex on page 26.7 EIRIS. (March 2009). “A Review of ESG Practices <strong>in</strong> Large Emerg<strong>in</strong>g Market Companies.” Wash<strong>in</strong>gton, DC:Social Investment Forum and Susta<strong>in</strong>able Investment Research Analyst Network.KLD Research & Analytics. (January 2008). “<strong>Susta<strong>in</strong>ability</strong> Report<strong>in</strong>g <strong>in</strong> Emerg<strong>in</strong>g <strong>Markets</strong>: An analysis of thesusta<strong>in</strong>ability report<strong>in</strong>g <strong>in</strong> selected sectors of seven emerg<strong>in</strong>g market countries.” Wash<strong>in</strong>gton, DC: SocialInvestment Forum and Susta<strong>in</strong>able Investment Research Analyst Network.8 - Copyright © 2009 Social Investment Forum, Wash<strong>in</strong>gton, DC
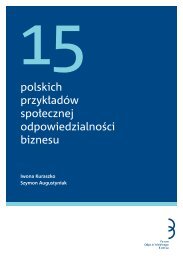
<strong>Corporate</strong> <strong>Susta<strong>in</strong>ability</strong> <strong>Disclosure</strong> Practices <strong>in</strong> Emerg<strong>in</strong>g <strong>Markets</strong>Table 1. Top 10 Emerg<strong>in</strong>g <strong>Markets</strong> <strong>in</strong> the MSCI EM Index by Index Weight<strong>in</strong>gCountryIndex weight<strong>in</strong>gof country(percent)Number ofcompanies fromthis country <strong>in</strong> the<strong>in</strong>dexSelected top 10companies aspercent of countryweight<strong>in</strong>gSelected top 10companies as percent of<strong>in</strong>dex total marketcapitalizationBrazil 14.9 72 50 7.5Ch<strong>in</strong>a 14.2 112 56 8.0South Korea 13.2 114 45 6.0Russian Federation 10.0 32 82 8.2India 7.2 67 52 3.7South Africa 6.7 50 63 4.2Mexico 4.8 28 84 4.0Israel 2.4 32 84 2.0Malaysia 2.4 57 59 1.4Indonesia 1.7 22 83 1.4Total 77.4 46.5Source: UNCTADB. Companies Analyzed by SectorThe firms <strong>in</strong>cluded <strong>in</strong> the study represent a wide range of <strong>in</strong>dustries. Researchers used theGlobal Industry Classification Standards to classify companies. The distribution of the 100companies by sector is displayed <strong>in</strong> Figure 1 below. F<strong>in</strong>ancial services, materials, energy andtelecommunications account for the largest portions of the universe of companies and fornearly 70 percent of all of the companies reviewed.Figure 1. Number of Companies by Industry Sector 8Source: UNCTAD8 Based on Global Industry Classification Standard (GICS) as of Aug. 29, 2008. Source: www.mscibarra.com.December 2009 - 9
<strong>Corporate</strong> <strong>Susta<strong>in</strong>ability</strong> <strong>Disclosure</strong> Practices <strong>in</strong> Emerg<strong>in</strong>g <strong>Markets</strong>C. Indicator Selection and Research MethodsAs mentioned earlier, this basel<strong>in</strong>e study assesses company disclosures on 20 susta<strong>in</strong>ability<strong>in</strong>dicators—five environmental, five social and 10 governance—drawn from two UNCTADreports. The list of <strong>in</strong>dicators appears <strong>in</strong> the next section. Researchers culled data frompublicly available sources, <strong>in</strong>clud<strong>in</strong>g companies’ publicly available f<strong>in</strong>ancial reports and,when appropriate, securities fil<strong>in</strong>gs, stand-alone susta<strong>in</strong>ability reports and websites.Researchers also exam<strong>in</strong>ed the location of corporate responsibility <strong>in</strong>formation. Adist<strong>in</strong>ction was made between companies that report <strong>in</strong>formation <strong>in</strong> a specific section of theannual report, without a separate susta<strong>in</strong>ability report, those with a separate susta<strong>in</strong>abilityreport, and still others only offer<strong>in</strong>g <strong>in</strong>formation on their websites. Researchers did notcontact companies to see if other <strong>in</strong>formation was available upon request.10 - Copyright © 2009 Social Investment Forum, Wash<strong>in</strong>gton, DC
<strong>Corporate</strong> <strong>Susta<strong>in</strong>ability</strong> <strong>Disclosure</strong> Practices <strong>in</strong> Emerg<strong>in</strong>g <strong>Markets</strong>III. F<strong>in</strong>d<strong>in</strong>gsA. <strong>Disclosure</strong> Indicators and Overall ResultsTable 2 lists the 20 disclosure items selected for this study. The <strong>in</strong>dicators are arranged <strong>in</strong>tothree categories: environmental (five <strong>in</strong>dicators), social (five) and governance (10). Thenumber of companies disclos<strong>in</strong>g <strong>in</strong> each category is listed <strong>in</strong> the column next to each<strong>in</strong>dicator. As reflected <strong>in</strong> Table 2 below, governance structures and board committees wasthe most commonly reported <strong>in</strong>dicator among the companies studied (96 percent), followedby employee wages and benefits with breakdowns by employment type and gender (90percent) and risk management objectives (88 percent). The 10 governance metrics overallaveraged the highest report<strong>in</strong>g rates (72.7 percent). Another social <strong>in</strong>dicator, total workforce composition by employment type, contract status and gender, also had a highdisclosure rate (83 percent).Table 2. Number of Companies Disclos<strong>in</strong>g Information on each IndicatorIndicatorEnvironmentalNumber ofcompaniesEnergy use 39Water consumption 34Global warm<strong>in</strong>g contribution 30Material efficiency 27Waste generated 23SocialEmployee wages and benefits with breakdown by employment type and gender 90Total work force with breakdown by employment type, employment contract and gender 83Average hours of tra<strong>in</strong><strong>in</strong>g per year per employee broken down by employee category 26Work days lost due to occupational accidents, <strong>in</strong>juries and illness 24Percentage of employees covered by collective agreements 14GovernanceGovernance structures, such as committees and other mechanisms to prevent conflict of<strong>in</strong>terestRisk management objectives, system and activities 88Ownership structure 87Internal control systems 86Availability and accessibility of meet<strong>in</strong>g agenda 84Process for hold<strong>in</strong>g annual general meet<strong>in</strong>gs 68Performance evaluation process 66Existence of procedure(s) for address<strong>in</strong>g conflicts of <strong>in</strong>terest among board members 54The decision mak<strong>in</strong>g process for approv<strong>in</strong>g transactions with related parties 53Policy on whistleblower protection for all employees 45Source: UNCTAD96December 2009 - 11
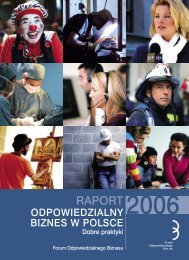
<strong>Corporate</strong> <strong>Susta<strong>in</strong>ability</strong> <strong>Disclosure</strong> Practices <strong>in</strong> Emerg<strong>in</strong>g <strong>Markets</strong>Of the three categories (environmental, social and governance), environmental policies andmetrics were the least likely to be reported (30.6 percent on average). Of theenvironmental issues assessed, energy use (39 percent) was the most disclosed item andranked 13 out of the 20 <strong>in</strong>dicators, followed by water use (34 percent). Climate-related<strong>in</strong>formation (30 percent) placed a distant third among environmental issues and 15 th overall,while efficiency <strong>in</strong> us<strong>in</strong>g materials (27 percent) and waste generation (23 percent) trailed.However, the much higher rates of report<strong>in</strong>g on governance <strong>in</strong>formation <strong>in</strong> general and twosocial elements mentioned above likely resulted from regulatory and list<strong>in</strong>g requirements <strong>in</strong>several of the countries studied. Other social issues considered key to a company’ssusta<strong>in</strong>ability, such as data on workplace related accidents and illnesses (24 percent) andunionization rates (14 percent), were reported at much lower rates than manyenvironmental criteria, with unionization rates w<strong>in</strong>n<strong>in</strong>g the dubious dist<strong>in</strong>ction of be<strong>in</strong>g theleast likely disclosed out of all of the <strong>in</strong>dicators. Still, social criteria were the second mostlikely to be reported (47.4 percent) overall.B. Country, Sector and Document TrendsResearchers reviewed where each firm’s disclosure took place, whether <strong>in</strong> the annual reportor a separate corporate responsibility report, or on the company’s website, and then brokethis down by the company’s country of orig<strong>in</strong>. The results are displayed <strong>in</strong> Figure 2. Inaddition, the chart displays the number of companies that do not explicitly disclosecorporate responsibility <strong>in</strong>formation by country. 9By country: South African companies had the best record for report<strong>in</strong>g, with all disclos<strong>in</strong>gon at least one of the ESG <strong>in</strong>dicators chosen for this study and all do<strong>in</strong>g so <strong>in</strong> a susta<strong>in</strong>abilitysection of the annual report or <strong>in</strong> a separate susta<strong>in</strong>ability report. South Africa was followedby Malaysia and South Korea, where n<strong>in</strong>e out of 10 companies exam<strong>in</strong>ed <strong>in</strong> each countryreported on ESG issues. One reason for South Africa’s strong show<strong>in</strong>g is its stock exchange’slist<strong>in</strong>g requirements. The Johannesburg Stock Exchange requires its top 40 companies bymarket capitalization to report on a core set of susta<strong>in</strong>ability <strong>in</strong>dicators and encouragesothers to do so by offer<strong>in</strong>g a slot <strong>in</strong> its JSE Socially Responsible Investment Index to the bestperformers. 10 Brazil’s Sao Paulo Stock Exchange has a similar ESG <strong>in</strong>dex and also surveys itslargest issuers on susta<strong>in</strong>ability policies and practices. 119 ‘Explicit’ disclosure <strong>in</strong> this context means <strong>in</strong>formation that is dist<strong>in</strong>ctly presented as ‘corporate responsibility’or ‘susta<strong>in</strong>ability’ <strong>in</strong>formation <strong>in</strong> a recognized portion of the annual report, website or other companypublication.10 Johannesburg Stock Exchange. (n.d.). Retrieved Oct. 22, 2009, fromhttp://www.jse.co.za/sri/development_<strong>in</strong>dex.jsp11 Sao Paulo Stock Exchange. (n.d.). Retrieved Oct. 22, 2009, fromhttp://www.bovespa.com.br/Market/MarketIndexes/ise_i.shtml.12 - Copyright © 2009 Social Investment Forum, Wash<strong>in</strong>gton, DC
<strong>Corporate</strong> <strong>Susta<strong>in</strong>ability</strong> <strong>Disclosure</strong> Practices <strong>in</strong> Emerg<strong>in</strong>g <strong>Markets</strong>Figure 2. Number of Firms Report<strong>in</strong>g ESG Information by Country and Document Type0 1 2 3 4 5 6 7 8 9 10BrazilCh<strong>in</strong>aIndiaIndonesiaIsraelCR section <strong>in</strong> annualreportSeperate CR reportCompany websiteRepublic ofKoreaNo explicit CR<strong>in</strong>formationMalaysiaMexicoRussianFederationSouth AfricaSource: UNCTADDecember 2009 - 13
<strong>Corporate</strong> <strong>Susta<strong>in</strong>ability</strong> <strong>Disclosure</strong> Practices <strong>in</strong> Emerg<strong>in</strong>g <strong>Markets</strong>Meanwhile, India (60 percent), followed by Indonesia (70 percent), Israel (70 percent) andMexico (70 percent), had the lowest disclosure rates, as measured by the percentage ofcompanies not disclos<strong>in</strong>g on any of the ESG <strong>in</strong>dicators selected for the study. The resultswere surpris<strong>in</strong>g for Indonesia, which has statutory requirements for natural resourcecompanies to report, and for Israel, where the local exchange sponsors an SRI <strong>in</strong>dex. Ch<strong>in</strong>a’sposition <strong>in</strong> second to last place <strong>in</strong> corporate susta<strong>in</strong>ability transparency also is unexpectedgiven recent government disclosure requirements there. Ch<strong>in</strong>a’s <strong>in</strong>fluential State-OwnedAssets Supervision and Adm<strong>in</strong>istration Commission released a directive <strong>in</strong> January 2008,strongly encourag<strong>in</strong>g state-owned enterprises to follow sound susta<strong>in</strong>ability practices and toreport on their susta<strong>in</strong>ability activities. 12 In addition, the Shanghai Stock Exchange issued acommunication to listed companies <strong>in</strong> May 2008, encourag<strong>in</strong>g them to improve ESGperformance by committ<strong>in</strong>g to “promot<strong>in</strong>g susta<strong>in</strong>able development of the economy andsociety.” 13 The Shenzhen Stock Exchange also released social responsibility guidel<strong>in</strong>es for itslisted companies <strong>in</strong> September 2006. 14 However, as much of this new guidance for Ch<strong>in</strong>awas issued <strong>in</strong> 2008, companies there have had little time for management to react and toreallocate budgets and for an uptick <strong>in</strong> susta<strong>in</strong>ability report<strong>in</strong>g to be measured <strong>in</strong> this study.Overall, Mexican (10), Korean (n<strong>in</strong>e) and South African (n<strong>in</strong>e) companies were the mostlikely to <strong>in</strong>clude susta<strong>in</strong>ability <strong>in</strong>formation <strong>in</strong> annual reports. Firms from Indonesia (zero),Israel (one) and Malaysia (one) were the least likely to do so. South African companies(seven), followed by Ch<strong>in</strong>a (six), Brazil (five) and South Korea (five) were the most likely topublish standalone susta<strong>in</strong>ability reports, while firms from India (one), Malaysia (one),Indonesia (two) and Israel (two) were the least likely to have a separate susta<strong>in</strong>abilityreport. (As the data and Figure 2 <strong>in</strong>dicate, some companies posted ESG <strong>in</strong>formation <strong>in</strong>multiple places—annual report, separate susta<strong>in</strong>ability report and/or corporate website.)By sector: By <strong>in</strong>dustry, firms <strong>in</strong> the extractives sector, perhaps because of the significantcontroversies surround<strong>in</strong>g the <strong>in</strong>dustry and stakeholder pressure for these types ofcompanies to report and improve performance, were among the most likely to report ESG<strong>in</strong>formation. Given the small sample size, the researchers found no other outliers by sector.By disclosure document: Of the 100 companies exam<strong>in</strong>ed, 69 dedicated a specific sectionof the annual report to corporate responsibility issues. Another 35 published separatesusta<strong>in</strong>ability reports, and 28 of those also <strong>in</strong>cluded the <strong>in</strong>formation <strong>in</strong> the annual report.F<strong>in</strong>ally, n<strong>in</strong>e firms published their ESG <strong>in</strong>formation only on the company website. All told,almost all of the companies—96—disclosed some k<strong>in</strong>d of corporate responsibility<strong>in</strong>formation. (As noted above, many companies reported susta<strong>in</strong>ability <strong>in</strong>formation <strong>in</strong>several places.)12 CSR Asia. (Jan. 9, 2008). “CSR as ‘No. 1’ Issue for state-owned enterprises <strong>in</strong> Ch<strong>in</strong>a.” CSR Asia. RetrievedOct. 22, 2009, from http://www.gl<strong>in</strong>et.org/standard.asp?id=4955.13 Shanghai Stock Exchange. (May 14, 2008). “SSE Drives Listed Companies to Fulfil Social Responsibilities.”Retrieved Oct. 22, 2009, fromhttp://www.sse.com.cn/sseportal/webapp/datapresent/EnglishNews?PAGE=6.14 Shenzhen Stock Exchange. (n.d.). Retrieved June 1, 2009, fromhttp://www.szse.cn/ma<strong>in</strong>/en/rulseandregulations/sserules/2007060410636.shtml.14 - Copyright © 2009 Social Investment Forum, Wash<strong>in</strong>gton, DC
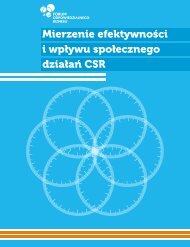
<strong>Corporate</strong> <strong>Susta<strong>in</strong>ability</strong> <strong>Disclosure</strong> Practices <strong>in</strong> Emerg<strong>in</strong>g <strong>Markets</strong>C. Environmental MetricsAs mentioned earlier, researchers looked at environmental disclosure <strong>in</strong> five areas—wateruse, carbon emissions, energy use, waste generation and materials efficiency. Figure 3displays the number of companies <strong>in</strong> emerg<strong>in</strong>g markets that disclose quantitative<strong>in</strong>formation on each of the selected environmental <strong>in</strong>dicators. The study also dist<strong>in</strong>guishedbetween f<strong>in</strong>ancial and non-f<strong>in</strong>ancial disclosures. F<strong>in</strong>ancial <strong>in</strong>formation on environmentalissues was def<strong>in</strong>ed as <strong>in</strong>formation reported <strong>in</strong> monetary units, while non-f<strong>in</strong>ancial<strong>in</strong>formation was def<strong>in</strong>ed as <strong>in</strong>formation <strong>in</strong> physical units, such as liters, kilojoules and cubicmeters. Readers should note that companies sometimes disclose both f<strong>in</strong>ancial and nonf<strong>in</strong>ancial<strong>in</strong>formation on the same <strong>in</strong>dicator. Therefore, the total number of enterprises <strong>in</strong>Figure 3 is not necessarily the sum of the total number of f<strong>in</strong>ancial and non-f<strong>in</strong>ancialdisclosures.Energy use was the most prevalent disclosure, with 39 firms issu<strong>in</strong>g data <strong>in</strong> this area. Mostof the 39 firms reported non-f<strong>in</strong>ancial <strong>in</strong>formation, but seven companies also <strong>in</strong>cludedf<strong>in</strong>ancial <strong>in</strong>formation. Water use was the second most frequently disclosed item with 34companies issu<strong>in</strong>g <strong>in</strong>formation <strong>in</strong> this area. Of those, 32 firms issued non-f<strong>in</strong>ancial<strong>in</strong>formation, while two published f<strong>in</strong>ancial metrics <strong>in</strong> this area. Waste generation was theleast likely disclosure, with only 23 firms issu<strong>in</strong>g <strong>in</strong>formation <strong>in</strong> this area. Overall, nonf<strong>in</strong>ancialdisclosures of environmental metrics were far more common than f<strong>in</strong>ancial-relateddata.Figure 3. Number Companies Report<strong>in</strong>g on Environmental MetricsSource: UNCTADDecember 2009 - 15
<strong>Corporate</strong> <strong>Susta<strong>in</strong>ability</strong> <strong>Disclosure</strong> Practices <strong>in</strong> Emerg<strong>in</strong>g <strong>Markets</strong>D. Social IndicatorsEmployee wages and benefits was the most frequently disclosed of the five social <strong>in</strong>dicatorsand one of the most fundamental ways a company can contribute to communitydevelopment <strong>in</strong> emerg<strong>in</strong>g economies. In all, 90 companies disclosed <strong>in</strong>formation on thevalue of employee wages and/or other benefits, mak<strong>in</strong>g this <strong>in</strong>dicator the second mostoften disclosed among the study’s universe after governance structures. Of the 90disclos<strong>in</strong>g, 18 reported some type of breakdown such as employment category or gender.Most enterprises reported, at m<strong>in</strong>imum, <strong>in</strong>formation on expenditures on post-employmentbenefits, such as pensions, <strong>in</strong> their f<strong>in</strong>ancial statements.One of the most significant positive economic and social contributions an enterprise canmake to the country <strong>in</strong> which it operates comes through the creation of jobs and deliver<strong>in</strong>gskills tra<strong>in</strong><strong>in</strong>g to an unskilled work force. As displayed <strong>in</strong> Figure 5, 83 firms stated the totalnumber of their employees; of these, more than half (46) provided some form ofbreakdown such as by gender, employment type or country. In all, 26 companies <strong>in</strong> thestudy’s universe disclosed the average number of hours of tra<strong>in</strong><strong>in</strong>g per year theyadm<strong>in</strong>istered per employee, and 10 of provided a breakdown, for example, by employmentcategory or gender.Figure 4. Number of Firms Report<strong>in</strong>g on Social Indicators0 20 40 60 80 100Employee wages and benefits7218Total workforce3746Average hours of tra<strong>in</strong><strong>in</strong>g1610Workdays lost due to occupationalaccidents, <strong>in</strong>juries and illnessCollective agreements1424No breakdown by employmentcategory, gender or otherfactorBreakdown by employmentcategory, gender or otherfactorSource: UNCTAD16 - Copyright © 2009 Social Investment Forum, Wash<strong>in</strong>gton, DC
<strong>Corporate</strong> <strong>Susta<strong>in</strong>ability</strong> <strong>Disclosure</strong> Practices <strong>in</strong> Emerg<strong>in</strong>g <strong>Markets</strong>Only 14 companies disclosed the percentage of their work force covered by collectivebarga<strong>in</strong><strong>in</strong>g agreements. The low rate potentially can be attributed to a lack of will<strong>in</strong>gnesson the part of companies to discuss union representation or the mere fact that many do nothave unionized work forces. Unions and many labor and human rights groups regardrepresentation as the best safeguard aga<strong>in</strong>st workplace abuses, especially <strong>in</strong> countrieswhere enforcement of labor laws is lax.The number of workdays lost due to occupational accidents, <strong>in</strong>juries and illness can reflectthe degree to which enterprises contribute to creat<strong>in</strong>g a healthy, safe and productive workenvironment. As depicted <strong>in</strong> Figure 4, the <strong>in</strong>dicator was disclosed by 24 enterprises. Table 3displays the distribution of these 24 enterprises among the various <strong>in</strong>dustry sectors. Whilethe sample is small, companies operat<strong>in</strong>g <strong>in</strong> more labor-<strong>in</strong>tensive <strong>in</strong>dustries and those moresusceptible to <strong>in</strong>juries, such as energy, materials and <strong>in</strong>dustrials, were more likely to disclosethese statistics. In fact, companies <strong>in</strong> the materials sector were responsible for the majorityof the disclosures on workdays lost, both <strong>in</strong> absolute and <strong>in</strong> relative terms. The energy and<strong>in</strong>dustrials sectors also had a relatively high disclosure rate.Table 3. Number of Workdays Lost by Industry SectorWorkdays lost by sector <strong>Disclosure</strong> No <strong>Disclosure</strong>Energy 5 9Materials 11 6Industrials 3 6Consumer Staples 2 6F<strong>in</strong>ancials 3 22Source: UNCTADE. Governance FactorsAs mentioned earlier, governance disclosures, especially those address<strong>in</strong>g board oversight,were among the most common among the 100 firms analyzed, with 96 of the companiesissu<strong>in</strong>g <strong>in</strong>formation to shareholders <strong>in</strong> this area. Risk management objectives, systems andactivities (88 percent), ownership structure (87 percent) and <strong>in</strong>ternal control systems (86percent) also ranked high among disclosures, while policies on whistleblowers (45 percent),descriptions of decision mak<strong>in</strong>g processes for approv<strong>in</strong>g transactions (53 percent) andprocedures for assess<strong>in</strong>g and elim<strong>in</strong>at<strong>in</strong>g conflicts of <strong>in</strong>terest among board members (54percent) were among the least reported. (See Figure 5.)By country, governance disclosure rates were relatively uniform, rang<strong>in</strong>g from an average of8.4 companies per governance <strong>in</strong>dicator for Malaysia to 6.1 for Korea, with an average of7.3 for all countries. Some outliers <strong>in</strong>cluded:• Ch<strong>in</strong>a—only two firms disclosed whistleblower protections for employees.• Korea—only one company reported the decision mak<strong>in</strong>g processes for approv<strong>in</strong>gtransactions with third parties.• Malaysia—only two described whistleblower policies.• Russian Federation—only two reviewed performance evaluation processes forboard and management and only one mentioned a whistleblower policy.December 2009 - 17
<strong>Corporate</strong> <strong>Susta<strong>in</strong>ability</strong> <strong>Disclosure</strong> Practices <strong>in</strong> Emerg<strong>in</strong>g <strong>Markets</strong>Corruption is <strong>in</strong>ternationally recognized as an obstacle to economic development and ah<strong>in</strong>drance to <strong>in</strong>ternational trade and <strong>in</strong>vestment. Companies can make a positivecontribution to eradicat<strong>in</strong>g corruption by report<strong>in</strong>g on the measures taken to ensure theyare not complicit <strong>in</strong> unethical behavior, such as codes, hotl<strong>in</strong>es, protections forwhistleblowers and other oversight measures. Even though a majority of the top 10companies <strong>in</strong> Brazil, Ch<strong>in</strong>a, India, Indonesia, Malaysia and Mexico disclosed <strong>in</strong>ternal controlsystems, India was the only market where more than 80 percent of the top 10 reported on<strong>in</strong>ternal whistleblower protection policies. The average disclosure rate among all marketswas 4.5 <strong>in</strong> this category. Further, an average of five companies across the top 10 marketsdisclosed measures taken to elim<strong>in</strong>ate conflicts of <strong>in</strong>terest among board members, but Indiaand Malaysia were the only two where a majority of the top 10 firms reported these typesof safeguards.Figure 5. Number of Companies Report<strong>in</strong>g Governance InformationSource: UNCTAD18 - Copyright © 2009 Social Investment Forum, Wash<strong>in</strong>gton, DC
<strong>Corporate</strong> <strong>Susta<strong>in</strong>ability</strong> <strong>Disclosure</strong> Practices <strong>in</strong> Emerg<strong>in</strong>g <strong>Markets</strong>F. References to GRI and the Global CompactThe Global Report<strong>in</strong>g Initiative (GRI) has developed the world’s most widely usedsusta<strong>in</strong>ability report<strong>in</strong>g framework. The cornerstone of the GRI report<strong>in</strong>g framework is itsG3 Guidel<strong>in</strong>es, published <strong>in</strong> 2006. To date, more than 1,000 companies, <strong>in</strong>clud<strong>in</strong>g many ofthe world’s lead<strong>in</strong>g brands, have declared their voluntary adoption of the GRI guidel<strong>in</strong>esworldwide. 15 Nonetheless, GRI report<strong>in</strong>g is not a common practice even <strong>in</strong> developedmarkets, where only a m<strong>in</strong>ority of the largest companies produces susta<strong>in</strong>ability reports ofthis type. Of the 100-company sample for this study, only 14 supplied a GRI Index, arequirement of GRI’s G3 Guidel<strong>in</strong>es that entails direct<strong>in</strong>g report readers to where specific<strong>in</strong>formation related to GRI <strong>in</strong>dicators can be found. In addition, another four, for a total of20, made some sort of reference to GRI <strong>in</strong> their susta<strong>in</strong>ability report. (See Figure 6.)The United Nations Global Compact is the largest corporate code of conduct <strong>in</strong>itiative <strong>in</strong> theworld. 16 It is a voluntary <strong>in</strong>itiative for bus<strong>in</strong>esses that are committed to align<strong>in</strong>g theiroperations and practices with 10 universally accepted pr<strong>in</strong>ciples <strong>in</strong> the areas of humanrights, labor, environment and anti-corruption. It also has a m<strong>in</strong>or report<strong>in</strong>g requirementthat asks signatories to describe to the public an example from the past year of how theyimplemented the pr<strong>in</strong>ciples outl<strong>in</strong>ed <strong>in</strong> code. It is a far cry from a GRI report, but the GlobalCompact also encourages companies look<strong>in</strong>g to produce a susta<strong>in</strong>ability report to follow theGRI’s G3 Guidel<strong>in</strong>es. To date, the Global Compact has garnered more than 5,500 corporatesignatories from more than 130 countries. Of the 100 companies exam<strong>in</strong>ed <strong>in</strong> this study,however, only 25 referred to support for the Global Compact, and a mere five provided aGlobal Compact “Communication on Progress” (COP)—the requisite review for signatoriesof their progress <strong>in</strong> implement<strong>in</strong>g the <strong>in</strong>itiative’s pr<strong>in</strong>ciples.As mentioned earlier, the Global Compact recognizes publication of a GRI report assatisfy<strong>in</strong>g its report<strong>in</strong>g requirement. Of the 25 declar<strong>in</strong>g support for the Global Compact,four issued both a GRI <strong>in</strong>dex and a Global Compact COP, and 13 produced a GRI <strong>in</strong>dex andreferenced the Global Compact. Another two referenced GRI <strong>in</strong>dicators. Five enterprisesmade reference to the Global Compact but used neither a Global Compact progress reportnor the GRI <strong>in</strong>dex. Of the 100 companies analyzed, 28 were listed on the UN GlobalCompact website as signatories. Therefore, of the 28, only 18 were <strong>in</strong> compliance with theGlobal Compact’s report<strong>in</strong>g requirement.By country, South African companies were the most likely to make a reference to GRI, withn<strong>in</strong>e do<strong>in</strong>g so, followed by Brazilian and Korean firms, each with five mak<strong>in</strong>g reference. Thesame three countries’ companies were also among the most likely to <strong>in</strong>clude a GRI <strong>in</strong>dex.Five firms each from Brazil and South Africa published GRI <strong>in</strong>dexes, while four Koreancompanies did. South Africa also had the most companies mak<strong>in</strong>g reference to The GlobalCompact, with five companies do<strong>in</strong>g so, followed by Brazil with four, and Ch<strong>in</strong>a, India andMexico, each with three.15See the Global Report<strong>in</strong>g Initiative website at http://www.globalreport<strong>in</strong>g.org.16 See The Global Compact website at http://www.unglobalcompact.org.December 2009 - 19
<strong>Corporate</strong> <strong>Susta<strong>in</strong>ability</strong> <strong>Disclosure</strong> Practices <strong>in</strong> Emerg<strong>in</strong>g <strong>Markets</strong>Figure 6. Number of Companies Referenc<strong>in</strong>g GRI and The Global CompactSource: UNCTAD20 - Copyright © 2009 Social Investment Forum, Wash<strong>in</strong>gton, DC
<strong>Corporate</strong> <strong>Susta<strong>in</strong>ability</strong> <strong>Disclosure</strong> Practices <strong>in</strong> Emerg<strong>in</strong>g <strong>Markets</strong>IV. Comparisons to other StudiesA. Developed CountriesWhile susta<strong>in</strong>ability report<strong>in</strong>g practices among the 100 emerg<strong>in</strong>g market companiesanalyzed for this report did not run deep, their performance <strong>in</strong> this area places them not farbeh<strong>in</strong>d, and <strong>in</strong> some cases ahead of, developed markets. Although few of these effortswould qualify as a full-blown susta<strong>in</strong>ability report by most estimates, 96 percent of theemerg<strong>in</strong>g markets companies reviewed for this paper reported on at least one ESG<strong>in</strong>dicator. However, as noted, only 39 percent issued data on the environment, and only 24percent reviewed key social <strong>in</strong>dicators such as occupational <strong>in</strong>juries and illnesses.Furthermore, only 20 of the 100 companies studied made reference to the GRI’s guidel<strong>in</strong>es,and only 14 of those declared report<strong>in</strong>g <strong>in</strong> compliance with the GRI’s guidel<strong>in</strong>es andsupplied a GRI Index.Still, emerg<strong>in</strong>g markets companies held their own with, and <strong>in</strong> a few cases were moretransparent than, firms from developed countries. As tracked by <strong>Corporate</strong>Register.com,more than two thirds of the constituents <strong>in</strong> the Global FT 500 produce susta<strong>in</strong>abilityreports. 17 In addition, its recent report found that the percentage of these companiesfollow<strong>in</strong>g GRI’s report<strong>in</strong>g standards has <strong>in</strong>creased <strong>in</strong> recent years, but is still only close toone third today. Similarly, KPMG reported that 80 percent of the Global Fortune 250 nowreleases susta<strong>in</strong>ability <strong>in</strong>formation, up from 50 percent <strong>in</strong> 2005. 18 Among the world’slargest exchanges, GRI found that 64 percent of Germany’s DAX 30, 48 percent of France’sCAC 40 and 22 percent of the United K<strong>in</strong>gdom’s FTSE 100 issued susta<strong>in</strong>ability reports us<strong>in</strong>gthe G3 Guidel<strong>in</strong>es, compared with only 13 percent of the United States’ S&P 500. 19B. Emerg<strong>in</strong>g <strong>Markets</strong>As mentioned earlier, the EMDP conducted its own orig<strong>in</strong>al research <strong>in</strong> 2007 and 2008 andreleased reports on susta<strong>in</strong>ability report<strong>in</strong>g trends <strong>in</strong> emerg<strong>in</strong>g markets <strong>in</strong> January 2008 andMarch 2009. 20 Both studies, like this one, reviewed only publicly available <strong>in</strong>formation. Allthree reports have small sample sizes of the largest companies, mak<strong>in</strong>g it difficult toextrapolate f<strong>in</strong>d<strong>in</strong>gs beyond this top tier of companies, because larger companies are17 <strong>Corporate</strong>Register.com. (March 2009). CRReport<strong>in</strong>gAwards ’08, Global W<strong>in</strong>ners & Report<strong>in</strong>g Trends.Retrieved June 15, 2009, from http://www.corporateregister.com/pdf/CRRA08.pdf.18 KPMG. (October 2008). KPMG International Survey of <strong>Corporate</strong> Responsibility Report<strong>in</strong>g 2008. RetrievedJune 16, 2009, from http://www.kpmg.com/SiteCollectionDocuments/International-corporateresponsibility-survey-2008_v2.pdf.19 Global Report<strong>in</strong>g Initiative. (July 15, 2009). “Number of companies worldwide report<strong>in</strong>g on theirsusta<strong>in</strong>ability performance reaches record high, yet still a m<strong>in</strong>ority.” Retrieved July 16, 2009, fromhttp://www.globalreport<strong>in</strong>g.org/NewsEventsPress/PressResources/PressRelease_14_July_2006_1000GRIReports.htm.20 EIRIS. (March 2009). “A Review of ESG Practices <strong>in</strong> Large Emerg<strong>in</strong>g Market Companies.” Wash<strong>in</strong>gton, DC:Social Investment Forum and Susta<strong>in</strong>able Investment Research Analyst Network.KLD Research & Analytics. (January 2008). “<strong>Susta<strong>in</strong>ability</strong> Report<strong>in</strong>g <strong>in</strong> Emerg<strong>in</strong>g <strong>Markets</strong>: An analysis ofthe susta<strong>in</strong>ability report<strong>in</strong>g <strong>in</strong> selected sectors of seven emerg<strong>in</strong>g market countries.” Wash<strong>in</strong>gton, DC:Social Investment Forum and Susta<strong>in</strong>able Investment Research Analyst Network.December 2009 - 21
<strong>Corporate</strong> <strong>Susta<strong>in</strong>ability</strong> <strong>Disclosure</strong> Practices <strong>in</strong> Emerg<strong>in</strong>g <strong>Markets</strong>generally far more likely to report and are often under greater pressure to do so. However,some basic trends emerged.Coverage: In the study SIF published <strong>in</strong> January 2008, researchers analyzed publicdisclosures of 75 companies at the end of September 2007. They selected the top fourcompanies <strong>in</strong> three sectors by float-adjusted market capitalization from the S&P/IFCI Indexfrom the seven largest countries <strong>in</strong> the <strong>in</strong>dex—Brazil, Ch<strong>in</strong>a, India, Russian Federation, SouthAfrica, South Korea and Taiwan. Also, <strong>in</strong> one case, a company was excluded because it wasa hold<strong>in</strong>g company. The 2008 report focused on only three sectors—energy (oil & gas);materials (metals and m<strong>in</strong><strong>in</strong>g) and telecommunications. In some countries there werefewer than four companies <strong>in</strong> one of the sectors chosen for analysis. In Taiwan, forexample, there was only one energy company listed. In these cases, researchers did notmake substitutions and analyzed fewer companies for these countries.For the second study, conducted by EIRIS and published <strong>in</strong> March 2009, researchers chose auniverse comprised of the largest four companies by market capitalization from 10 largeemerg<strong>in</strong>g market countries—Brazil, Ch<strong>in</strong>a, India, Indonesia, Israel, South Korea, Malaysia,Mexico, Russian Federation and South Africa. Although the universe is considerably smaller,country and company selection for the March 2009 study was similar to this current reportbased on UNCTAD data.Indicators: All three reports have somewhat dist<strong>in</strong>ctive criteria for company evaluation.For the January 2008 report, researchers asked whether each company:• Had any public disclosure of ESG issues?• Published a separate section of its website and/or annual report address<strong>in</strong>gsusta<strong>in</strong>ability issues?• Issued a current (with<strong>in</strong> the last two years) and stand-alone susta<strong>in</strong>ability report?• Referenced the Global Report<strong>in</strong>g Initiative (GRI) framework for its stand-alonereport?• Reported susta<strong>in</strong>ability goals and benchmarks?Meanwhile, the March 2009 report looked at a wide range of ESG criteria, <strong>in</strong>clud<strong>in</strong>gcompany disclosures on GHG emissions and other climate change <strong>in</strong>dicators, biodiversity,human rights, supply cha<strong>in</strong> metrics, health and safety, bribery and ethics, and boardpractices.F<strong>in</strong>d<strong>in</strong>gs: The key takeaways from the January 2008 report were:• An impressive 87 percent of the companies <strong>in</strong> the sample made some susta<strong>in</strong>abilitydisclosures.• Just more than half of the 75 companies published a stand-alone susta<strong>in</strong>abilityreport.• Only 27 percent of the companies made reference to the GRI report<strong>in</strong>g framework <strong>in</strong>their reports.• Of the three sectors reviewed, energy had the best overall disclosure, lead<strong>in</strong>g theother sectors <strong>in</strong> four of the five disclosure questions.• Of the seven countries analyzed <strong>in</strong> the report, South Africa led <strong>in</strong> disclosure, whileCh<strong>in</strong>a had the greatest room for improvement.22 - Copyright © 2009 Social Investment Forum, Wash<strong>in</strong>gton, DC
<strong>Corporate</strong> <strong>Susta<strong>in</strong>ability</strong> <strong>Disclosure</strong> Practices <strong>in</strong> Emerg<strong>in</strong>g <strong>Markets</strong>Similarly, the March 2009 report found:• Public disclosure of key governance issues was high, <strong>in</strong>clud<strong>in</strong>g directorsremuneration (33 out of 40 companies) and the separation of the roles of chair andCEO (28 out of 40 companies).• Companies scored much better <strong>in</strong> environmental areas than <strong>in</strong> social areas, withsome reach<strong>in</strong>g parity with developed country environmental leaders <strong>in</strong>environmental performance and management systems.• Firms <strong>in</strong> higher impact sectors, <strong>in</strong>clud<strong>in</strong>g those <strong>in</strong> the resources sectors, performedbetter on issues such as health and safety and the environment, where the risks aretypically greater. However, climate change disclosure rema<strong>in</strong>s, <strong>in</strong> general, an areawhere emerg<strong>in</strong>g market companies lag <strong>in</strong> establish<strong>in</strong>g good report<strong>in</strong>g practices.• The selected South African and Brazilian companies stood out overall as consistentlyhav<strong>in</strong>g the highest assessments among the companies sampled. These countries alsodeveloped some of the first responsible <strong>in</strong>vestment <strong>in</strong>dices <strong>in</strong> emerg<strong>in</strong>g markets,acknowledg<strong>in</strong>g <strong>in</strong>vestor <strong>in</strong>terest with ESG performance.Analysis: All three studies found that almost all companies (83 – 96 percent) disclosedsome type of ESG <strong>in</strong>formation, and the most common was governance related data. Inaddition, all three concluded that there was little depth to the <strong>in</strong>formation published. Forexample, both the 2008 report and this one found that few companies (20 to 31 percent)produced reports referenc<strong>in</strong>g GRI. All three concluded that the extractive <strong>in</strong>dustries werethe most likely to disclose susta<strong>in</strong>ability data on health and safety, as well as environmentalperformance, and were the most likely to be scrut<strong>in</strong>ized on these issues and havecontroversies related to them. On a country basis, all three reports po<strong>in</strong>ted to Brazil andSouth Africa as hav<strong>in</strong>g the best disclosure practices. As mentioned earlier, both countrieshave exchanges with SRI <strong>in</strong>dexes, and, <strong>in</strong> South Africa’s case, there are list<strong>in</strong>g requirementsfor the top 40 companies to disclose ESG data. All three studies gave Ch<strong>in</strong>a low marks, withthe two 2009 reports also not<strong>in</strong>g that India and Indonesia had some of the lowest levels oftransparency. This latest report also gave Mexico a subpar grade on this count. All threereports po<strong>in</strong>t to a wide array of corporate practices and country norms.December 2009 - 23
<strong>Corporate</strong> <strong>Susta<strong>in</strong>ability</strong> <strong>Disclosure</strong> Practices <strong>in</strong> Emerg<strong>in</strong>g <strong>Markets</strong>V. Conclusions and RecommendationsGiven the large differences <strong>in</strong> report<strong>in</strong>g practices among the emerg<strong>in</strong>g markets analyzed,it would make sense for EMDP country teams to take develop <strong>in</strong>dividual strategies forselect<strong>in</strong>g companies and topics for engagement and sett<strong>in</strong>g <strong>in</strong>terim goals. For example, <strong>in</strong>South Africa, where susta<strong>in</strong>ability report<strong>in</strong>g is a common practice, at least among largecompanies, the country team should focus on br<strong>in</strong>g<strong>in</strong>g all companies <strong>in</strong>to compliance with<strong>in</strong>ternational disclosure standards such as the GRI’s G3 Guidel<strong>in</strong>es and the Carbon <strong>Disclosure</strong>Project’s annual questionnaire. In Ch<strong>in</strong>a, India and Indonesia, where report<strong>in</strong>g is lesscommon, teams should focus on support<strong>in</strong>g local <strong>in</strong>stitutional and consult<strong>in</strong>g capacity andon target<strong>in</strong>g companies with little or no disclosure to encourage some basic report<strong>in</strong>g. Oncereport<strong>in</strong>g is universal, teams can start to exam<strong>in</strong>e and encourage better performanceamong companies <strong>in</strong> mitigat<strong>in</strong>g ESG risks and capitaliz<strong>in</strong>g on opportunities <strong>in</strong> these areas.While country-specific issues and report<strong>in</strong>g needs are <strong>in</strong>evitable, all country teams shouldencourage companies to use the GRI’s latest guidance, the G3 Guidel<strong>in</strong>es, when report<strong>in</strong>gto ensure consistency and comparability <strong>in</strong> data. For SRI funds look<strong>in</strong>g to developportfolios <strong>in</strong>clud<strong>in</strong>g equities traded <strong>in</strong> several emerg<strong>in</strong>g markets, or global portfolios<strong>in</strong>clud<strong>in</strong>g companies from developed as well as develop<strong>in</strong>g economies, it is important tohave comparable ESG <strong>in</strong>formation to make <strong>in</strong>vestment decisions. Even for <strong>in</strong>vestors look<strong>in</strong>gto take a weighted, best-<strong>in</strong>-country approach, compar<strong>in</strong>g relative ESG performance trendsacross countries would be a useful tool <strong>in</strong> establish<strong>in</strong>g country weight<strong>in</strong>gs <strong>in</strong> an SRI<strong>in</strong>vestment vehicle. Others also would f<strong>in</strong>d comparable data useful <strong>in</strong> prioritiz<strong>in</strong>gengagement activities.In all markets, it is important for country teams to encourage new <strong>in</strong>vestors to engagecompanies on the issue of susta<strong>in</strong>ability report<strong>in</strong>g. As a first step, <strong>in</strong>vestors can make acommitment to support the EMDP and its activities by sign<strong>in</strong>g onto the EMDP InvestorStatement on <strong>Susta<strong>in</strong>ability</strong> Report<strong>in</strong>g <strong>in</strong> Emerg<strong>in</strong>g <strong>Markets</strong>. To date, <strong>in</strong>vestors with morethan $960 billion <strong>in</strong> assets under management have signed onto the statement, althoughthis represents only about 5 percent of the $18 trillion <strong>in</strong> assets under management held byUN PRI signatories. Gett<strong>in</strong>g more <strong>in</strong>vestors <strong>in</strong>volved will only improve results from thecorporate engagement efforts of all of the teams and tapp<strong>in</strong>g UNPRI signatories is apromis<strong>in</strong>g prospect. UN PRI signatories pledge to ask companies they <strong>in</strong>vest <strong>in</strong> for“standardized report<strong>in</strong>g on ESG issues us<strong>in</strong>g tools such as the Global Report<strong>in</strong>g Initiative”and “ESG issues to be <strong>in</strong>tegrated with<strong>in</strong> annual f<strong>in</strong>ancial reports.” A copy of the EMDPstatement appears as an annex to this report on page 28. After all, ESG data is critical to all<strong>in</strong>vestors to evaluate a company’s f<strong>in</strong>ancial health and risk management, as this <strong>in</strong>formationaugments f<strong>in</strong>ancial analysis by <strong>in</strong>dicat<strong>in</strong>g material risks and potential liabilities that are oftenoverlooked by securities analysts.As some of the best ESG report<strong>in</strong>g practices spr<strong>in</strong>g from countries with regulations, list<strong>in</strong>grequirements and exchange-sponsored SRI <strong>in</strong>dexes, <strong>in</strong>vestors also should use theirleverage with government and stock exchanges to promote these reforms. Regulation andlist<strong>in</strong>g requirements are the fastest track for <strong>in</strong>vestors to achieve universal susta<strong>in</strong>abilityreport<strong>in</strong>g. Therefore, efforts to promote these changes must be undertaken <strong>in</strong> parallel withthose to engage companies <strong>in</strong>dividually to encourage ESG report<strong>in</strong>g.24 - Copyright © 2009 Social Investment Forum, Wash<strong>in</strong>gton, DC
<strong>Corporate</strong> <strong>Susta<strong>in</strong>ability</strong> <strong>Disclosure</strong> Practices <strong>in</strong> Emerg<strong>in</strong>g <strong>Markets</strong>• INDUSTRIAS PENOLES CP• TELEFONOS MEXICO• WALMART MEXICORussian Federation• GAZPROM• LUKOIL HOLDING*• MOBILE TELESYSTEMS*• NORILSK NICKEL• NOVATEK GDR• SBERBANK RUSSIA• SURGUTNEFTEGAZ• TATNEFT COMMON• UNIFIED ENERGY• VIMPELCOMSouth Africa• ANGLO PLATINUM• ANGLOGOLD ASHANTI*• FIRSTRAND*• GOLD FIELDS• IMPALA PLATINUM HOLDINGS*• MTN GROUP• NASPERS• REMGRO• SASOL*• STANDARD BANK GROUPSouth Korea• HYUNDAI HEAVY INDUSTRIES• HYUNDAI MOTOR CO.*• KEPCO KOREA ELECTRIC POWER• KOOKMIN BANK*• KT and G CORP(KOREA TOBACCO)• LG ELECTRONICS• POSCO• SAMSUNG ELECTRONICS CO• SHINHAN FINANCIAL GROUP*• SHINSEGAE CODecember 2009 - 27
<strong>Corporate</strong> <strong>Susta<strong>in</strong>ability</strong> <strong>Disclosure</strong> Practices <strong>in</strong> Emerg<strong>in</strong>g <strong>Markets</strong>VII. Annex: EMDP Investor Statement on <strong>Susta<strong>in</strong>ability</strong> Report<strong>in</strong>g <strong>in</strong>Emerg<strong>in</strong>g <strong>Markets</strong>A. Statement (Published <strong>in</strong> June 2008)Introduction: Global <strong>in</strong>stitutional <strong>in</strong>vestors represent<strong>in</strong>g more than $960 billion <strong>in</strong> assetsunder management encourage companies <strong>in</strong> emerg<strong>in</strong>g markets to provide better<strong>in</strong>formation on their management of environmental, social, and corporate governance (ESG)issues. Often called “susta<strong>in</strong>ability report<strong>in</strong>g”, such <strong>in</strong>formation can help <strong>in</strong>vestorsdeterm<strong>in</strong>e which companies are best positioned to deliver strong long-term <strong>in</strong>vestmentperformance.Companies <strong>in</strong>creas<strong>in</strong>gly understand that effective management of susta<strong>in</strong>ability challengesand opportunities can contribute directly to f<strong>in</strong>ancial success by:• Allow<strong>in</strong>g companies to reach a broader range of <strong>in</strong>vestors• Achiev<strong>in</strong>g greater operational efficiency• Improv<strong>in</strong>g enterprise-wide risk management• Mak<strong>in</strong>g more strategic capital expenditures decisions• Enhanc<strong>in</strong>g customer loyalty and develop<strong>in</strong>g new customers• Improv<strong>in</strong>g brand position<strong>in</strong>g• Develop<strong>in</strong>g market leadershipHowever, <strong>in</strong> order for such actions to be properly valued by f<strong>in</strong>ancial markets, companiesmust disclose <strong>in</strong>formation about their ESG programs and the progress made toward meet<strong>in</strong>gspecific ESG bus<strong>in</strong>ess objectives. For this reason, over 2,300 global companies, <strong>in</strong>clud<strong>in</strong>gmore than half of the global Fortune 250, issued susta<strong>in</strong>ability reports <strong>in</strong> 2006, accord<strong>in</strong>g toCoporateRegister.com.<strong>Susta<strong>in</strong>ability</strong> disclosure <strong>in</strong> emerg<strong>in</strong>g markets: As the role of emerg<strong>in</strong>g market companies<strong>in</strong> the global economy <strong>in</strong>creases, so do <strong>in</strong>vestor expectations for these companies. Emerg<strong>in</strong>gmarkets represent important <strong>in</strong>vestment areas, but a lack of transparency can hamperpotential <strong>in</strong>vestment. Specifically, <strong>in</strong>vestors often do not have enough <strong>in</strong>formation on themanner <strong>in</strong> which companies <strong>in</strong> emerg<strong>in</strong>g markets have assessed and responded to risks andopportunities related to susta<strong>in</strong>ability issues—and how these risks and opportunities mightaffect future f<strong>in</strong>ancial performance and valuation.In particular the signatories of this statement encourage all companies to enhancetransparency by work<strong>in</strong>g towards:• Provid<strong>in</strong>g regularly updated ESG disclosure <strong>in</strong> f<strong>in</strong>ancial reports or <strong>in</strong> specializedsusta<strong>in</strong>ability reports, focus<strong>in</strong>g on the most material bus<strong>in</strong>ess risks andopportunities.• Sett<strong>in</strong>g clear goals and disclos<strong>in</strong>g progress towards meet<strong>in</strong>g targets.• Utiliz<strong>in</strong>g the Global Report<strong>in</strong>g Initiative (GRI) framework <strong>in</strong> prepar<strong>in</strong>g their reports. Ata m<strong>in</strong>imum, we recommend that companies list exactly which GRI <strong>in</strong>dicators areaddressed <strong>in</strong> their reports as part of a “GRI Index.”28 - Copyright © 2009 Social Investment Forum, Wash<strong>in</strong>gton, DC
<strong>Corporate</strong> <strong>Susta<strong>in</strong>ability</strong> <strong>Disclosure</strong> Practices <strong>in</strong> Emerg<strong>in</strong>g <strong>Markets</strong>• Cont<strong>in</strong>ually improv<strong>in</strong>g report<strong>in</strong>g based on feedback from key stakeholder groups,<strong>in</strong>clud<strong>in</strong>g both f<strong>in</strong>ancial stakeholders and non-f<strong>in</strong>ancial stakeholders, such asemployees, customers, and relevant community and civil society groups.Why susta<strong>in</strong>ability report<strong>in</strong>g: Disclos<strong>in</strong>g environmental and social performance data iscritical to <strong>in</strong>vestors for evaluat<strong>in</strong>g:• F<strong>in</strong>ancial health and risk management, as this <strong>in</strong>formation augments f<strong>in</strong>ancialanalysis by <strong>in</strong>dicat<strong>in</strong>g material risks and potential liabilities that are often overlookedby general account<strong>in</strong>g standards.• Management quality, as ESG issues management can be used as a proxy for strongcorporate governance and serve as an <strong>in</strong>dicator of a company’s overall managementquality.• Competitive position<strong>in</strong>g, as firms <strong>in</strong> emerg<strong>in</strong>g markets are <strong>in</strong>creas<strong>in</strong>gly compet<strong>in</strong>gglobally and will be assessed accord<strong>in</strong>g to their ability to comply with evolv<strong>in</strong>g<strong>in</strong>ternational standards such as the European Union’s Restriction of Use of certa<strong>in</strong>Hazardous Substances Directive (RoHS) and the Waste Electrical and ElectronicEquipment Directive (WEEE) regulations.• In addition, home country standards are chang<strong>in</strong>g quickly and creat<strong>in</strong>g opportunitiesfor companies with forward look<strong>in</strong>g environmental and labor policies and programsto dist<strong>in</strong>guish themselves.• Growth potential, as there is a large and grow<strong>in</strong>g body of evidence <strong>in</strong>dicat<strong>in</strong>g thatcompanies that are pro-active environmental stewards, responsive corporatecitizens, and strong employers, are more likely to create long-term shareholdervalue.Why the GRI: We urge companies to use the GRI <strong>Susta<strong>in</strong>ability</strong> Report<strong>in</strong>g Guidel<strong>in</strong>es(“Guidel<strong>in</strong>es”) to <strong>in</strong>form company report<strong>in</strong>g, and <strong>in</strong> so do<strong>in</strong>g, <strong>in</strong>crease the credibility,comparability, and utility of their report<strong>in</strong>g efforts. A GRI-based report also serves as astrong “Communication on Progress” for corporate signatories of the Global Compact.The Global Report<strong>in</strong>g Initiative (www.globalreport<strong>in</strong>g.org) is an <strong>in</strong>ternational organizationdeveloped by bus<strong>in</strong>esses work<strong>in</strong>g with a broad base of global organizations. The GRIprovides guidance on susta<strong>in</strong>ability report<strong>in</strong>g process and content through the GRIGuidel<strong>in</strong>es, a flexible report<strong>in</strong>g system that allows companies to focus on the issues mostrelevant to company operations. More than 1,000 organizations globally currently use theGRI Guidel<strong>in</strong>es <strong>in</strong> develop<strong>in</strong>g their susta<strong>in</strong>ability report<strong>in</strong>g. A recent report by theSusta<strong>in</strong>able Investment Research Analyst Network (SIRAN) showed that 27 percent of largeemerg<strong>in</strong>g market companies <strong>in</strong> three sectors now reference GRI <strong>in</strong> their public susta<strong>in</strong>abilityreport<strong>in</strong>g.Conclusion: This group of signatories believes that the next generation of lead<strong>in</strong>gcompanies will dist<strong>in</strong>guish themselves through their commitment to susta<strong>in</strong>ability, asdemonstrated through robust susta<strong>in</strong>ability report<strong>in</strong>g, and will be correspond<strong>in</strong>gly rewardedby the market.December 2009 - 29
<strong>Corporate</strong> <strong>Susta<strong>in</strong>ability</strong> <strong>Disclosure</strong> Practices <strong>in</strong> Emerg<strong>in</strong>g <strong>Markets</strong>B. Signatories as of December 2009InvestorsAPG Asset ManagementAustralian Ethical Investment Ltd.Bank Negara Indonesia (BNI)BatirenteBoston Common Asset Management, LLCCalvert InvestmentsClean Yield GroupDnB NOR Asset ManagementDexia Asset ManagementDom<strong>in</strong>i Social Investments LLCE. Capital Partners International SAEcoFrontierElement Investment ManagersEM Capital Management, LLCThe Ethical Council (AP1, AP2, AP3, and AP4),SwedenThe Ethical Funds CompanyF&C Management LimitedFortis/BNP ParibasFuturegrowth Asset ManagementGovernment Employees Pension Fund ofSouth AfricaHarr<strong>in</strong>gton Investments, Inc.Henderson Global Investors, Susta<strong>in</strong>able andResponsible InvestmentInhance Investment Management, Inc.JamsostekMacif GestionM<strong>in</strong>aca SelarasMMAMn Services N.V.Neuberger Berman Socially Responsive FundNew York City Pension FundsNorthStar Asset ManagementPax WorldPREVI – Caixa de Previdência dos Funcionáriosdo Banco do BrasilResponsible ResearchSanta Fé PortfóliosSantander Asset ManagementSNS Asset Management N.V.Trillium Asset Management CorporationWalden Asset Management, a division ofBoston Trust & InvestmentManagement CompanyW<strong>in</strong>slow Management CompanyAffiliated Supporters:Asset4Association for Susta<strong>in</strong>able and ResponsibleInvestment <strong>in</strong> Asia (ASrIA)Brazilian Foundation for Susta<strong>in</strong>ableDevelopment (FBDS)Brazilian Institute of <strong>Corporate</strong> GovernanceConservation InternationalCentre for Australian Ethical Research (CAER)Centre InfoCERESEthical Investment Research Services Ltd.(EIRIS)European Social Investment Forum (EuroSif)Indonesia Stock ExchangeIndonesiaWISEInnovest (now part of RiskMetrics Group)Jantzi Research Inc. (now part ofSusta<strong>in</strong>alytics)KLD Research & Analytics (now part ofRiskMetrics Group)Korea CSR Research Service (KOCSR)RiskMetrics GroupShareholder Association for Research andEducationSusta<strong>in</strong>able Ventures30 - Copyright © 2009 Social Investment Forum, Wash<strong>in</strong>gton, DC